R E S E A R C H
Open Access
Default mode network in young male adults with
autism spectrum disorder: relationship with autism
spectrum traits
Minyoung Jung
1, Hirotaka Kosaka
1,2,3,4*, Daisuke N Saito
2,4, Makoto Ishitobi
3,5, Tomoyo Morita
6, Keisuke Inohara
3,
Mizuki Asano
2,3, Sumiyoshi Arai
1, Toshio Munesue
1,7, Akemi Tomoda
1,2, Yuji Wada
2,3, Norihiro Sadato
4,8,
Hidehiko Okazawa
2,4and Tetsuya Iidaka
9Abstract
Background:Autism spectrum traits are postulated to lie on a continuum that extends between individuals with autism and individuals with typical development (TD). Social cognition properties that are deeply associated with autism spectrum traits have been linked to functional connectivity between regions within the brain’s default mode network (DMN). Previous studies have shown that the resting-state functional connectivities (rs-FCs) of DMN are low and show negative correlation with the level of autism spectrum traits in individuals with autism spectrum disorder (ASD). However, it is unclear whether individual differences of autism spectrum traits are associated with the strength of rs-FCs of DMN in participants including the general population.
Methods:Using the seed-based approach, we investigated the rs-FCs of DMN, particularly including the following two core regions of DMN: the anterior medial prefrontal cortex (aMPFC) and posterior cingulate cortex (PCC) in 19 young male adults with high-functioning ASD (mean age = 25.3 ± 6.9 years; autism-spectrum quotient (AQ) = 33.4 ± 4.2; full scale IQ (F-IQ) = 109.7 ± 12.4) compared with 21 age- and IQ-matched young male adults from the TD group (mean age = 24.8 ± 4.3 years; AQ = 18.6 ± 5.7; F-IQ = 109.5 ± 8.7). We also analyzed the correlation between the strength of rs-FCs and autism spectrum traits measured using AQ score.
Results:The strengths of rs-FCs from core regions of DMN were significantly lower in ASD participants than TD participants. Under multiple regression analysis, the strengths of rs-FCs in brain areas from aMPFC seed showed negative correlation with AQ scores in ASD participants and TD participants.
Conclusions:Our findings suggest that the strength of rs-FCs in DMN is associated with autism spectrum traits in the TD population as well as patients with ASD, supporting the continuum view. The rs-FCs of DMN may be useful biomarkers for the objective identification of autism spectrum traits, regardless of ASD diagnosis.
Keywords: Autism spectrum disorder (ASD), Autism spectrum traits, Autism-spectrum quotient (AQ), Default mode network (DMN), Resting-state functional connectivities (rs-FCs), Anterior medial prefrontal cortex (aMPFC), Posterior cingulate cortex (PCC)
* Correspondence:hirotaka@u-fukui.ac.jp
1Developmental Emotional Intelligence, Division of Developmental Higher Brain Functions, Department of Child Development United Graduate School of Child Development, Osaka University, Kanazawa University, Hamamatsu University School of Medicine, Chiba University and University of Fukui, Fukui, Eiheiji 910-1193, Japan
2Research Center for Child Mental Development, University of Fukui, Fukui, Eiheiji 910-1193, Japan
Full list of author information is available at the end of the article
Background
Autism spectrum disorder (ASD) is a complex neurode-velopmental disorder characterized by impaired social communication and social interaction, and unusually re-stricted, repetitive behaviors and interests [1,2]. These characteristics are postulated to lie on a continuum that extends between individuals with autism and individuals with typical development (TD) [3,4]. This continuum view suggests the possibility that autism spectrum traits are found not only at high levels in individuals with ASD but also at lower levels among individuals without ASD [5-7]. This continuum view shifts us away from merely categorical diagnosis towards the quantitative sup-port of daily difficulties associated with autism spectrum traits of each individual regardless of ASD diagnosis. Taking the quantitative support into consideration neces-sitates the use of an instrument that can quantify autism spectrum traits in the entire population; such an instru-ment could also be used to define the broader autism phenotype [8,9].
To identify the level of autism spectrum traits, several instruments have been developed. The autism-spectrum quotient (AQ) questionnaire is a useful instrument that was developed for identifying the extent of aut-istic spectrum traits, assuming that adults of normal intelligence may have autism spectrum traits at vari-ous levels [10]. Moreover, AQ is a validated measure of autism spectrum characteristics found within both the typical population and individuals with a diagnosis of autism [10,11].
Recent behavioral studies have shown that individual differences in autism spectrum traits measured using AQ are associated with the performance of social cogni-tion processing tasks such as self-focused attencogni-tion, mind reading, episodic memory, and inferring others’ mental state in both a population with ASD and that with TD [12-15]. Neuroimaging studies also demonstrate that autism spectrum traits measured using AQ are as-sociated with structural and functional abnormalities in brain regions including the insula, inferior frontal gyrus, and posterior cingulate cortex (PCC), which are involved in social cognition processing in individuals with and without ASD [16-18]. Taken together, these findings in-dicate that it is very important to evaluate the neuroim-aging studies considering the level of autism spectrum traits.
Social and self-referential cognitive processes have been linked with cortical midline brain regions such as PCC and the medial prefrontal cortex (MPFC), reflecting the high functional connectivities within the default mode network (DMN) [19,20]. In healthy individuals with TD, the functional connectivities of DMN are consistently deactivated when the individual is engaged in a cognitively demanding, goal-oriented task [21]. On the other hand,
brain regions of the DMN are often engaged during social cognition processing tasks such as self-reference and the
‘theory of mind’ [22-24]. This marked overlap between brain regions of the DMN and regions of the‘social brain’ suggests that the brain regions of the DMN are strongly associated with the social cognition process [25,26].
Several studies of the DMN in individuals with ASD have shown its lower functional connectivities in resting-state functional magnetic resonance imaging (rs-fMRI), using the approaches of both region of interest (ROI) ana-lysis and independent component anaana-lysis (ICA), than in individuals with TD [27-32]. In addition, these studies also showed negative correlations between the strength of the resting-state functional connectivity (rs-FC) of DMN and autism spectrum traits including social deficits in individ-uals with ASD. However, these studies have primarily in-vestigated correlations between the strength of rs-FCs of DMN and autism spectrum traits only in individuals with ASD [27,29,31]. To the best of our knowledge, the individ-ual differences in autism spectrum traits regarding social cognition processing, which may also be associated with the strength of rs-FCs of DMN in individuals with or with-out ASD, have not been evaluated.
The aims of this study were: (1) to clarify the rs-FCs of DMN in high-functioning young male adults with ASD by comparison with age- and IQ-matched young male adults with TD on the basis of the location of ROIs within DMN during rs-fMRI; and (2) to evaluate correla-tions between the strength of rs-FCs of DMN and autism spectrum traits measured using AQ scores in TD partici-pants and ASD participartici-pants, respectively.
Methods
Participants
or a lifetime history of alcohol or drug dependence, were excluded from this study. They were screened to exclude individuals who had a first degree relative with an Axis I disorder, diagnosed on the basis of the DSM-IV criteria. IQ was assessed using the Wechsler Adult Intelligence Scale-III (WAIS-III) [37]. All the participants had full scale IQ (F-IQ) scores >85. There were no significant differ-ences between the groups in terms of age, verbal IQ, per-formance IQ, and F-IQ (all P >0.5). All the participants also completed the AQ questionnaire [10]. The protocol used for this study was approved by the ethics committee of the University of Fukui. After a complete explanation of the study, all the participants provided written, informed consent. Their mean age, handedness, IQ and AQ score are shown in Table 1.
fMRI data acquisition
Functional images were acquired with T2*-weighted gradient-echo echo-planar imaging (EPI) sequence using a 3-T imager (Discovery MR 750; General Electric Med-ical Systems, Milwaukee, WI, USA) and a 32-channnel head coil. Two hundred and one volumes were acquired in each participant. Each volume consisted of 40 slices, with a thickness of 3.5 mm and a 0.5 mm gap to cover the entire brain. The time interval between two succes-sive acquisitions of the same slice (repetition time, TR) was 2,300 ms, with an echo time (TE) of 30 ms and a flip
angle (FA) of 81 degrees. The field of view (FOV) was 192 × 192 mm and the matrix size was 64 × 64, giving volume dimensions of 3 × 3 mm. The participants were instructed to close their eyes but stay awake and think of nothing in particular. A total of 201 volumes were ac-quired for a total imaging time of 7 min 42 s. The experi-ment was conducted at the Biomedical Imaging Research Center of the University of Fukui.
fMRI data analysis
Preprocessing
Data were analyzed using SPM8 software (Wellcome Department of Imaging Neuroscience, London, UK). After discarding the first five volumes, all volumes were realigned spatially to the mean volume, and the signal from each slice was realigned temporally to that ob-tained from the middle slice using sinc interpolation. The resliced volumes were normalized to the Montreal Neurological Institute (MNI) space with a voxel size of 2 × 2 × 2 mm using the EPI template of SPM8. The nor-malized images were spatially smoothed with a 6-mm Gaussian kernel.
Rs-fMRI datasets were processed using a toolkit of the Data Processing Assistant for Resting-State fMRI (DPARSF; http://www.restfmri.net) [38]. We conducted additional processing as follows: (1) removing the lin-ear trend in the time series; and (2) performing tempor-ally bandpass filtering (0.01-0.08 Hz) to reduce the effects of low-frequency drift and high-frequency noise [39,40]. To control the non-neural noise in the time series [41]; (3) several sources of spurious variance, that is, six parameters from the rigid body correction of head motion, white matter signals, CSF signals, and global signals were removed from the data through lin-ear regression [42].
Head movement parameters
Rs-FCs of DMN are significantly affected by the head motion of participants during fMRI scanning; that is, long-distance correlations are decreased by participant motion, whereas many short-distance correlations are increased [43-47]. To investigate the effect of head motion and motion artifacts in rs-FCs, the root mean square (RMS) of six movement parameters obtained in the realignment process (x-, y-, z translations and x-, y-, z rotations), mean frame-to-frame RMS motion [43] and frame-wise displacement (FD) [45] were calculated for each participant. There were no significant differences in RMS (Pvalues ranged from 0.17 to 0.70), mean
frame-to-frame RMS motion (P value was 0.11) and FD (P value was 0.14) between the groups. In addition, there is no significant relationship between AQ scores and the six RMS head movement parameters (P values ranged from 0.10 to 0.78).
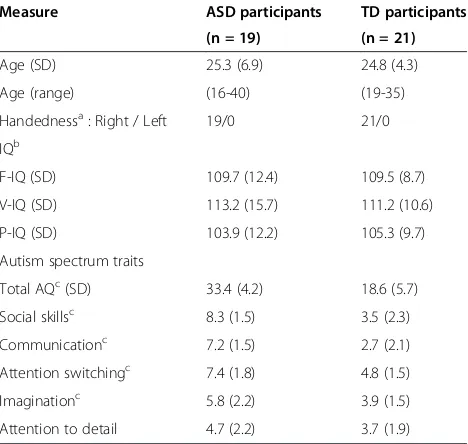
Table 1 Demographic data, IQ and AQ scores of participants
Measure ASD participants TD participants
(n = 19) (n = 21)
Age (SD) 25.3 (6.9) 24.8 (4.3)
Age (range) (16-40) (19-35)
Handednessa: Right / Left 19/0 21/0
IQb
F-IQ (SD) 109.7 (12.4) 109.5 (8.7)
V-IQ (SD) 113.2 (15.7) 111.2 (10.6)
P-IQ (SD) 103.9 (12.2) 105.3 (9.7)
Autism spectrum traits
Total AQc(SD) 33.4 (4.2) 18.6 (5.7)
Social skillsc 8.3 (1.5) 3.5 (2.3)
Communicationc 7.2 (1.5) 2.7 (2.1)
Attention switchingc 7.4 (1.8) 4.8 (1.5)
Imaginationc 5.8 (2.2) 3.9 (1.5)
Attention to detail 4.7 (2.2) 3.7 (1.9)
aAssessed by the Edinburgh handedness inventory [36]. All participants were right-handed.
bIntelligence quotient was measured using the Wechsler Adult Intelligence
Scale-Third Edition in all the participants.
cP<0.01, with the independent-samples t-test, comparison between participants with ASD and TD.
Definition of ROIs
To clarify the rs-FCs of DMN in the present study, we defined the regions in the anterior MPFC (aMPFC) and PCC as ROIs. The ROI coordinates were selected from the DMN meta-analysis [48]. The seed regions of the aMPFC and PCC comprise core seeds within the func-tional connectivity of DMN, and their widespread connec-tivities are supported by connectional anatomy studies [48-50]. Two spherical ROIs of 8 mm radius centered at a coordinate listed in Table 2 were drawn for each partici-pant in line.
Rs-FC analysis
After the processing of rs-fMRI data, we used the prede-fined seed regions for voxel-wise rs-FC analyses using the DPARSF toolbox. The mean time course of all voxels in each seed ROI was used to calculate voxel-wise linear correlations (Pearson’s correlation) in the whole brain during the rs-fMRI period. Individuals’ r values were normalized to z values using Fisher’s z transformation. At the group level, each image pertaining to z values reflecting a correlation between the seed ROI and each voxel of the brain was entered into a random effect two-sample t-test to identify the whole-brain regions showing significant differences between the groups with ASD and TD. In seed-based rs-FC analyses, glo-bal time series, computed across all brain voxels, along with six motion parameters, were used as additional covariates to remove confounding effects of physio-logic noise and participant movement. For the presen-tation purpose, rs-FCs from the aMPFC and PCC seed ROIs are shown separately for each group at the threshold ofP= 0.05 with a family wise error correction (Figure 1). Results were corrected between group comparisons, set at P= 0.001, uncorrected at peak level, and P= 0.05 with cluster level.
Relationships among rs-FCs of group differences with AQ or IQ
To confirm the relationship between the significant dif-ference in strength of rs-FCs and autism spectrum traits
or IQ, we calculated correlations between AQ scores, F-IQ and the Z values, which were extracted from the re-gions showing the strength of rs-FCs of significant group differences (Spearman’s rank order correlation coefficients; the statistical threshold was set atP= 0.01).
Multiple regression analysis among the strength of rs-FC with AQ, IQ, or age
To investigate the relationships among the strength of rs-FC, autism spectrum traits, IQ, or age across each group, we performed additional analyses of nine inde-pendent variables in a multiple regression analysis in SPM8, AQ total scores, F-IQ, age, and RMS of six move-ment parameters as covariates. The statistical threshold for contrasts was P <0.001 uncorrected for height and cluster P <0.05 corrected for multiple comparisons. In
addition, we tested whether the five AQ subscale scores would also show correlations with the brain regions and we observed correlations in each group.
Results
Differences in the strength of rs-FCs in DMN between groups
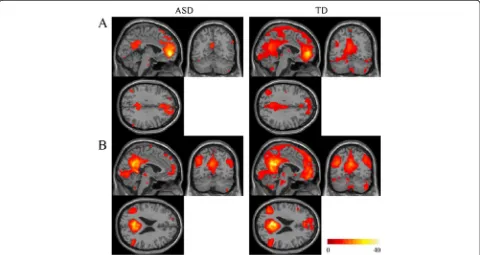
Rs-FCs from the aMPFC and PCC seed regions were distributed in the medial parts of the brain (Figure 1). In the ASD group compared with the TD group, substantially smaller areas were functionally connected with these seed regions.
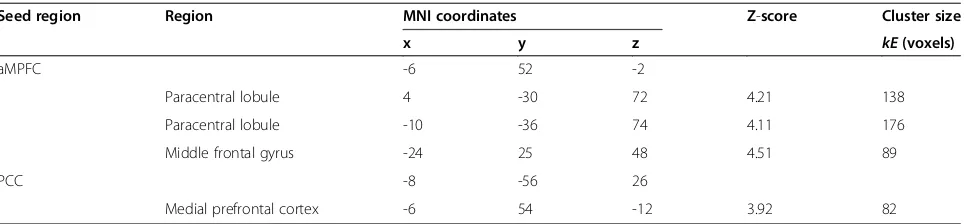
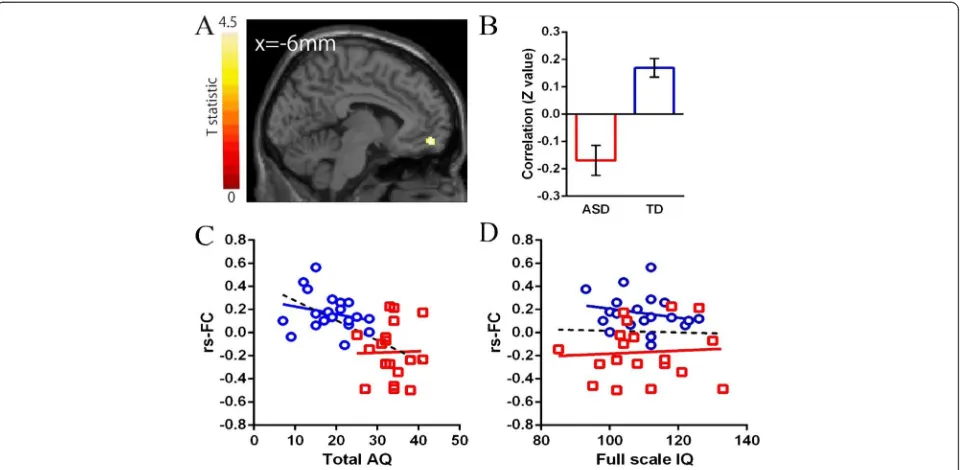
In the ROIs within the DMN, significant differences in the strength of rs-FCs from the aMPFC seed were ob-served in the paracentral lobuli and middle frontal gyrus (MFG) between the two groups (Table 2, Figure 2). A significant difference in rs-FCs from the PCC seed was observed in the MPFC between the groups (Table 2, Figure 3). The mean correlation coefficient (Fisher z-transformed) for each group is shown in Figure 2 and Figure 3. The strengths of all of these rs-FCs were lower in the ASD group compared with the TD group. Individ-uals with ASD showed no significantly higher strength of rs-FCs from the seed regions compared with the TD group.
Table 2 Significant differences in rs-FCs between groups with ASD and TD (TD >ASD)
Seed region Region MNI coordinates Z-score Cluster size
x y z kE(voxels)
aMPFC -6 52 -2
Paracentral lobule 4 -30 72 4.21 138
Paracentral lobule -10 -36 74 4.11 176
Middle frontal gyrus -24 25 48 4.51 89
PCC -8 -56 26
Medial prefrontal cortex -6 54 -12 3.92 82
Relationship between the strength of rs-FCs of group differences and AQ or IQ
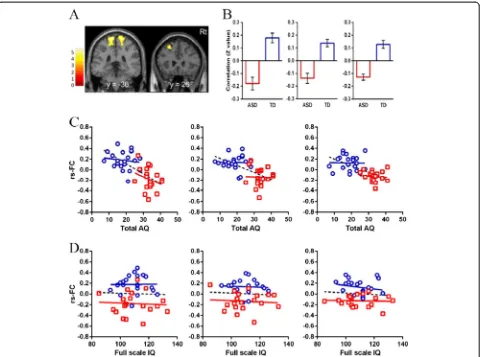
In the ASD group, there were no significant correlations between either the strength of rs-FCs and F-IQ or AQ total score (Figure 2; Figure 3,P>0.01). In the TD group, there were also no significant correlations between ei-ther the strength of rs-FCs and F-IQ or AQ total score (Figure 2; Figure 3,P>0.01).
Relationship with AQ or IQ in the multiple regression analysis
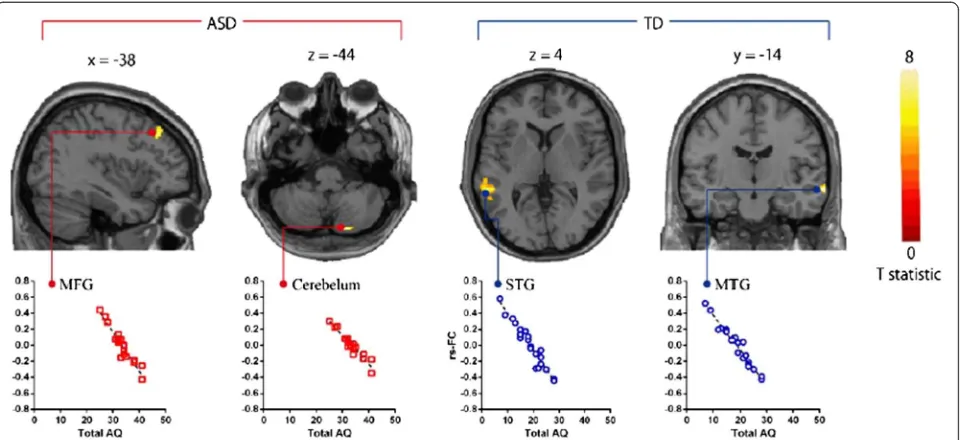
In the ASD group, AQ total scores were significantly nega-tively correlated with the strength of rs-FC in aMPFC with MFG and cerebellum (Table 3; Figure 4,P<0.01). We also found that two AQ subscale scores (communication scores and attention switching scores) also significantly negatively correlated with the strength of rs-FCs in aMPFC with MFG and cerebellum (P<0.05). In the TD group, AQ total scores were significantly negatively correlated with the strength of rs-FC in aMPFC with superior temporal gyrus (STG) and MTG (Table 3; Figure 4, P <0.01). We also found that three AQ subscale scores (social skill scores, communication scores, and attention switching scores) also significantly negatively correlated with the strength of rs-FCs in aMPFC with STG and MTG (P<0.01).
There were no significant correlations between the strength of rs-FCs and each participant’s F-IQ in all the
participants, in the ASD group or in the TD group, in the multiple regression analysis (P>0.01).
Relationship with age in the multiple regression analysis
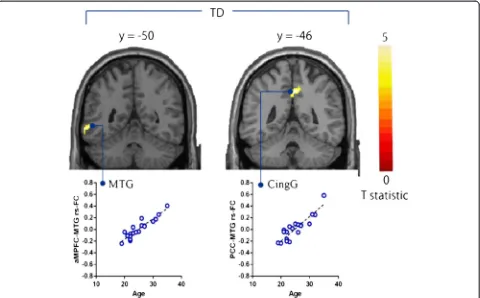
In the TD group, age was significantly positively corre-lated with the strength of rs-FCs in the aMPFC with MTG and PCC with cingulate gyrus (Table 4; Figure 5). We found no significant correlations between age and the strength of rs-FCs of DMN, in the ASD group or all the participants.
Discussion
We found that young male adults with high-functioning ASD display lower rs-FCs between two seeds (aMPFC and PCC) of DMN and other brain regions In addition, we found that autism spectrum traits measured using the AQ score are associated with the strength of rs-FCs of DMN that contain brain regions relevant to social cognition processing, in each TD participants and ASD participants, respectively. These results complement pre-vious studies [26,29,31], suggesting that the strengths of rs-FCs of DMN are associated with autistic spectrum traits of social cognition processing in ASD participants. In addition, our results showed that this association be-tween the strength of rs-FCs of DMN and autistic spectrum traits also exists not only in ASD participants but also in TD participants. These findings suggest that
Figure 1Results of rs-FCs from the aMPFC or PCC seed for each group. (A)Rs-FCs from the aMPFC seed ROI are shown for each group.
(B)Rs-FCs from the PCC seed ROI are shown for each group. The statistical threshold for both results was set atP= 0.05 with FWE correction and
k= 10 voxels for presentation purpose. The region with functional connectivities was smaller in the ASD group than in the TD group. The coordinates
the strength of rs-FCs of DMN may underlie some of the autism spectrum traits, regardless of ASD diagnosis.
Difference in functional connectivities of DMN between ASD and TD groups
Our results mostly agree with those of other studies of rs-FCs of DMN [27-32] that demonstrated lower rs-FCs of DMN in ASD. However, as for MPFC, the regions showing lower functional connectivities in previous studies are not always in agreement with those found in this study [27-30,32]. Differences in approach (seed-based or ICA) might have made direct comparisons between results somewhat challenging [51]. Andrews-Hanna et al. [49]
demonstrated that the aMPFC of DMN is associated with social cognition processes including judgments or
remembering trait adjectives about themselves compared with other people, whereas the dorsal medial prefrontal cortex (dMPFC) of DMN is associated with social cogni-tion processes including self-referential judgments about their present situation or mental states. These findings taken together with our findings suggest that rs-FCs in brain regions including both aMPFC and dMPFC are associated with autism spectrum traits associated with processes of basic social cognition of self and others in individuals with ASD.
DMN associated with autism spectrum traits
In recent studies of rs-FCs of DMN in ASD, correlations have been investigated between autism spectrum traits and functional connectivities within brain areas such as
the precuneus [27], MPFC [27,29,32], anterior cingulate cortex [27], and superior frontal gyrus [31]. However, most of these studies analyzed these correlations in only ASD participants. In general, these studies suggest nega-tive correlation between the strength of rs-FCs of DMN and autism spectrum traits in individuals with ASD.
In the current findings, the strength of rs-FCs in brain areas from aMPFC seed showed negative correlations with AQ total score not only in ASD participants but also in TD participants in the multiple regression analysis,
although these areas from aMPFC seed that showed negative correlations with AQ total scores in two groups were different from each other (Table 3). Moreover, among AQ subscale scores, communication scores and attention switching scores were related to the strength of rs-FCs of DMN in the ASD group. On the other hand, social skill scores, communication scores, and attention switching scores were related to the strength of rs-FCs of DMN in the TD group. Our findings suggest that the strength of rs-FCs of DMN might underlie the level of autism spectrum
Table 3 Brain regions showing negative correlations between AQ and the strength of rs-FCs in multiple regression analysis
Seed region Region MNI coordinates Z-score Cluster size
x y z kE(voxels)
ASD participants
aMPFC Middle frontal gyrus -46 26 46 4.28 101
Cerebellum 18 -82 -44 4.32 86
PCC None
TD participants
aMPFC Superior temporal gyrus -58 -40 4 4.12 112
Middle temporal gyrus 68 -14 -12 4.59 106
PCC None
The statistical threshold for contrasts wasP<0.001 uncorrected for height and clusterP<0.05 corrected for multiple comparisons. aMPFC, anterior medial prefrontal cortex; MNI, Montreal Neurological Institute; PCC, posterior cingulate cortex.
traits in participants without ASD diagnosis or with sub-threshold autism spectrum traits, supporting the con-tinuum view. In addition, considering the results of the multiple regression analysis using AQ subscale scores, the nature of autism spectrum traits, which affects the strength of rs-FCs of DMN in aMPFC seed, might be different in each group and the function of DMN might not always be the same between ASD and TD groups.
Age-related changes in functional connectivities of DMN
Particularly interesting from our viewpoint is the lack of consensus regarding the strength of rs-FC aspects of age
variation with ASD. In relation to age-related changes in DMN in ASD, few studies have examined age correlates of functional connectivities by rs-fMRI. To the best of our knowledge, only one rs-fMRI study has examined the functional connectivities in children with ASD com-pared with age- and IQ-matched children with TD [52]. The previous study showed higher rs-FCs of DMN in PCC seeds in children with ASD than in children with TD [52], but we found that lower rs-FCs of DMN in PCC seeds in the ASD group and a relationship between rs-FCs of DMN in PCC seeds and age in the TD group. We speculate that the age-related changes in the functional
Table 4 Brain regions showing correlations between age and the strength of rs-FCs in multiple regression analysis
Seed region Region MNI coordinates Z-score Cluster size
x y z kE(voxels)
All participants (Positive and Negative correlations)
NONE
ASD participants (Positive and Negative correlations)
NONE
TD participants (Positive correlation)
aMPFC Middle temporal gyrus -62 -50 -6 4.26 71
PCC Cingulate gyrus 2 -46 42 3.91 90
TD participants (Negative correlation)
NONE
The statistical threshold for contrasts wasP<0.001 uncorrected for height and clusterP<0.05 corrected for multiple comparisons. aMPFC, anterior medial prefrontal cortex; MNI, Montreal Neurological Institute; PCC, posterior cingulate cortex.
connectivities of DMN in ASD and TD may be linked to differences in neurodevelopmental mechanisms in child-hood and numerous variables including point of develop-ment. Future studies are required to explore the variation of rs-FCs of DMN with age for individuals with ASD.
Future directions
First, the size of each group in this study may be rela-tively too small to demonstrate a relationship between the various levels of autism spectrum traits and the strength of rs-FCs of DMN. Second, we defined the seed regions for rs-FC analyses on the basis of the location of ROIs within the DMN in accordance with a previous study. Although the seed-based analysis in the present research makes it possible to determine rs-FC precisely, this analysis did not reveal information about intrinsic-ally connected networks and their interactions [51]. Fu-ture study is necessary to replicate these findings, using the ICA approach for exploring information about in-trinsically connected networks. Third, we included global signal regression in generating the FC map. However, it is a quite controversial issue whether global signal regression
changes resting-state correlations and produces negative correlations [53]. Thus, the findings used in the present study are not definitive, and future study is necessary to compare the results with confound regression strategies. Finally, our participants were only young male adults with high-functioning ASD. Future study is needed to clarify rs-FCs in both males and females, children with ASD, and ASD individuals without high-functioning. These add-itional researches will help provide more complete pictures that may clarify the etiology of ASD.
Conclusions
Young male adults with high-functioning ASD showed lower rs-FCs of DMN compared with age- and IQ-matched young male adults with TD. Moreover, the strength of rs-FCs of DMN was associated with autism spectrum traits in each ASD and TD group, regardless of ASD diagnosis. We propose that the strength of rs-FCs of DMN might underlie the level of autism spectrum traits and might be one of the potential biomarkers for the ob-jective identification of the level of autism spectrum traits, regardless of ASD diagnosis.
Figure 5Brain regions showing positive correlations between age and the strength of rs-FCs from seed regions in TD participants.
Abbreviations
AMPFC:Anterior medial prefrontal cortex; AQ: Autism-spectrum quotient; ASD: Autism spectrum disorder; DMN: Default mode network; DMPFC: Dorsal medial prefrontal cortex; IQ: Intelligence quotient; PCC: Posterior cingulate cortex; Rs-FC: Resting-state functional connectivities; TD: Typical development.
Competing interests
The authors declare that they have no competing interests.
Authors’contributions
MJ was involved in conducting the experiment, analyzing and interpreting data, and drafting the article. HK was involved in recruiting the participants, diagnosing the participants with ASD, conducting the experiment, analyzing and interpreting data, and drafting the article. DNS, TM (fifth author), and KI were involved in recruiting the participants and conducting the experiment. MI was involved in recruiting the participants, interpreting data, and drafting the article. TM (eighth author) was involved in recruiting the participants and diagnosing the participants with ASD. MA, SA, AT, YW, NS, and HO were involved in interpreting the data. TI was involved in designing, analyzing and interpreting data, and drafting the article. All the authors have read and approved the final manuscript.
Acknowledgments
We would like to express our sincere appreciation to the participants and their families, who generously and courageously participated in this research. This research was funded in part by Grants-in-Aid for Scientific Research from the Japan Society for the Promotion of Science (21220005, 21591509, 21791120, 25293248), the Japan Research Foundation for Clinical Pharmacology, and the Takeda Science Foundation. Part of this research was the result of‘Development of biomarker candidates for social behavior’and ‘Integrated research on neuropsychiatric disorders’performed under the Strategic Research Program for Brain Sciences by the MEXT of Japan.
Author details
1Developmental Emotional Intelligence, Division of Developmental Higher Brain Functions, Department of Child Development United Graduate School of Child Development, Osaka University, Kanazawa University, Hamamatsu University School of Medicine, Chiba University and University of Fukui, Fukui, Eiheiji 910-1193, Japan.2Research Center for Child Mental
Development, University of Fukui, Fukui, Eiheiji 910-1193, Japan.3Department of Neuropsychiatry, Faculty of Medical Sciences, University of Fukui, Fukui, Eiheiji 910-1193, Japan.4Biomedical Imaging Research Center, University of Fukui, Fukui, Eiheiji 910-1193, Japan.5Department of Child and Adolescent Mental Health, National Institute of Mental Health, National Center of Neurology and Psychiatry, Kodaira, Tokyo 187-8553, Japan.6Graduate School of Engineering, Osaka University, Suita, Osaka 565-0871, Japan.7Research Center for Child Mental Development, Kanazawa University, Kanazawa, Ishikawa 920-8641, Japan.8Department of Cerebral Research, National Institute for Physiological Sciences, Okazaki, Aichi 444-8585, Japan. 9Department of Psychiatry, Graduate School of Medicine, Nagoya University, Nagoya, Aichi 466-8550, Japan.
Received: 4 February 2014 Accepted: 27 May 2014 Published: 11 June 2014
References
1. Lai M-C, Lombardo MV, Chakrabarti B, Baron-Cohen S:Subgrouping the autism“spectrum”: reflections on DSM-5.PLoS Biol2013,11:e1001544. 2. Autism and Developmental Disabilities Monitoring Network Surveillance
Year 2008 Principal Investigators; Centers for Disease Control and Prevention: Prevalence of autism spectrum disorders–Autism and Developmental Disabilities Monitoring Network, 14 Sites, United States, 2008.MMWR Surveill Summ2012,61:1–19.
3. Frith U:Autism and Asperger Syndrome.Cambridge: Cambridge University Press; 1991.
4. Baron-Cohen S:Mindblindness: An Essay on Autism and Theory of Mind.
Cambridge, MA: MIT Press; 1997.
5. Constantino JN, Hudziak JJ, Todd RD:Deficits in reciprocal social behavior in male twins: evidence for a genetically independent domain of psychopathology.J Am Acad Child Adolesc Psychiatry2003,42:458–467.
6. Skuse DH, Mandy W, Steer C, Miller LL, Goodman R, Lawrence K, Emond A, Golding J:Social communication competence and functional adaptation in a general population of children: preliminary evidence for sex-by-verbal IQ differential risk.J Am Acad Child Adolesc Psychiatry2009, 48:128–137.
7. Bölte S, Westerwald E, Holtmann M, Freitag C, Poustka F:Autistic traits and autism spectrum disorders: The clinical validity of two measures presuming a continuum of social communication skills.
J Autism Dev Disord2011,41:66–72.
8. Wheelwright S, Auyeung B, Allison C, Baron-Cohen S:Defining the broader, medium and narrow autism phenotype among parents using the Autism Spectrum Quotient (AQ).Mol Autism2010,1:10.
9. Happé F, Ronald A, Plomin R:Time to give up on a single explanation for autism.Nat Neurosci2006,9:1218–1220.
10. Baron-Cohen S, Wheelwright S, Skinner R, Martin J, Clubley E:The autism-spectrum quotient (AQ): Evidence from asperger syndrome/high-functioning autism, males and females, scientists and mathematicians.J Autism Dev Disord2001,31:5–17.
11. Woodbury-Smith MR, Robinson J, Wheelwright S, Baron-Cohen S:Screening Adults for Asperger Syndrome Using the AQ: A Preliminary Study of its Diagnostic Validity in Clinical Practice.J Autism Dev Disord2005, 35:331–335.
12. Lombardo MV, Barnes JL, Wheelwright SJ, Baron-Cohen S:Self-referential cognition and empathy in autism.PLoS One2007,2:e883.
13. Golan O, Baron-Cohen S, Hill JJ, Rutherford MD:The“reading the mind in the voice”test-revised: A study of complex emotion recognition in adults with and without autism spectrum conditions.J Autism Dev Disord
2007,37:1096–1106.
14. Komeda H, Kosaka H, Saito DN, Inohara K, Munesue T, Ishitobi M, Sato M, Okazawa H:Episodic memory retrieval for story characters in high-functioning autism.Mol Autism2013,4:20.
15. Baron-Cohen S, Wheelwright S, Hill J, Raste Y, Plumb I:The“Reading the Mind in the Eyes”Test Revised Version: A Study with Normal Adults, and Adults with Asperger Syndrome or High-functioning Autism.J Child Psychol Psychiatry2001,42:241–251.
16. Kosaka H, Omori M, Munesue T, Ishitobi M, Matsumura Y, Takahashi T, Narita K, Murata T, Saito DN, Uchiyama H:Smaller insula and inferior frontal volumes in young adults with pervasive developmental disorders.Neuroimage2010,50:1357–1363.
17. Ishitobi M, Kosaka H, Omori M, Matsumura Y, Munesue T, Mizukami K, Shimoyama T, Murata T, Sadato N, Okazawa H:Differential amygdala response to lower face in patients with autistic spectrum disorders: An fMRI study.Res Autism Spectr Disord2011,5:910–919.
18. Morita T, Kosaka H, Saito DN, Ishitobi M, Munesue T, Itakura S, Omori M, Okazawa H, Wada Y, Sadato N:Emotional responses associated with self-face processing in individuals with autism spectrum disorders: An fMRI study.Soc Neurosci2012,7:223–239.
19. Greicius MD, Krasnow B, Reiss AL, Menon V:Functional connectivity in the resting brain: a network analysis of the default mode hypothesis.Proc Natl Acad Sci U S A2003,100:253–258.
20. Raichle ME, MacLeod AM, Snyder AZ, Powers WJ, Gusnard DA, Shulman GL: A default mode of brain function.Proc Natl Acad Sci U S A2001, 98:676–682.
21. Raichle ME, Snyder AZ:A default mode of brain function: A brief history of an evolving idea.Neuroimage2007,37:1083–1090.
22. Schilbach L, Eickhoff SB, Rotarska-Jagiela A, Fink GR, Vogeley K:Minds at rest? Social cognition as the default mode of cognizing and its putative relationship to the“default system”of the brain.Conscious Cogn2008, 17:457–467.
23. Amodio DM, Frith CD:Meeting of minds: the medial frontal cortex and social cognition.Nat Rev Neurosci2006,7:268–277.
24. Gilbert SJ, Williamson IDM, Dumontheil I, Simons JS, Frith CD, Burgess PW: Distinct regions of medial rostral prefrontal cortex supporting social and nonsocial functions.Soc Cogn Affect Neurosci2007,2:217–226.
25. Buckner RL, Andrews‐Hanna JR, Schacter DL:The brain’s default network.
Ann N Y Acad Sci2008,1124:1–38.
26. Menon V:Large-scale brain networks and psychopathology: a unifying triple network model.Trends Cogn Sci2011,15:483–506.
27. Assaf M, Jagannathan K, Calhoun V:Abnormal functional connectivity of default mode sub-networks in autism spectrum disorder patients.
28. Kennedy DP, Courchesne E:Functional abnormalities of the default network during self-and other-reflection in autism.Soc Cogn Affect Neurosci2008,3:177–190.
29. Monk C, Peltier S, Wiggins J, Weng S:Abnormalities of intrinsic functional connectivity in autism spectrum disorders.Neuroimage2009,47:764–772. 30. Kennedy DP, Redcay E, Courchesne E:Failing to deactivate: resting
functional abnormalities in autism.Proc Natl Acad Sci U S A2006, 103:8275–8280.
31. Weng S, Wiggins J, Peltier S, Carrasco M:Alterations of resting state functional connectivity in the default network in adolescents with autism spectrum disorders.Brain Res2010,1313:202–214.
32. Von Dem Hagen EA H, Stoyanova RS, Baron-Cohen S, Calder AJ:Reduced functional connectivity within and between“social”resting state networks in autism spectrum conditions.Soc Cogn Affect Neurosci2013, 8:694–701.
33. Association AP:Diagnostic and Statistical Manual of Mental Disorders: DSM-IV-TR®.Arlington, VA: American Psychiatric Publishing; 2000. 34. Nygren G, Hagberg B, Billstedt E, Skoglund A, Gillberg C, Johansson M:
The Swedish version of the Diagnostic Interview for Social and Communication Disorders (DISCO-10).Psychometric properties J Autism Dev Disord2009,39:730–741.
35. Wing L, Leekam SR, Libby SJ, Gould J, Larcombe M:The Diagnostic Interview for Social and Communication Disorders: background, inter-rater reliability and clinical use.J Child Psychol Psychiatry2002,43:307–325.
36. Oldfield RC:The assessment and analysis of handedness: The Edinburgh inventory.Neuropsychologia1971,9:97–113.
37. Wechsler D:WAIS-III: Wechsler Adult Intelligence Scale.San Antonio, TX: Psychological Corporation; 1997.
38. Chao-Gan Y, Yu-Feng Z:DPARSF: A MATLAB Toolbox for“Pipeline”Data Analysis of Resting-State fMRI.Front Syst Neurosci2010,4:1–7.
39. Biswal B, Zerrin Yetkin F, Haughton VM, Hyde JS:Functional connectivity in the motor cortex of resting human brain using echo-planar mri.Magn Reson Med1995,34:537–541.
40. Lowe MJ, Mock BJ, Sorenson JA:Functional Connectivity in Single and Multislice Echoplanar Imaging Using Resting-State Fluctuations.
Neuroimage1998,7:119–132.
41. Fox MD, Snyder AZ, Vincent JL, Corbetta M, Van Essen DC, Raichle ME:The human brain is intrinsically organized into dynamic, anticorrelated functional networks.Proc Natl Acad Sci U S A2005,102:9673–9678. 42. Satterthwaite TD, Elliott MA, Gerraty RT, Ruparel K, Loughead J, Calkins ME,
Eickhoff SB, Hakonarson H, Gur RC, Gur RE, Wolf DH:An improved framework for confound regression and filtering for control of motion artifact in the preprocessing of resting-state functional connectivity data.
Neuroimage2013,64:240–256.
43. Van Dijk KR A, Sabuncu MR, Buckner RL:The influence of head motion on intrinsic functional connectivity MRI.Neuroimage2012,59:431–438. 44. Müller R, Shih P, Keehn B:Underconnected, but how? A survey of
functional connectivity MRI studies in autism spectrum disorders.
Cereb Cortex2011,21:2233–2243.
45. Power JD, Barnes KA, Snyder AZ, Schlaggar BL, Petersen SE:Spurious but systematic correlations in functional connectivity MRI networks arise from subject motion.Neuroimage2012,59:2142–2154.
46. Satterthwaite TD, Wolf DH, Loughead J, Ruparel K, Elliott MA, Hakonarson H, Gur RC, Gur RE:Impact of in-scanner head motion on multiple measures of functional connectivity: relevance for studies of neurodevelopment in youth.Neuroimage2012,60:623–632.
47. Deen B, Pelphrey K:Perspective: Brain scans need a rethink.Nature2012, 491:S20.
48. Buckner RL, Sepulcre J, Talukdar T, Krienen FM, Liu H, Hedden T, Andrews-Hanna JR, Sperling RA, Johnson KA:Cortical hubs revealed by intrinsic functional connectivity: mapping, assessment of stability, and relation to Alzheimer’s disease.J Neurosci2009,29:1860–1873.
49. Andrews-Hanna JR, Reidler JS, Sepulcre J, Poulin R, Buckner RL: Functional-anatomic fractionation of the brain’s default network.Neuron2010, 65:550–562.
50. Hagmann P, Cammoun L, Gigandet X, Meuli R, Honey CJ, Wedeen VJ, Sporns O:Mapping the structural core of human cerebral cortex.PLoS Biol2008,6:e159.
51. Joel SE, Caffo BS, van Zijl PCM, Pekar JJ:On the relationship between seed-based and ICA-based measures of functional connectivity.Magn Reson Med2011,66:644–657.
52. Lynch CJ, Uddin LQ, Supekar K, Khouzam A, Phillips J, Menon V:Default mode network in childhood autism: posteromedial cortex heterogeneity and relationship with social deficits.Biol Psychiatry2013,74:212–219. 53. Murphy K, Birn RM, Handwerker DA, Jones TB, Bandettini PA:The impact of
global signal regression on resting state correlations: Are anti-correlated networks introduced?Neuroimage2009,44:893–905.
doi:10.1186/2040-2392-5-35
Cite this article as:Junget al.:Default mode network in young male adults with autism spectrum disorder: relationship with autism spectrum traits.Molecular Autism20145:35.
Submit your next manuscript to BioMed Central and take full advantage of:
• Convenient online submission
• Thorough peer review
• No space constraints or color figure charges
• Immediate publication on acceptance
• Inclusion in PubMed, CAS, Scopus and Google Scholar
• Research which is freely available for redistribution