Effects of transient aerodynamics on vehicle stability: A
Large Eddy Simulation analysis
S. Y. Cheng1 and M. Tsubokura2
Hokkaido University, Sapporo, Hokkaido 060-8628, Japan
T. Nakashima3
Hiroshima University, Higashi-Hiroshima, Hiroshima 739-8527, Japan
and
Y. Okada4 and T. Nouzawa5
Mazda Motor Corporation, Aki-gun, Hiroshima 730-8670, Japan
The present study investigated the extent to which the results obtained from simple bluff body model, regarding pitching stability, can be applied to real vehicle aerodynamics. The investigation was carried out using a large eddy simulation method with vehicle-motion-airflow dynamic coupling capability. The aerodynamic damping coefficient and mechanism obtained from realistic sedan-type vehicle model cases are found similar to the one for simple body model cases. These agreements deduce that the use of simple body model in automotive aerodynamic research is justifiable.
I.
Introduction
N principle, the aerodynamics of vehicle comprises the drag, lift, and side force coefficients, in conjunction with the rolling, yawing, and pitching moment coefficients. In real-world situation, the aerodynamic forces and moments which act on a vehicle are of transient nature. However, development of vehicle aerodynamics to date has mainly been focused on steady-state components, particularly the drag coefficient, Cd. This coefficient can only be
used to evaluate performances related to fuel efficiency and top speed; it gives no indication in regard to the vehicle’s performance in terms of stability.
To consider the stability factors under the effect of transient aerodynamics, several assessment methods have been proposed in the literature. These methods rely on either drive test (e.g. Howell and Le Good [1]; Okada et al [2]) or wind tunnel measurement (e.g. Aschwanden et al [3]). The former can only be performed after a development mule is produced, while the latter requires a complex test rig to manipulate the vehicle motion for a dynamic assessment. In addition, due to limited numbers of probe that can be attached to the test vehicle without altering the flow around it, drive test and wind tunnel measurement provide very limited flow information about the test. The lack of flow information could impede detailed flow analysis which is needed for identifying the underlying mechanism.
1
Ph.D. Student, Division of Mechanical and Space Engineering, Graduate School of Engineering, Hokkaido University, Kita-13, Nishi-8, Kita-ku, Sapproro, 060-8628, Japan.
2
Associate Professor, Division of Mechanical and Space Engineering, Graduate School of Engineering, Hokkaido University, Kita-13, Nishi-8, Kita-ku, Sapproro, 060-8628, Japan. Member AIAA; [email protected] (Corresponding Author)
3
Assistant professor, Department of Social and Environmental Engineering, Graduate School of Engineering, Hiroshima University, 1-4-1 Higashi-Hiroshima, Hiroshima, 739857, Japan, member. Member AIAA.
4
General Manager, Vehicle Testing & Research Department, Mazda Motor Corporation, Aki Gun, Hiroshima 7308670, Japan.
5
Staff Manager, Engineering Systems Department, IT Solution Division, Mazda Motor Corporation, Aki Gun,
To overcome these limitations, we have developed a numerical method for dynamic coupling simulation of flow and vehicle motion in the earlier part of the work. In addition, a non-dimensional coefficient, termed "aerodynamic damping coefficient CAD", has been introduced. The coefficient quantifies the amount of aerodynamic damping exerted on the vehicle to resist its dynamic motion. Hence, it allows quantitative evaluation of vehicle's aerodynamic stability under a transient driving condition [4]. Moreover, by employing two idealized-sedan models of simple-bluff-body shape, the underlying mechanism that dictates the aerodynamic stability of sedan-type vehicle has been identified [5]. The use of simple body in place of a production vehicle is common (e.g. Ahmed and Baumert [6]; Ahmed [7]; Le Good and Garry [8]) in vehicle aerodynamic research. This is because a production vehicle comprises many body parts with complex geometry, and hence, the flow structures generated by those body parts are overly complicated for a specific investigation. Thus, the used of simple body models allows us to achieve the conclusive results with relative ease. However, the question remains as to whether the results obtained from such simple body can be transferred to real vehicle aerodynamics.
Therefore, the main aim of this part of the work is to verify the extent to which the results obtained previously from the simple body models can be applied to real vehicle aerodynamics, in particular, the aerodynamic damping mechanism. The answer to this question is important because it sheds light on whether the further investigations on this particular subject can employ a simple body model for uniformity and simplicity without compromising the validity of the investigation results. To achieve this, we created two vehicle models with basic sedan shape and employed the similar method to quantify the aerodynamic damping coefficient for the two models. The results obtained from the basic sedan models were then compared to the one obtained from simple body models for verification of the latter.
II.
Basic Sedan models
Similar to the cases of simple body models [4][5], the opposite A- and C-pillar geometrical configurations were adopted by the basic sedan models so that they conform to the characteristic aerodynamic features of the simple body models. In particular, the model intended for higher pitching stability adopted the rounded A-pillar and angular C-pillar configurations, while the other model adopted the opposite configurations (see Fig. 1).
The models are at full scale, and have the same height h, width w, and length l measurements of 4.7, 2.0, and 1.6 m, respectively. To focus on the influence of upper body shape on aerodynamics, we simplified the model geometry by adopting a flat underbody configuration. The slant angles of A- and C-pillars are 30° and 25°, respectively. For convenient in the discussions, the model adopted the characteristic geometry of lower-aerodynamic-pitching-stability sedan is designated “model Aʹ”, while the other model is termed “model Bʹ”, hereafter.
III.
Numerical Methods
A. Computational Code
We performed the LES computation by using an in-house CFD code “FrontFlow/red-Aero”, which was originally developed under the project “Frontier Simulation Software for Industrial Science”, and optimized for vehicle aerodynamics simulation by Tsubokura et al [9] under the projects “Revolutionary Simulation Software (RSS21)”. The code has been validated successfully in the previous works by Tsubokura et al [10] by comparing the numerical results with wind tunnel measurements. For instance, good agreement is obtained in the pressure distribution along the centerline of ASMO model, and flow field around a full-scale production car with complicated engine room and under body geometry. For the details of the validation, readers are referred to Tsubokura et al [10].
B. Governing equations
The governing equations being solved in the LES are spatially filtered continuity and Navier-Stokes equations: 0 ui xi (1)
2 p S ij SGSui u u
i j
t xj xi xj
(2)
/ 3/ u ui j u ui j
p
P
(3)where ui, p, ρ, and ν are the i-th velocity component, pressure, density, and kinematic viscosity of the fluid. The
over-bar indicates the spatially filtered quantity. The strain rate tensor Sij are defined as 1
2
uj u i S ij
xi xj
(4)
The standard Smagorinsky model [11] is used to model the subgrid-scale (SGS) eddy viscosity νSGS in Eq. (2):
s
ij ijSGS
C
f
2
S
S
2
(5)where ∆ is the width of the spatial filter which is determined by the volume of numerical element. The model coefficient Cs of 0.15 is used. As for the dumping of the effect of νSGS in the vicinity of solid boundary, Van Driest
dumping function fd is used:
25 /
1
yd
e
f
(6)where y+ is the wall distance. C. Discretization
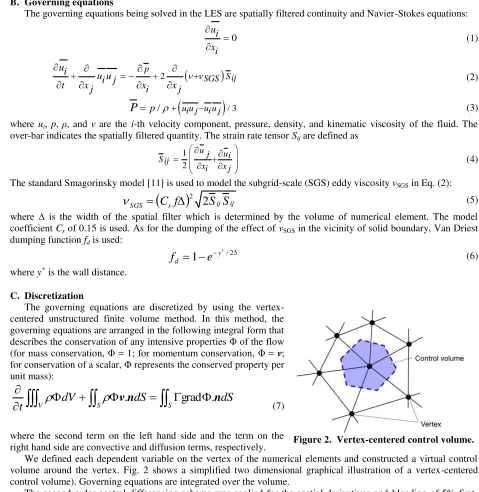
The governing equations are discretized by using the vertex-centered unstructured finite volume method. In this method, the governing equations are arranged in the following integral form that describes the conservation of any intensive properties Φ of the flow (for mass conservation, Φ = 1; for momentum conservation, Φ = ν; for conservation of a scalar, Φ represents the conserved property per unit mass):
S SV
dV
dS
dS
t
ν
.
n
grad
.
n
(7)where the second term on the left hand side and the term on the right hand side are convective and diffusion terms, respectively.
We defined each dependent variable on the vertex of the numerical elements and constructed a virtual control volume around the vertex. Fig. 2 shows a simplified two dimensional graphical illustration of a vertex-centered control volume). Governing equations are integrated over the volume.
The second-order central differencing scheme was applied for the spatial derivatives and blending of 5% first-order upwind scheme for the convection term was exploited for numerical stability. For time advancement, Euler implicit scheme was used. The pressure-velocity coupling was preserved by using SMAC (Simplified Marker and Cell) algorithm.
D. Computational domain and boundary conditions
The shape of the computational domain resembles a rectangular duct, which covered 5l upstream of the vehicle model, 13l downstream, 4.0w on both sides, and a height of 7.2h. It encompasses 12 million elements with 3 million nodes. In addition, finer elements are used nearby the vehicle models to capture more details of the flow information around the vehicles (see Fig. 3). Nine layers of prism mesh are generated from the surface of the vehicle models with the first layer’s thickness of 1 mm. The typical wall distance of the first nearest grid point is less than 150 in the wall unit (y+), so it is well within the logarithmic layer of the mean velocity profile.
At the inlet boundary, the approach flow was set to be a constant, uniform velocity of 39 m/s. We lowered the flow Reynolds number Re by one order of magnitude to 1.2086 × 10⁶, so that the y+ < 150 criterion is achieved. This is done by increasing the dynamic viscosity of air by one order of magnitude. At the outflow boundary, zero gradient condition was imposed. The ground surface was divided into two regions. The first region which was 5.0l from the inlet was defined as free-slip wall boundary. This setting is to simulate the suction floor effect which prevents formation of boundary layer. The remaining ground surface was treated by wall-model with the assumption of fully developed turbulent boundary layer. For
the vehicle models’ surface, a log-law distribution of instantaneous velocity was imposed. Finally, the ceiling and lateral boundaries of the domain were treated as free-slip wall boundary.
E. Periodic pitching oscillation setting
To probe the dynamic response of the models, we conducted dynamic simulation in which the models were forced to oscillate in a sinusoidal fashion about a lateral axis. Motion of the models is accomplished by Arbitrary Lagrangian-Eulerian (ALE) technique [12]. The pitching axis is located at the front-wheel axle. Hence, the models rotated in a manner that simulates the rear-ride height (RRH) fluctuation of the real vehicles. This corresponds to the fact that the sedan-type vehicles were mainly suffered from RRH fluctuation during road test (Okada et al, 2009).
The pitch angle θ is defined as θ = θ0 - θ1 cos(2πft). By setting θ0 and θ1 equal to 0.9, the vehicle models were
forced to oscillate between 0° to 1.8°. The frequency f is 1 Hz, which is equivalent to Strouhal number St of 0.13. This value is chosen considering the road test St of 0.15 [2]. Phase-averaged results presented in this paper are averaged of 15 cycles after the LES computation achieved a stable periodic condition. Fig. 4 shows the convention of aerodynamic pitching moment. Due to very high computing resources required in the LES that involve ALE algorithm, high-performance computing technique presented by Tsubokura et al [9] is employed.
IV.
Results and Discussion
A. Comparison of aerodynamic damping coefficients
Fig. 5 shows the curve of phase-averaged pitching moment <M>p and its fitting function for the basic sedan
models. The difference in fluctuation range between the curves of the two basic sedan models is not as large as the one obtained from the simple body models by Cheng et al [4], which may due to the smaller pitching amplitude in the former cases. However, the trends obtained from the two model types are similar, i.e. <M>p reaches the
minimum peak during tail-up motion and the maximum peak during tail-down motion. Table 1 summarizes the overall CAD for the two models. Similar to the simple body models cases, the model with rounded A-pillar and angular C-pillar (i.e. model B
ʹ
) exhibits a higher CAD, by about 21%. This trend is in agreement with our expectation as model Bʹ
is created based on the characteristic geometry of sedan with higher pitching stability.Figure 4. Sign convention of aerodynamic pitching moment.
Figure 3. Numerical grid of basic sedan model: (a) Computational domain; (b) prism mesh layers; (c) Grid resolution underneath the model.
Table 1. CAD for model Aʹ and Bʹ.
Model
C
ADB. Aerodynamic damping mechanism
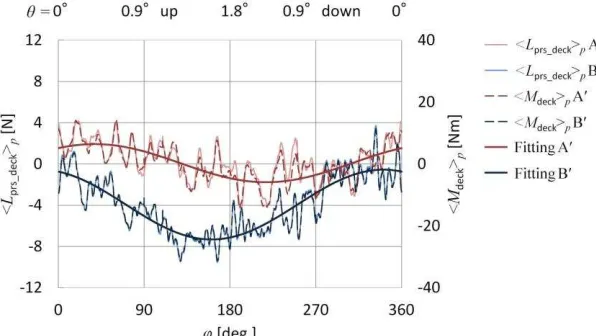
Fig. 6 shows the curves of phase-averaged trunk deck pressure lift <Lprs_deck>p, pitching moment <Mdeck>p, and
the corresponding fitting function obtained from the basic sedan models. Cheng et al [5] reports that for the simple-body-model cases, the trend of the <Lprs_deck>p curves was dictated by these three factors:
i. The strength of C-pillar vortex which induces the relatively low static pressure region at the sides of trunk deck.
ii. The interaction between the A- and C-pillar vortices in model A, which has greatly influenced the static pressure in the central region of trunk deck, particularly at the maximum pitch angle and during 2° downward pitching cycle.
iii. The formation of the circulatory structure in the central region of flow field above the trunk deck of model B during the 2° tail-down pitching cycle, which had resulted in the drop in static pressure in the central region of trunk deck.
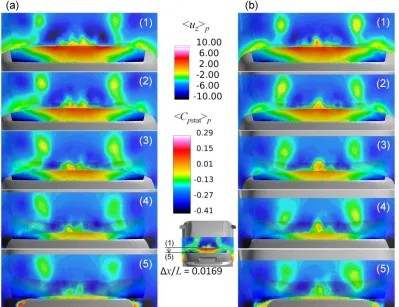
To verify whether the same mechanism holds in the realistic vehicle flow cases, similar visualization approach is applied so that the results obtained from the two model types can be compared directly. Fig. 7 depicts the distribution of phase-averaged trunk deck surface static pressure for model A
ʹ
and model Bʹ
. First, the basic sedan
models have also exhibited the
low pressure regions at the sides
of their trunk deck (marked “i” in
Fig. 7), which is caused by the
C-pillar vortex. Similar to the
tendency observed in the simple
body model cases [5] the size of
these
low
pressure
region
decreases with pitch angle due to
the attenuation of the strength of
C-pillar vortex.
Second, the static pressure in the
central region of the trunk deck of model Aʹ
is also affected by the interaction between the A- andC-pillar vortices, which may be evident by the decrease in the static pressure at the maximum pitch angle (mark ‘ii’
in
Fig. 7). Fig. 8 shows the relatively strong upwash circulatory structure at the central region of trunk deck at maximum pitch angle (depicted by phase-averaged vertical velocity component <uz>p).Third, model B
ʹ
has also exhibited the drop in static pressure in the central region of its trunk deck during the tail-down pitching cycle (mark ‘iii’in
Fig. 7). Fig. 9 depicts that the pressure drop is caused by the relatively strong upwash circulatory structure formed during the tail-down pitching cycle. The similar tendency portrayed in the results of basic sedan models and simple body models implies that the aerodynamic damping mechanism obtained from simple bluff bodies can be generalized in real vehicle aerodynamics.Figure 5. Phase-averaged M and fitted functions.
Figure 7. Transient effect of pitching on front and rear pillar vortices in model B.
V. Concluding Remarks
The present study investigated the generalizability of results obtained from simple bluff body models to real vehicle aerodynamics. The basic sedan model with rounded A-pillar and angular C-pillar has shown higher aerodynamic damping. This tendency agrees with the results obtained from simple body models. In addition, the aerodynamic damping mechanism observed in the basic sedan model cases are found similar to the one for simple body model cases. Hence, the results of present study justify the use of simple body model in automotive aerodynamic research.
Acknowledgments
This work was supported by the 2007 Industrial Technology Research Grant program from the New Energy and Industrial Technology Development Organization (NEDO) of Japan. Development of the base software FFR was supported by the FSIS and “Revolutionary Simulation Software (RSS21)” projects sponsored by MEXT, Japan. The first author’s Ph.D. program is sponsored by Ministry of Higher Education and Universiti Teknikal Malaysia Melaka, Malaysia.
References
Periodicals1
Howell, J., and Le Good, G., 1999. The influence of aerodynamic lift on high speed stability. SAE Paper No 1999-01-0651.
2
Okada, Y., Nouzawa, T., Nakamura, T., Okamoto, S., 2009. Flow structure above the trunk deck of sedan-type vehicles and their influence on high-speed vehicle stability 1st report: On-Road and Wind-Tunnel Studies on Unsteady Flow Characteristics that Stabilize Vehicle Behavior. SAE Paper No. 2009-01-0004.
3
Aschwanden, P., Müller, J., Knörnschild, U., 2006. Experimental study on the influence of model motion on the aerodynamic performance of a race car. SAE Paper 2006-01-0803.
4
Cheng, S.Y., Tsubokura, M., Nakashima, T., Nouzawa, T., Okada, Y., 2012. Numerical quantification of aerodynamic damping on pitching of vehicle-inspired bluff body. Journal of Fluids and Structures. 30, 188-204.
5
Cheng, S.Y., Tsubokura, M., Nakashima, T., Nouzawa, T., Okada, Y., 2011. A numerical analysis of transient flow past road vehicles subjected to pitching oscillation. Journal of Wind Engineering and Industrial Aerodynamics. 99, 511-522.
6
Ahmed, S.R. and Baumert, W., 1979. The structure of wake flow behind road vehicles. Proc. ASME-CSME Conf. Aerodynamics of Transportation, Niagara Falls, 93-103.
7
Ahmed, S.R., 1981. An experimental study of the wake structures of typical automobile shapes. J. Wind Eng. Ind. Aerodyn. 9 (1-2), 49-62.
8
Le Good, G. and Garry, K., 2004. On the Use of Reference Models in Automotive Aerodynamics. SAE Technical Paper 2004-01-1308.
9
Tsubokura, M., Nakashima, T., Kitoh, K., Sasaki, Y., Oshima, N. and Kobayashi, T., 2009a. Development of an Unsteady Aerodynamic Simulator Using Large-Eddy Simulation Based on High-Performance Computing Technique. SAE, Paper 2009-01-0007.
10
Tsubokura, M., Kobayashi, T., Nakashima, T., Nouzawa, T., Nakamura, T., Zhang, H., Onishi, K., and Oshima, N., 2009b. Computational visualization of unsteady flow around vehicles using high performance computing. Computers & Fluids. 38, 981-990.
11
Smagorinsky, J., 1963. General circulation experiments with primitive equations. Monthly Weather Rex. 91(3), 99-164.
12