UNIVERSITI TEKNIKAL MALAYSIA MELAKA
Tool For Mapping Manufacturing Critical-path Time in Job Shop
Environment
This report submitted in accordance with requirement of the Universiti Teknikal
Malaysia Melaka (UTeM) for the Bachelor Degree of Manufacturing Engineering
(Manufacturing Management) (Hons.)
by
HOW WHEE CHING
B051010004
900328-08-6746
FACULTY OF MANUFACTURING ENGINEERING
Tool For Mapping Manufacturing Critical-path Time in Job
Shop Environment
HOW WHEE CHING
B051010004
UNIVERSITI TEKNIKAL MALAYSIA MELAKA
BORANG PENGESAHAN STATUS LAPORAN PROJEK SARJANA MUDA
TAJUK: Tool For Mapping Manufacturing Critical- path Time in Job Shop Environment
SESI PENGAJIAN: 2013/14 Semester 2 Saya How Whee Ching
mengaku membenarkan Laporan PSM ini disimpan di Perpustakaan Universiti Teknikal Malaysia Melaka (UTeM) dengan syarat-syarat kegunaan seperti berikut: 1. Laporan PSM adalah hak milik Universiti Teknikal Malaysia Melaka dan penulis. 2. Perpustakaan Universiti Teknikal Malaysia Melaka dibenarkan membuat salinan
untuk tujuan pengajian sahaja dengan izin penulis.
3. Perpustakaan dibenarkan membuat salinan laporan PSM ini sebagai bahan pertukaran antara institusi pengajian tinggi.
Pada zaman ini, kebanyakan syarikat pengeluaran mengamalkan paradigma pengeluaran
yang baru iaitu amalan pengubahsuaian untuk memenuhi permintaan
pelanggan-pelanggan. Dengan ini, syarikat dapat bersaing dengan pasaran yang kompetitif. Walau
bagaimanapun, amalan pengubahsuaian memerlukan fleksibiliti yang tinggi untuk
menghantar barang kepada pelanggan dengan masa yang tepat. Konsep Lean juga
dikenalkan sebagai Sistem Pengeluaran Toyota merupakan konsep yang amat sesuai
dalam sistem pengeluaran yang banyak jenis tetapi jumlah pengeluaran yang rendah.
Permintaan rekaan khas semakin meningkat, aplikasi konsep Lean akan menjadi
semakin kurang efektif. Konsep Lean menganggap aliran pengeluaran lancar dan
pengekalan tahap inventori yang rendah sebagai satu cabaran yang besar dalam bidang
pengeluaran rekaan khas. Dengan itu, kajian ini ingin membentangkan Quick Response
Manufacturing (QRM) sebagai strategi alternative untuk bidang pengeluaran rekaan khas.
Konsep QRM merupakan satu strategi yang boleh diaplikasikan di seluruh syarikat dan
ia mempunyai aspek utama untuk mengurangkan masa. Projek ini akan dijalankan di
sebuah syarikat pembuatan komponen. Kebelakangan ini, syarikat ini menghadapi
masalah penghantaran lewat. Satu alatan yang baru akan dicipta untuk mempaparkan
Manufacturing Critical-path time (MCT) mengikut keadaan semasa syarikat ini. Alatan
ini akan menjadikan sebagai masa petunjuk bagi produk utama yang dipilih. Kaedah
yang sesuai akan dicadangkan berdasarkan konsep QRM dan maya sell konsep bagi
meningkatkan prestasi penghantaran barang. Kaedah yang baru ini akan dikajikan oleh
simulasi model. Model ini dibinakan daripada perisian Simulasi WITNESS. Walaupun
dicipta berdasarkan kes-kes syarikat tetapi dengan mudahnya ditukar untuk pelaksanaan
dalam industri yang serupa. Pada masa depan, semua order yang diterima boleh
diagihkan berdasarkan jumlah permintaan dan persamaan prosess. Ia diikuti oleh
pembentukan maya sell. POLCA sistem mengaplikasi di dalam semua maya sell.
Semasa konsep QRM dilaksanakan di seluruh syarikat, ia dipercayai bahawa jumlah
MCT boleh dikurangkan dengan ketara. Dalam kesimpulannya, masalah masa
Many companies are adopting a new production paradigm of mass customization to meet their customers’ future demands and survive in an intensely competitive market. However, mass customization manufacturing requires a high degree of flexibility to deliver customers’ orders on time. Lean Manufacturing as exemplified by the Toyota Production System is appropriate when production is characterized by a low mix and
high volume environment. As the degree of product customization increases, the
application of lean principles to ensure smooth production flow while keeping inventory
level low becomes a major challenge. This study presents Quick Response
Manufacturing (QRM) as an alternative strategy for a high mix and low volume
production environment. QRM is a company-wide strategy with the key aspect of
reduction in lead time. The case company, where the study is conducted is a components
manufacturing company with a job shop production system. The company, making
highly engineered products with variable demands, is confronted with the main
challenge of consistently long lead times leading to poor-on time delivery performance
to their customers. To mitigate this problem, a tool for mapping the manufacturing
critical-path time (MCT) will be developed according to the current situation of the case
company. The output of this tool is a lead time and visual indicator for the
manufacturing critical-path time of a selected major product family. An appropriate
methods based on QRM principles and virtual cell concept will be proposed to improve
the MCT for the selected product. This proposed method is tested by a simulation model
which built by using simulation software, WITNESS. The MCT tool and the proposed
implementation in other similar industries. In future, all the received jobs may be
grouped together according to the same demand volume and similarity in process then
formed virtual cell respectively. QRM principle such as POLCA system is applied into
all the virtual cell. As QRM concept is slowly implemented in the entire chain, it is
believed that total MCT can be reduced tremendously. As a result, the long lead time
I would also like to dedicate this report to my supervisor who gave the right advice and
guide to me during the period of project development. On behalf of that, I may also
The special thanks to my supervisor, Associate Professor Dr. Chong Kuan Eng. The
supervision, advice and support that he gave truly help the progression of my final year
project. I also wish to express my sincere appreciation to the company that I attached in.
The co-operation is much indeed appreciated. Great appreciation to the contribution of
my faculty, Faculty of Manufacturing in helping us completes this project by providing
the project guidelines.
TABLE OF CONTENT
2.3.1 Background of Time-Based Competition 9
2.3.2 Principles of TBC 10
2.3.3 Time-Based Competition and Quick Response Manufacturing 11
2.4 Quick Response Manufacturing 13
2.4.2 QRM Principles 19
2.4.3 Lean Manufacturing and QRM 24
2.4.4 Manufacturing Critical-Path Time (MCT) 31
2.4.5 QRM cell 36
2.4.6 POLCA 37
2.5 Virtual Cell 41
2.6 Case Study on QRM Implementation 42
2.6.1 Bosch Hinge in Doethinchem 42
2.6.2 Olsen Engineering in Eldridge 42
2.6.3 Rockwell Automation in Wisconsin 43
2.6.4 HUFCOR in Wisconsin 44
2.7 Article on the applicability of QRM 44
2.8 Summary 47
3.1.8 MCT Improvement from QRM concept 54
3.1.9 Implementation of proposed method 54
3.1.10 Documentation 54
CHAPTER4: DEVELOPMENT MCT TOOL AND SIMULATION MODEL 55
4.1 Current Operation in the Case Company 55
4.2 Phase 1: Identifying FTMS 56
4.3 Phase 2: Developing MCT Tool 57
4.3.1 Data Input Interface 58
4.3.2 Analyzing Input Data 64
4.3.3 Summary for User Guidelines 71
4.4 Phase 3: Developing Virtual Cell & POLCA System 73
4.5 Phase 4 :Simulation Model 81
CHAPTER 5: RESULT AND DISCUSSION 85
5.1 Phase 1: FTMS Analysis 85
5.2 Phase 2: MCT Tools Results 86
5.3 Phase 3: Virtual Cell and POLCA System 92
5.4 Phase 4: Implementation Virtual Cell and POLCA in Simulation Model 98
5.5 Summary 102
CHAPTER 5: CONCLUSION 104
6.1 Conclusions 104
6.2 Limitations 105
6.3 Recommendations 105
REFERENCES 107
BIBLIOGRAPHY 113
LIST OF TABLES
2. 1 The Comparison Between Traditional Beliefs And Qrm Principles 19
2. 2 The Difference Between Lean And Qrm Approach (Suri, 2011) 28
2. 3 Summary Of Article On Applicability Of Qrm 46
4. 1 Type Of Process And Number Of Machines 56
4. 2 Summary Of Button Description 72
4. 3 Steps To Determine Polca Loops, Quantum Size And Number Of Polca Cards 74
4. 4 Steps On How Polca System Works In The Case Company 77
4. 5 Steps Of Translating Data Into Simulation Modeling 81
5. 1 Polca Paired Loop, Number Of Polca Cards And Polca Cards For Product
“Shaft” 94
5. 2 Data Used For Simulation Base Model 99
5. 3 Steps Of Validation For Base Model 100
LIST OF FIGURES
1. 1 Overview Process Flow Of The Case Company 3
1. 2 Overview Layout Of The Case Company 3
2. 1 The Causes And Effects Of Speed (Verweir And Berghe, 2004, P65). 10
2. 2 Enterprise Waste Due To Long Lead Time (Suri, 2011) 16
2. 3 Qrm Approach Is Different From Traditional Cost-Based Focus (Suri, 2011) 18
2. 4 Key Production Characteristic Continuum (Matthew, 2004) 25
2. 5 Qrm Strategy Enhances Lean Programs 28
4. 3 The First Part Of The Spreadsheet Model Which Named As Worksheet "Data" 58
4. 4 Formula "If” Used To Calculate Mct 59
4. 5 Processing Time Is Copied From "Calculation" Column By Using "If", “And”
& “Or” Function. 60
4. 6 Formula"If" And "Or" Are Used To Copy Pre-Processing Time 61
4. 7 Formula"If","Or" &"Not" Are Used To Copy The Post-Processing Time 61
4. 8 Nested If Function Is Used To Calculate The Numbers Of Days For Inventory 62
4. 9 If Function Is Used To Count The Quantity Of A Job Order. 63
4. 11 Macro And Vba Coding Of “Calculate Mct” 64
4. 12 The Second Part Of The Spreadsheet Model Which Named As Worksheet
“Analyse Data" 65
4. 13 Data Is Categorized Into Sum Of Pre-Processing Time, Sum Of Processing Time
And Sum Of Post-Processing Time. 65
4. 14 Macro With Some Vba Of “Pivot Table”. 66
4. 15 Average Mct Per Job 66
4. 16 Macro And Vba Coding Of “Average Mct Per Job” 67
4. 17 Vba Coding Of “Calculate Numbers Of Days For Inventory”. 67
4. 18 Average Processing Time Per Job Of Assembly Process (Asb) In “Analyse
Data” Worksheet 68
4. 19 Data Being Copied From “Analyse Data” Worksheet To “Form” Worksheet. 68
4. 20 Macro And Vba Coding Of “Add Detail Into Form” 69
5. 3 Mct Is Calculated By Clicking The Button “CalculateMct” 88
5. 4 The First Part Result Displayed In The “Analysed Data” 88
5. 5 The Second Part Result Displayed In The “Analysed Data” 88
5. 6 Value Of Mct Total And Mct Response Are Generated By Clicking Button
“Create Map” 89
5. 7 The End Result “MCTTotal” 90
5. 9 Machines Were Logically Group Together And Formed A Virtual Cell 93
5. 10 Simulation Base Model 99
LIST OF ABBREVIATIONS
TOC - Theory of Constraint
FMS – Flexible Manufacturing System
TQM - Total Quality Management
MCT - Manufacturing Critical-path Time
TBC - Time-Based Competition
POLCA - Paired-cell Overlapping Loops of Cards with Authorization
JIT - Just-in-Time
VSM - Value Stream Mapping
TPM - Total Productive Maintenance
HT - Heat Treatment (Outsourced)
FTMS - Focus Market Target Segment
VBA - Visual Basic Application
PL - Planner
QC - Quality Control
In the 21st century, globalization is a driver of the economy for every nation. In
recognition of the importance of globalization, the manufacturing sector have made
some changes in order to adapt to recent market demands. Today’s manufacturers
compete on speed to market and varieties of products. To achieve these objectives
companies rely on new technologies and new methodologies to gain the competitive
advantages.
1.1 Background of Study
In this new era of globalization, a good strategy is very important to compete with other
competitors. In nutshell, a good strategic planning always lead a step ahead from others.
There are various kind of strategies available for continuous improvement in the
manufacturing field. Just for an example, lean manufacturing is one of commonly
employed philosophy in industries. The main idea of Lean is to eliminate non-value
added activities. However, not all manufacturing system are compatible with the
approaches of lean. Beside lean, there are other strategies which also has established in
this field. Some of them are Quick Response Manufacturing (QRM), Theory of
Constraint (TOC), Flexible Manufacturing System (FMS), and Total Quality
Management (TQM).
INTRODUCTION
In brief, QRM is a concept which reduce time simultaneously across enterprise and it is
best applied in the high mix and low volume environment. For the TOC concept, it is an
organizational change method that is focus on profit improvement. On the other hand,
TPM is a management philosophy aimed at continuous improvement in the quality of
products and process while FMS is a manufacturing system for producing goods that is
readily adaptable to changes.
1.2 Background of Company
This project is conducted in a case company which produces precision tools, die, moulds,
puncher, cavity, cores, jigs, fixtures and other products in a job shop environment. The
processes involved in the case company include CNC milling, turning, grinding, profile
grinding, wire cutting, electric discharge machining, welding, laser marking and tapping.
This case company produces an average of 160 product families. Due to different
process routes and process time for each of the product, coupled with low volume of
demand from customers, the production of this case company is categorized as high mix
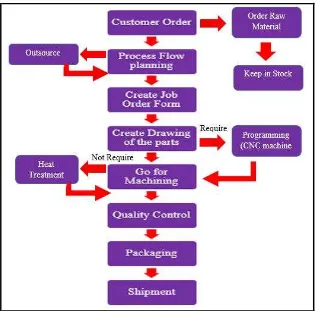
and low volume. The process flow of this case company is shown in Figure 1.1.
Normally, once orders are received from customer, this case company will takes one to
two days to do planning for the process flow. Then, the planner will create job order
form for each of the order. Part’s drawing will be created then will first send to
programming if there involve CNC machining operation. Next, jobs will be release to
production and start to process. After completing all the process, part is sent for
inspection then packaging before shipping to customers. Figure 1.2 shows the overview
Figure 1. 1: Overview Process Flow of the Case Company
Figure 1. 2: Overview Layout of the Case Company
Turning Squaring Milling
CNC Turning
CNC Milling
EDM Grinding
Profile Grinding
CNC Grinding
Wire Cutting
1.3 Problem Statement
According to the general manager of this company, the company is facing around 30
percent of late deliveries. This is due to long pre and post process queuing time during
production. As a consequence, it contributes a long lead time for an order. Through this
project, the general manager would like to reduce the waiting time for production.
Furthermore, it is believed that reducing the waiting time will reduce the manufacturing
critical-path time.
1.4 Objectives
The aim of this project is to reduce the manufacturing critical-path time (MCT) for
processes in the case company.
This project embarks with the following objectives:
i. To develop a tool to map the MCT for the selected products.
ii. To propose a QRM method to reduce the MCT for the selected products
iii. To develop a simulation model for testing of the proposed method
1.5 Scope
The scope of this study is limited to the major product families determined by the
volume of sales. The data for the selected products for the demands and cycle times are
based on historical data collected from company. The proposed method will be only
implemented in shop floor and does not include activities in office operations and the
1.6 Benefits to the company
At the end of this project, a MCT Tool to map the critical-path times will be developed.
This MCT tool helps to identify the time taken for non-productive activities of the
selected product families. It acts as an indicator for the case company to identify the
areas in the production line that requires improvements. This tool not only benefits to
solve the current late deliveries issues but also useful for mapping MCT in the future.
Besides, a suitable method based on QRM principles will be proposed to reduce the
non-productive activities such as waiting time of the case company which strongly
emphasized by the general manager. As a consequence, development of MCT tools and
proposal of QRM principle will result in a reduction of late deliveries for the case
company. This will subsequently increase the degree of customers’ satisfaction and also
reduced the cost of the products.
1.7 Organization of the Report
This report is organized as follow. Chapter 1gives description of the background of this
study, problem statement, objectives, scope and benefit to the company. Chapter 2
provides the literature review of the related subject. Following the outline of the problem
in Chapter 1, Chapter 3 describes the design of methodology employed for this project.
Chapter 4 discusses about the development of MCT Tool and simulation model. Result
and discussion will discussed in chapter 5. In chapter 6, it will discuss the conclusion of
This chapter provides an overview of production system characteristics, lean
manufacturing, time-based competition (TBC), QRM concepts, MCT, and
paired-cell overlapping loops of cards with authorization (POLCA). This chapter acts as the
guideline in the methodology design and the information summarized here are the
evidence to support the methodology in the next chapter.
2.1 Production System Characteristics
Specific manufacturer can be identified through the four key major production system
characteristics which are mix, volume, demand variability and degree of customization
(Matthew, 2004).
Mix defines as the different number of product that are produce. What makes the “different” between products? Well, the difference is between the number of parts, functionality and appearance in the end product. Indeed with the same appearance but
travel with the different process route, different process time and unique set up could
still contribute significantly to the factory mix (Matthew, 2004). Product mix refers to
the total number of product line offers to its customers (Suttle, 2009).