Procedia Environmental Sciences 33 ( 2016 ) 94 – 107
1878-0296 © 2016 The Authors. Published by Elsevier B.V. This is an open access article under the CC BY-NC-ND license (http://creativecommons.org/licenses/by-nc-nd/4.0/).
Peer-review under responsibility of the organizing committee of LISAT-FSEM2015 doi: 10.1016/j.proenv.2016.03.061
ScienceDirect
The 2
ndInternational Symposium on LAPAN-IPB Satellite for Food Security and Environmental
Monitoring 2015, LISAT-FSEM 2015
Remote sensing and land suitability analysis to establish local
specific inputs for paddy fields in Subang, West Java
Widiatmaka
a,*, Wiwin Ambarwulan
b, Paulus B.K. Santoso
c, Supiandi Sabiham
a,
Machfud
d, Muhammad Hikmat
eaDepartment of Soil Science and Land Resources, Bogor Agricultural University, Bogor 16680, Indonesia bGeospatial Information Agency, Indonesia
CCenter for Data and Information, Ministry of Agriculture, Indonesia dFaculty of Agricultural Technology, Bogor Agricultural University, Indonesia
eSoil Research Institute, Ministry of Agriculture, Indonesia
Abstract
Indonesia requires a considerable increase in rice production in the future to keep pace with rapid population growth. Increased production can be done through the specific location-based inputs provision. This study aimed to map land resources in Subang Regency, West Java Province, at a scale of 1:25,000, to evaluate land suitability on any land mapping units and to recommend local specific inputs for paddy fields. The methodology used included land mapping unit delineation, delineation of existing paddy fields using SPOT-6 imagery, soil sampling and laboratory analysis, and land suitability evaluation for the paddy fields. The results showed that in Subang Regency, most paddy fields still allow for intensification through the provision of inputs that are location specific. In the case of the Subang Regency, the local specific inputs include provision of organic matter, provision of lime, provision of N, P and K fertilizer, and construction of irrigation infrastructure. Using the Geographic Information System, the location where the input is necessary can be given in detail. Moreover, beyond the existing paddy field, there are still areas where actual land use is not paddy field but are identified as having potential for the development of paddy fields. As in the case of existing paddy fields, such areas require local specific inputs according to land characteristics that differ from one place to another and can be spatially delineated.
© 2016 The Authors. Published by Elsevier B.V.
Peer-review under responsibility of the organizing committee of LISAT-FSEM2015.
Keywords: temporal automated land evaluation system; land characteristic; land use and land cover; SPOT-6 imagery
* Corresponding author. Tel.: +62-813-1406-5828. E-mail address: [email protected].
© 2016 The Authors. Published by Elsevier B.V. This is an open access article under the CC BY-NC-ND license (http://creativecommons.org/licenses/by-nc-nd/4.0/).
1. Background
Land and soil have different characteristics from one place to another because in soil, there is a diversity of physical, chemical and biological processes that work spatio-temporally and with varying intensity [1, 2, 3]. With such diverse land characteristics, land utilization for the cultivation of a commodity requires specific input in accordance with its land characteristics. A uniform input provision for diverse land characteristics may cause input shortages in some places, but may cause an excess of input in other places [3, 4]. Inputs that do not match with land characteristics will not be effective and may even become a waste, both in terms of capital input and land resources [5]. In future land resources management, the provision of local specific input needs to be carried out. This local specific input of course is a function of many aspects including land, topography, climate and infrastructure. In fact, crop yield is a complex outcome of many factors including soil, climate and environment [6, 7], and so the input needs to be specified accordingly.
Although soil and land resources characteristics vary from one place to another, the land characteristics can be grouped into more uniform units [8, 9, 10]. In soil mapping, this uniform unit is called the land mapping unit (LMU). Using this concept, land can be said to belong to a unit or to be uniform at a particular map scale. Of course, the uniformity in mapping at a scale of 1:100,000 for example, is different from the uniformity on a map scale of 1:5,000. This uniformity can be used as a basis for the provision of local specific inputs. An input given on a land mapping unit may be different from those given to other land mapping units with different characteristics. In the context of soil and land, land mapping and land resources can be said to be indispensable for agriculture, environment and decision-makers [11]. Research has shown that land characteristics affect soil management behavior [12].
In Indonesia, local specific input has not been widely implemented. Some implementation has been carried out by estate plantation [13] as well as paddy cultivation [14, 15]. In developed countries, provision of local specific inputs in the cultivation has been carried out through precision agriculture [16]. Precision agriculture has good prospects in developing countries [17], but in the case of Indonesia, it appears that the application of this concept is still a struggle, considering the social and economic factors as well as lack of farmers’ knowledge. At the farm scale and especially in the cultivation of food crops, local specific implementation is still difficult. There are many factors that influence the adoption of local specific and site-specific technology, including economic aspects [18, 19]. In the case of Indonesia, the difficulty is partly because of the scale of land tenure, which is still very small [14, 20]. As an illustration, the ownership of the average paddy farmer is 0.3 ha [21]. In addition, economic ability and knowledge of farmers are still low, and so it does not allow the application of technology [14]. In such conditions, the input given by the farmers to cultivated land is usually very dependent on economic capabilities and the advice given by the governmental agricultural workers. Therefore, knowledge of agricultural workers and planners in the government for the factors influencing the provision of local specific input is important. In this context, establishing land units in an agricultural area needs to be done. Unfortunately, land mapping in Indonesia has not been thoroughly detailed [22, 23]. However in several areas, the map is already available and so, even when the provision of local specific input cannot be done in detail as in the case of precision agriculture, the land characteristics-based input should be begun. The provision of local specific input on a regency level for example, would be very helpful in the efforts to increase production.
Land resources mapping and land evaluation is one tool that can be used to provide the data for establishing local specific inputs in the context of sustainable agricultural planning [24, 25]. Through soil surveys, a land inventory can be carried out and furthermore, through the process of land evaluation, local specific fertilization advice in accordance with land characteristics can be given.
Since the introduction of the land evaluation concept by the Food and Agriculture Organization [26] and the land capability concept by the US Department of Agriculture [27], the concept of land evaluation has been growing rapidly. Starting with the methods that emphasize the land characteristics and land quality [8, 26], the method was then developed by taking into consideration other aspects including social and economic factors. Examples of this method development can be given through an approach of weighting, for example by using multi-criteria analysis [28, 29].
whereas Java covers only 7% of the land area of Indonesia [33]. Efforts to expand the paddy field area outside Java is continuing, but it is constrained by the limited budget. Inevitably, the current paddy field productivity needs to be improved. Increasing production can be done through many efforts, such as the introduction of the cultivation of high-yield varieties, combating pests and plant diseases, and improving irrigation efficiency. Increasing land productivity can also be achieved by local specific provisions in line with land resources characteristics. In that context, the data of land resources, including the results of the soil survey, can be used for planning production increases.
Increasing production is urgent for Indonesia, given that the level of rice consumption is still high, at 113 kg capita-1 year-capita-1 [33], which is likely to require time to reduce [3capita-1]. The challenge of increasing land productivity is not only faced by Indonesia, but also worldwide, as the challenge is how to produce sufficient food for more than 9 billion people by 2050 with land that is increasingly limited. In other, such efforts to increase productivity should remain natural resources sustainable [34, 35, 36, 37].
Within this background, the objective of this research is to present the interpretation of soil maps with their LMUs and land evaluation for planning of increasing rice production through LMU’s specific input on existing paddy fields, as well as on the area potentially used for paddy fields.
2. Materials and Methods
2.1. Research area
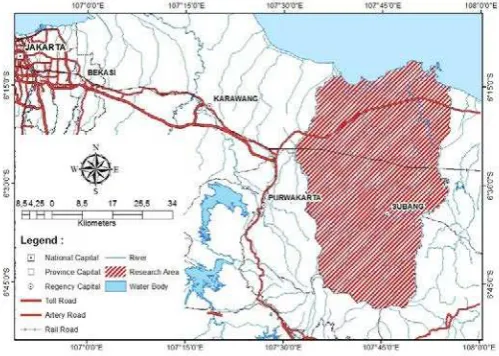
This study was carried out in the Subang Regency, West Java Province. The regency is geographically located between 107°31'–107°54' East and 6°11'–6°49' South (Fig. 1). The regency has an area of 205,176.9 ha, or 6.4% of the area of West Java Province. The study area is situated at an altitude ranging from 0 to 1500 m above sea level (a.s.l.). Topographically, the area covers three topographic zones [38]. The mountainous zone is located in the south part, has an altitude of 500 to 1500 m a.s.l., and covers 20% of the total area. The hilly zones with a height 50 to 500 m a.s.l. are situated in the middle part of the regency, and cover 35% of the total area. The flat zone, with an altitude of 0-50 m a.s.l., covers 45% of the regency, and is located in the north part; it is situated on the north coast of Java Island and extends to the south part. In the northern part of this region, rice cultivation is mostly done. Topographically, 80% of the study area has a slope of 0-17°, while 10.64% of the area has slopes of 18-45o, and the rest (8.56%) has a slope of more than 45o. Based on the Geological Map of the Subang [39, 40, 41], geological formations in this region include the formation of volcanic rocks from the Pleistocene age in the south part of the region, and the formation of sediments of Neogene and Pleistocene age in the middle part, while the northern part is composed of alluvium formations. The area has a tropical climate, where the average rainfall in 2005 was 2,352 mm/year with the number of rainy days being 100 [38]. Such a climate, supported by the fertile soil, makes most of the area favourable for agriculture.
2.2. Establishing the land mapping units
The initial LMU was already available, which is the LMU from a soil map at 1:100,000 [42]. Slope class was derived using the standard Indonesian topographic map at a scale of 1:25,000 produced by Geospatial Information Agency, using the Spatial Analyst module in ArcGIS 10.2 software of the Environmental Systems Research Inc. This slope class was then used for detailing the initial LMU. The result of this process is the soil map at a scale of 1:25,000 with its LMU.
2.3. Soil sampling and laboratory analysis
A composite soil sampling was performed on each LMU, taken at a depth of 0-30 cm. Laboratory analysis was performed at the Laboratory of the Dept. of Soil Science and Land Resources, Bogor Agricultural University. In total, 92 soil samples were taken and analysed in the laboratory. The analysis performed was texture (three fractions), pH (H2O and KCl), Organic Carbon, Total Nitrogen, P2O5, K2O, exchangeable Cations (Ca, Mg, K, Na), Cation Exchange Capacity and Base Saturation.
2.4. Land use and land cover analysis
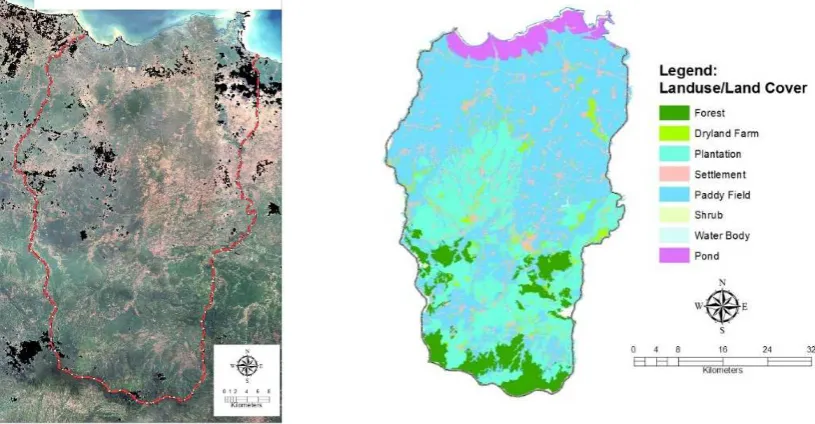
Land use and land cover was delineated using SPOT-6 imagery of 2nd October 2014. A supervised classification was done using ERDAS Imagine software. Field checks were carried out in July 2015. Land use and land cover classification used Indonesian official standard [43]. There are 9 classes of land use/land cover in the study area, however in this paper, special attention is given for paddy field land utilization.
2.5. Land suitability analysis
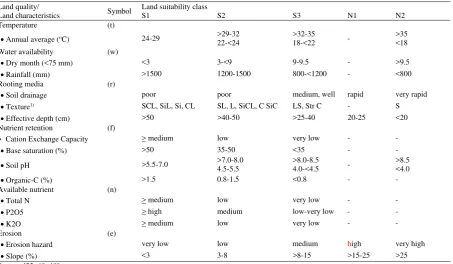
Analysis of land suitability for paddy field was carried out as follows: (i) in the paddy field area delineated by land use and land cover analysis; this analysis was intended to establish the specific input necessary to increase paddy production; and (ii) in the non-paddy field area, this analysis is to examine the possibility of paddy field extension. Land evaluation analysis used the maximum limitation method [26, 44, 45]. Analysis was done using the Automated Land Evaluation System (ALES), according to the method previously described [29, 46, 47]. The criteria used were obtained from the literature [22, 48, 49] and are presented in Table 1. According to this system, the suitability was classified into five classes: S1 (highly suitable), S2 (suitable), S3 (marginally suitable), N1 (currently not suitable) and N2 (permanently not suitable). The software used was ALES ver. 4.65e, ArcGIS 10.2, and Microsoft Office. After using ALES for land evaluation, the results were transferred to the ArcGIS for geographical reference to describe the results in the form of maps and tabulation [47, 50].
2.6. Land status analysis
Table 1. Criteria used for land suitability evaluation for paddy fields in Subang
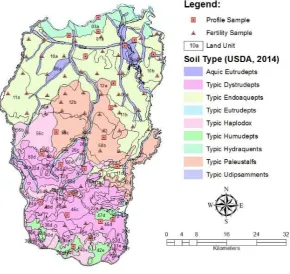
Results of the soil and land resources mapping at a scale of 1:25,000 showed that the Subang Regency is divided into 78 LMU. LMU were compiled based on the LMU components that include the soil class (in the sub-group categories according to the USDA soil classification) [53], parent material, slope and landform. Fig. 2 presents the spatial distribution of soil, where map colour is based solely on soil class, while the descriptions of land units are not presented in this paper for clarity reason. A summary of soil class in the category of soil order [53] on land units is presented in Table 2.
Table 2. Main soil order in the LMU
No Soil Land Mapping Unit Area
ha %
1 Aquic Eutrudepts 05a, 06a 14.171,4 6,5
2 Typic Dystrudepts 22a, 22c, 22d, 22e, 24d, 24e, 26a, 26b, 26c, 26d, 36d, 36e, 38b, 38c, 38d, 38e, 38f, 46a, 46c, 46d, 46e, 49c, 49d, 49e,
8 Typic Paleustalfs 12a, 12b, 12c, 12d, 12e, 58a, 58b, 58c, 58d 36.994,2 17,1
9 Typic Udipsamments 04a 1.295,2 0,6
Fig. 2. Soil map, land mapping units and soil sampling in the Subang Regency
In the category of soil order [53], there are four soil orders in Subang, namely Inceptisols, Alfisols, Oxisols and Entisols. The soil order of Inceptisols occupies the largest area, covering 150,142.2 ha or 69.4% of the region. Another soil order that is also quite widespread is Alfisols, which covers 36,994 ha or 17.1% of the area. This dominance of Inceptisols and Alfisols is related to the soil development and local climate [12]. Inceptisols is soil that is relatively young, but has started to develop [53]. In the field, Inceptisols in Subang is generally characterized by the presence of the cambic horizon [53]. Because of its undeveloped phase, generally this soil is relatively fertile. Alfisols in Subang generally has clay accumulation in the subsurface horizon, i.e. the so-called argillic horizon [53], which has a high base saturation of more than 35%. The clay accumulation in this horizon comes from the horizon above, which is washed down with water movement [53]. Oxisols occupies an area of 19,783 ha or 9.1%. Oxisols in Subang is old soil, and the easily weathered minerals are low. Its clay content is actually relatively high, but the clay is inactive and so the cation exchange capacity is low (<16 me/100 g clay) [53]. This soil contains a lot of iron oxide or aluminium oxide. In the field, the soil horizon shows diffuse boundaries with each other. Entisols occupies an area of 9,538 ha, or 4.4%. Entisols is a very young soil that is at the beginning of soil development, and is even younger than Inceptisols. In this soil, no horizon identifiers were shown, except ochric, albic or histic epidedons [53]. Field observations and analyses of soil for Entisols in Subang indicate that the epipedons found were ochric or albic.
Fig. 3. (a) SPOT-6 imagery acquired on 2nd October 2014; (b) Land use and land cover map of the Subang Regency
Table 3. Land use and land cover of the Subang Regency
No Land use/land cover Area
ha %
1 Forest 18,619.6 8.6
2 Fields/”Tegalan” 6,953.6 3.2
3 Estate/Plantations 51,891.8 24.0
4 Settlements 16,229.4 7.5
5 Paddy fields 112,428.3 51.9
6 Shrubs 64.0 0.0
7 River/lake/reservoir/”situ” 779.5 0.4
8 Ponds 8,927.9 4.1
9 Unclassified 563.6 0.3
Total 216,457.7 100.0
The results showed that land use and land cover in the Subang Regency consists of seven kinds of land use/land cover, i.e. forest, dry land farms, plantation, paddy field, shrub, pond and water body. In terms of the area coverage, paddy fields and plantations made up the most extensive land use, with 51.9% and 24% of the area, respectively.
According to imagery analysis, the area of paddy fields in the Subang Regency is 112,428 ha. Meanwhile, the statistical data [38] showed that the extent of paddy fields in the Subang Regency is 84,928 ha, which consists of irrigated paddy fields (76,434 ha) and rain-fed paddy fields (8,494 ha). Thus, there is a very significant difference between the image interpretation and statistical data, the difference is 27,500 ha. The difference is likely due to differences in the measurement accuracy and methods, which has also been found in previous studies [54]. Remote-sensing techniques are very useful for the detection of paddy fields. However, the level of accuracy of this analysis is, on average, 89.4%. With increasing steep slopes, paddy field deviation detection will be higher [54, 55]. In this study, the agreement of image interpretation results with statistical data only amounted to 75.5%, which is very low when compared with previous studies that reached >95% [54]. Regardless of the level of accuracy, the next discussion in this paper will use the data from the imagery analysis.
it to be used for cultivation and agriculture, including paddy fields. In this paper, the paddy fields that were analysed were those lying in the AOU.
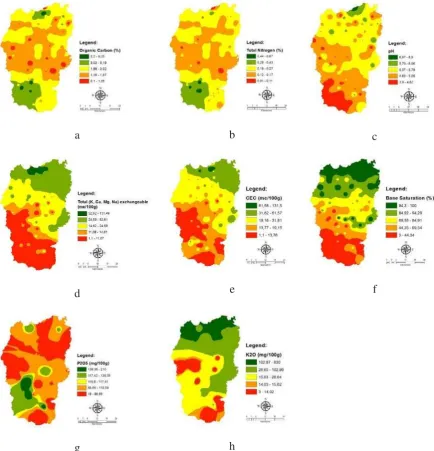
A summary of the results of laboratory analysis is presented in [56], they are presented spatially in Fig. 4 according to geostatistical distribution [57, 58]. Based on the results of the laboratory analysis, the actual land suitability in existing paddy fields is presented in Fig. 5a, while the covering areas of various suitability classes are presented in Table 4. The results show that the area with land suitability of S1 (highly suitable) for paddy fields covers 82.3 ha, or only 0.1% of the existing paddy fields. The area with actual land suitability for paddy fields of S2 (suitable) is the majority, and accounts for 96,906.5 ha or 86.3% of the existing paddy field area. The limiting factors that led to S2 land suitability include land quality of rooting media (r), nutrients available (f), nutrient retention (n) and water availability (w), either individually or in combination. The limiting factor of rooting media (r) consists of several land characteristics as limiting factors, i.e. soil drainage, effective depth and soil texture. In the case of the Subang Regency, the major limiting factor is soil texture, while soil drainage and effective depth were not serious limiting factors. In most of Subang, the majority of the soil consists of Inceptisol and Alfisol, which generally have sufficient depth. Conversely, the soil texture in some soil samples indicates the range of soil texture from loam, sandy clay loam to sandy loam. Such rough soil texture could become a barrier to the efficiency of water availability for paddy fields. The land quality of nutrient availability (f) which became a limiting factor consists of several land characteristics, i.e.
soil cation exchange capacity (CEC), base saturation, soil pH and organic-C (%). Of these four land characteristics, there are only three that become a major barrier: CEC, base saturation and soil pH.
There are only a few soils in Subang where the organic-C becomes a limiting factor for paddy fields. The value of CEC of the soil samples taken ranged from very low to high when they are classified based on the assessment criteria of soil chemical properties [22]. The lowest value of CEC of the samples was 1.10 me/100 g (very low), while the highest value was 131.5 me/100 g (very high). The value of organic-C of the samples ranged from 0.1% (very low) to 9.25% (very high). Limiting factors of nutrient retention (n) include land characteristics of total-N, P2O5 and K2O. These three land characteristics may become limiting factors for soil in Subang. Nevertheless, it can be stated that the nitrogen is a major limiting factor. The value of P2O5 of the samples ranged from 0 to 210 ppm (very high). The value of total-N ranged from 0.07% (very low) to 0.67% (high). The value of K2O of soil in Subang ranged from 0 to 630 mg/100 g (very high). The land quality water availability (w) consists of the land characteristics of precipitation and the number of dry months. However, the land characteristic that arises as a limiting factor in Subang is rainfall, while the number of dry months is not a limiting factor. The climate in Subang is relatively wet. When classifying the number of dry (<75 mm rain) months [22], there are 2-3 dry months and so this is not a limiting factor. Conversely, rainfall can become a limiting factor, especially in the northern part of the region, which has rainfall of between 800 and 1200 mm.
a
b
c
d
e
f
g
h
Fig. 4. Map of: (a) Soil Organic Carbon, (b) Total Nitrogen; (c) pH; (d) Exchangeable (K, Ca, Mg, Na); (e) CEC; (f) Base Saturation; (g) P2O5;
and (h) K2O
specific location inputs in paddy fields. Because the provision of inputs is based on the land characteristics that become limiting factors on any LMU, it can be called a LMU-based specific input. With the improvement, actual land suitability classes can be upgraded into the potential land suitability class. Actual and potential land suitability maps on existing paddy fields in the Subang Regency are presented in Fig. 5a and 5b.
Fig. 5. Map of: (a) actual land suitability, and (b) potential land suitability, for paddy fields in the existing paddy field area of the Subang Regency. Limiting factor code [22]: w = water availability, r = rooting media, f = available nutrients, n = nutrients retention, s = slope
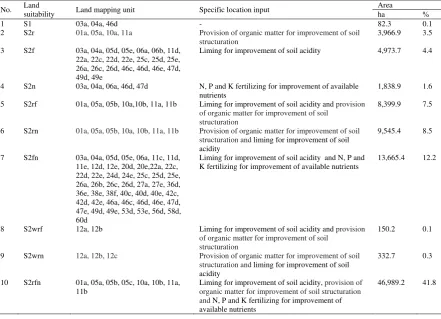
Table 4. Land suitability for paddy fields in existing paddy fields and specific location inputs necessary
No. Land suitability Land mapping unit Specific location input Area
ha %
1 S1 03a, 04a, 46d - 82.3 0.1
2 S2r 01a, 05a, 10a, 11a Provision of organic matter for improvement of soil structuration
Liming for improvement of soil acidity 4,973.7 4.4
4 S2n 03a, 04a, 06a, 46d, 47d N, P and K fertilizing for improvement of available nutrients
1,838.9 1.6
5 S2rf 01a, 05a, 05b, 10a,10b, 11a, 11b Liming for improvement of soil acidity and provision of organic matter for improvement of soil
structuration
8,399.9 7.5
6 S2rn 01a, 05a, 05b, 10a, 10b, 11a, 11b Provision of organic matter for improvement of soil structuration and liming for improvement of soil acidity
Liming for improvement of soil acidity and N, P and K fertilizing for improvement of available nutrients
13,665.4 12.2
8 S2wrf 12a, 12b Liming for improvement of soil acidity and provision of organic matter for improvement of soil
structuration
150.2 0.1
9 S2wrn 12a, 12b, 12c Provision of organic matter for improvement of soil structuration and liming for improvement of soil acidity
332.7 0.3
10 S2rfn 01a, 05a, 05b, 05c, 10a, 10b, 11a, 11b
Liming for improvement of soil acidity, provision of organic matter for improvement of soil structuration andN, P and K fertilizing for improvement of available nutrients
No. Land
suitability Land mapping unit Specific location input
Area
ha % 11 S2wrfn 12a, 12b, 12c Liming for improvement of soil acidity, provision of
organic matter for improvement of soil structuration andN, P and K fertilizing for improvement of available nutrients
7,044.2 6.3
12 S3r 49c, 56a, 56b, 56c, 58a, 58b, 58c, 60a, 60c
Provision of organic matter for improvement of soil structuration
11,353.5 10.1
13 S3f 01a, 05a, 10a, 11a, 24d, 25c, 25d, 36d, 36e, 38c, 38e, 40c, 40d, 40e, 42c, 42d, 42e, 46c, 46d, 46e, 49d
Liming for improvement of soil acidity 2,317.4 2.1
14 S3n 01a, 05a, 05b, 05c, 05d, 11a, 11c, 11d, 26c, 26d, 40c, 40d, 40e, 42c, 42e, 46c, 46d, 46e, 47d, 47e, 58d
N, P and K fertilizing for improvement of available nutrients
791.8 0.7
15 S3rf 56b, 56c Liming for improvement of soil acidity and provision of organic matter for improvement of soil
structuration
28.7 0.0
16 S3rn 56b, 56c, 58a, 58c Provision of organic matter for improvement of soil structuration and liming for improvement of soil acidity
688.7 0.6
17 S3fn 05b, 26c, 26d, 40c, 40e, 42c, 42e, 46c, 47e
Liming for improvement of soil acidity and N, P and K fertilizing for improvement of available nutrients
152.9 0.1
18 S3fs 46d Liming for improvement of soil acidity, bunds and
terraces in rain-fed paddy fields
39.4 0.0
19 S3sn 36d N, P and K fertilizing for improvement of available
nutrients and bunds and terraces in rain-fed paddy fields
27.9 0.0
20 S3rfn 56b, 58c Liming for improvement of soil acidity, provision of organic matter for improvement of soil structuration andN, P and K fertilizing for improvement of available nutrients
39.3 0.0
Total 112,428.3 100.0
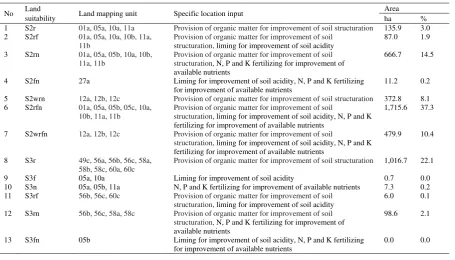
Table 5. Land suitability for paddy fields in non-paddy field area in the Subang Regency
No Land
suitability Land mapping unit Specific location input
Area
ha % 1 S2r 01a, 05a, 10a, 11a Provision of organic matter for improvement of soil structuration 135.9 3.0 2 S2rf 01a, 05a, 10a, 10b, 11a,
11b
Provision of organic matter for improvement of soil structuration, liming for improvement of soil acidity
87.0 1.9
3 S2rn 01a, 05a, 05b, 10a, 10b, 11a, 11b
Provision of organic matter for improvement of soil structuration, N, P and K fertilizing for improvement of available nutrients
666.7 14.5
4 S2fn 27a Liming for improvement of soil acidity, N, P and K fertilizing for improvement of available nutrients
11.2 0.2
5 S2wrn 12a, 12b, 12c Provision of organic matter for improvement of soil structuration 372.8 8.1 6 S2rfn 01a, 05a, 05b, 05c, 10a,
10b, 11a, 11b
Provision of organic matter for improvement of soil
structuration, liming for improvement of soil acidity, N, P and K fertilizing for improvement of available nutrients
1,715.6 37.3
7 S2wrfn 12a, 12b, 12c Provision of organic matter for improvement of soil
structuration, liming for improvement of soil acidity, N, P and K fertilizing for improvement of available nutrients
479.9 10.4
8 S3r 49c, 56a, 56b, 56c, 58a, 58b, 58c, 60a, 60c
Provision of organic matter for improvement of soil structuration 1,016.7 22.1
9 S3f 05a, 10a Liming for improvement of soil acidity 0.7 0.0
10 S3n 05a, 05b, 11a N, P and K fertilizing for improvement of available nutrients 7.3 0.2 11 S3rf 56b, 56c, 60c Provision of organic matter for improvement of soil
structuration, liming for improvement of soil acidity
6.0 0.1
12 S3rn 56b, 56c, 58a, 58c Provision of organic matter for improvement of soil structuration, N, P and K fertilizing for improvement of available nutrients
98.6 2.1
13 S3fn 05b Liming for improvement of soil acidity, N, P and K fertilizing for improvement of available nutrients
No Land
suitability Land mapping unit Specific location input
Area
ha % 14 S3rfn 56b Provision of organic matter for improvement of soil
structuration, liming for improvement of soil acidity, N, P and K fertilizing for improvement of available nutrients
6.8 0.1
Total 4,605.3 100.00
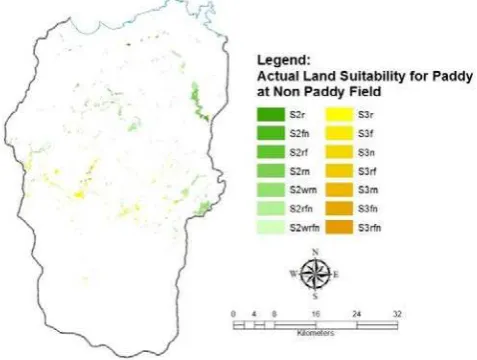
This analysis can be continued to see the potential of land where paddy fields can be constructed. Land suitability analysis results in a non-paddy fields area that are considered potential shows that the main limiting factors include rooting media (r), nutrient retention (f), available nutrients (n) and water availability (w). The treatment assumed for increasing the actual land suitability to potential land suitability includes organic matter and N, P, and K fertilizer. This input is intended to improve nutrient retention and available nutrients. In addition to the increase in potential based on the existing limiting factors, one improvement in non-paddy fields, of course, is the construction of irrigation channels (Fig. 6).
Fig. 6. Map of actual land suitability for paddy fields in the non-paddy field area in Subang
The subject presented above is principally the utilization of a land resources map with a uniform land unit. Such map can further detailed with local specific provision. The dose for each treatment is not presented in this paper, as it will need more detailed research. Further studies should be done to obtain appropriate provisions according to specific land characteristics. General suggested provisions have been given [59], which has been developed as guidelines. The guidelines are still based on administrative zoning, and so it became a more general overview. It will be very helpful if, in the future, such guidelines could be made taking into consideration the land characteristics.
4. Conclusion
The analysis done in this paper shows that the soil and land resources data, integrated with the remotely sensed data and land evaluation, can be interpreted as planning for local specific inputs based on land characteristics in the context of increasing rice production.
In Subang Regency, most paddy fields still allow for intensification through the provision of inputs that are local specific. The provision of local specific inputs was done to overcome limiting factors that can be identified through the land suitability analysis. In the case of Subang Regency, the local specific inputs include provision of organic matter, provision of liming, provision of N, P and K fertilizer, and construction of irrigation infrastructure. Using the GIS, the location where the input is necessary can be given in detail.
of paddy fields. As in the case of existing paddy fields, such areas also require local specific inputs that differ from one place to another and can be spatially delineated. This information, which is accompanied by spatial information, can be used as a reference for detailed planning of increasing rice production. This research should be followed by more detailed planning, including the precise doses for paddy fields.
Acknowledgements
We thank the Indonesian Agricultural Research and Development of the Ministry of Agriculture who financed the research through the program of National Agricultural Collaboration Research with Universities (KKP3N) during the fiscal year of 2015.
References
1. Jenny, H., Factors of Soil Formation - A System of Quantitative Pedology, 1941. McGraw- Hill, New York: p. 281.
2. Goovaerts, P., Geostatistical tools for characterizing the spatial variability of microbiological and physico-chemical soil properties, Biol. Fertil. Soils, 1998;27:315–334.
3. Tripathi, R., A.K. Nayak, M. Shahid, B. Lal, P. Gautam, R. Raja, S. Mohanty, A. Kumar, B.B. Panda and R.N. Sahoo, Delineation of soil management zones for a rice cultivated area in eastern India using fuzzy clustering, Catena, 2015;133:128–136.
4. Ferguson, R.B., G.W. Hergert, J.S. Schepers, C.A. Gotway, J.E. Cahoon and T.A. Peterson, Site specific nitrogen management of irrigated maize: yield and soil residual nitrate effects, Soil Sci. Soc. Am. J., 2002;66:544-553.
5. Food and Agriculture Organization (FAO), The state of the world’s land and water resources for food and agriculture (SOLAW) - Managing systems at risk, 2011. FAO, Rome and Earthscan, London.
6. Guo, W., S.J. Maas and K.F. Bronson, Relationship between cotton yield and soil electrical conductivity, topography, and Landsat imagery, Precision Agriculture, 2012;13:678-692.
7. Kumhálová, J. and V. Moudrý, Topographical characteristics for precision agriculture in conditions of the Czech Republic, Applied Geography, 2014;50:90-98
8. Food and Agriculture Organization (FAO), Guidelines: Land evaluation for irrigated agriculture, FAO Soils Bulletin 1985;55
9. Rossiter, D.G., Lecture Notes: “Land Evaluation”: Part 1: Basic concepts & procedures of land evaluation, 1994. Cornell University College of Agriculture & Life Sciences, Department of Soil, Crop, & Atmospheric Sciences.
10. Grunwald, S., Soil Mapping. 2015 [cited 2015 November 14]; Available from:
http://soils.ifas.ufl.edu/faculty/grunwald/teaching/esoilscience/soilmaps.shtml.
11. Li, Z., T. Huffman, A. Zhang, F. Zhou and B. McConkey, Spatially locating soil classes within complex soil polygons - Mapping soil capability for agriculture in Saskatchewan Canada, Agriculture, Ecosystems and Environment, 2012;152:59 - 67.
12. Tan, K.H., Environmental Soil Science, CRC Press; 2009.
13. Purnamayani, R. and N. Asni, Fertilization Technology for Rubber with Local Specific Location, 2013. Balai Pengkajian Teknologi Pertanian (BPTP) Jambi (In Indonesian)
14. Zaini, Z., F. Kasim, U. G. Kartasasmita and L. Hakim, Evaluation of the effectiveness of the distribution of food crops and the rate of technology adoption based on demographic and geographic factors, 2010. Final Report of the Policy Analysis Research Group, Research and Development Center for Food Crops, Bogor (in Indonesian).
15. Sukarman, D. Setyorini and S. Ritung, The Methodology for accelerate mapping of nutrient status in paddy field Mapping, 2012. Proceedings of the National Seminar on Fertilization Technology and Restoration of Degraded Lands (in Indonesian).
16. Lee, W.S. and R. Ehsani, Sensing systems for precision agriculture in Florida, Computers and Electronics in Agriculture, 2015;112:2-9. 17. Mondal, P. and M. Basu, Adoption of precision agriculture technologies in India and in some developing countries: Scope, present status and
strategies,Progress in Natural Science, 2009;19:659–666.
18. Gandonou, J.M., C.R. Dillon, M. Kanakasabi and S. Shearer, Precision agriculture, whole field farming, and irrigation practices: a production risk analysis, Southern Agricultural Economics Association Annual Meeting, 2002. Mobile, AL.
19. D’Antoni, J.M., A.K. Mishra and H. Joo, Farmers’ perception of precision technology: The case of autosteer adoption by cotton farmers, Computers and Electronics in Agriculture, 2012;87:121-128.
20. Zaini, Z., Compound Fertilizer and Specific Location Fertilization on Rice, Iptek Tanaman Pangan, 2012;7:1-7 (in Indonesian)
21. Susilowati, S.H., A.R. Sumaryanto, S. Nurmanaf, R.N. Friyatno, H. Suhaeti, C. Tarigan, N.K. Muslim and Agustin, Direction Change Tenure and Agricultural Workers, 2008. Center for Economic and Social Analysis of Agricultural Policy, Ministry of Agriculture, Jakarta (in Indonesian)
22. Hardjowigeno, S. and Widiatmaka, Land Evaluation and Land Use Planning, 2011. Gadjahmada University Press. Yogyakarta (in Indonesian) 23. Widiatmaka, Problems in Soil Survey and Land Evaluation in Indonesia, 2012. Proceeding of the National Seminar and Annual Meeting of
Indonesian Sirvey Association, Jakarta (in Indonesian).
24. George, H., An overview of land evaluation and land use planning at FAO, 2015 [cited 2015 November 14]; Available from: http://www.fao.org/fileadmin/templates/nr/images/resources/images/landevaluationatfao.doc.
25. United Nations Environment Programme (UNEP), Promoting Sustainable Agriculture and Rural Development, 2015 [cited 2015 November 10]; Available from: http://www.unep.org/Documents.multilingual/Default.asp?DocumentID=52&ArticleID=62.
26. Food and Agriculture Organization (FAO), A framework for land evaluation, Soils Bulletin 1976; 32
28. Akıncı, H., A.Y. Ozalp and B. Turgut, Agricultural land use suitability analysis using GIS and AHP technique, Computers and Electronics in Agriculture, 2013;97:71-82.
29. Widiatmaka, W. Ambarwulan, C. E. Sjamsudin and L. Syaufina, Geographic Information System and Analytical Hierarchy Process for Land Use Planning of Beekeeping in Forest Margin of Bogor Regency, Indonesia, 2015. Proceeding, 1st
International Seminar on Tropical Silviculture, 21 August 2015, Bogor, Indonesia.
30. Swastika, D.K.S., J. Wargiono, Soejitno and A. Hasanuddin, Policy analysis of rice production increase efficiency through utilization of wetland in Indonesia, Analisis Kebijakan Pertanian, 2007;5(1):36-52 (in Indonesian)
31. Widiatmaka, I. Firmansyah, W. Ambarwulan, K. Munibah and S.R.P. Sitorus, Multidimensional sustainability of paddy field land utilization in Karawang, West Java, Jurnal Kawistara, 2015;5 (2):113-131 (in Indonesian)
32. Indonesian Statistic, Harvested Area - Productivity - Production of Paddy Field all Provinces, 2015 [cited 2015 November 11]; Available from: http://www.bps.go.id/ (in Indonesian).
33. Indonesian Statistic, Statistical Yearbook of Indonesia 2015;2015.
34. Godfray, H.C.J., J.R. Beddington, I.R. Crute, L. Haddad, D. Lawrence, J.F. Muir, J. Pretty, S. Robinson, S.M. Thomas and C. Toulmin, Food security: the challenge of feeding 9 billion people. Science, 2010;327:812–818.
35. Foley, J.A., N. Ramankutty, K.A. Brauman, E.S. Cassidy, J.S. Gerber, M. Johnston, N.D. Mueller, C. O’Connell, D.K. Ray, P.C. West, C. Balzer, E,M. Bennett, S.R. Carpenter, J. Hill, C. Monfreda, S. Polasky, J. Rockstrom, J. Sheehan, S. Siebert, D. Tilman and D.P.M. Zaks, Solutions for a cultivated planet, Nature, 2011;478:337–342.
36. Tilman, D., C. Balzer, J. Hill and B.L. Befort, Global food demand and the sustainable intensification of agriculture. Proc. Natl. Acad. Sci. U.S.A., 2011;108:20260–20264.
37. Zhao, G, Y. Miao, H. Wang, M. Su, M. Fan, F. Zhang, R. Jiang, Z. Zhang, C. Liu, P. Liu and D. Ma, A preliminary precision rice management system for increasing both grain yield and nitrogen use efficiency, Field Crops Research, 2013;154:23-30.
38. Subang Regency Statistic, Subang Regency in Figures 2014, 2013.
39. Silitonga, P. H., Peta Geologi Lembar Bandung, Jawa Skala 1:100,000. 1973. Direktorat Geologi Bandung.
40. Abidin, Z. and Sutrisno, Peta Geologi Lembar Pamanukan, Jawa Skala 1:100,000. 1992. Pusat Penelitian dan Pengembangan Geologi, 1992. Direktorat Geologi Bandung.
41. Djadja, S. H. and N.R. Sutarto, Peta Geologi Teknik Daerah Subang dan Sekitarnya, Jawa Barat Skala 1 : 100.000, 1994. Direktorat Geologi Bandung.
42. Pusat Penelitian Tanah dan Agroklimat, Penelitian Kesesuian Lahan untuk Intensifikasi Tanaman Pangan Provinsi Jawa Barat, 1990. Bagian Proyek Penelitian Tanah, Pusat Penelitian Tanah dan Agroklimat, Badan Litbang Pertanian Departemen Pertanian.
43. Standard National Indonesia (SNI), Land Cover Classification,SNI No. 7645: 2010, 2010. Indonesian National Standardization Agency. 44. De la Rosa, D. and C.A. van Diepen, Qualitative and quantitative land evaluation. In: Land Use and Land Cover, Encyclopedia of Life Support
System (EOLSS-UNESCO), W. Verheye (ed.), 2002. Eolss Publ., Oxford. p.1-20.
45. Widiatmaka, A. Sutandi, A. Iswandi, U. Daras, M. Hikmat and A. Krisnohadi, Establishing land suitability criteria for cashew (Anacardium occidentale L.) in Indonesia, Applied and Environmental Soil Science, 2014;2014:1-14.
46. Rossiter, D.G. and A.R. Van Wambeke, ALES Version 4.65 User’s Manual, 1997, Cornell University, Department of Soil, Crop & Atmospheric Science. Ithaca. NY USA.
47. Widiatmaka, W. Ambarwulan, I. Firmansyah, K. Munibah, P.B.K. Santoso and Sudarsono, Land suitability and dynamic system modelling to define priority areas of soybean plantation in paddy fields in Karawang, West Java, Agrivita Journal of Agric. Sci., 2014;36 (3):235-248. 48. Djaenudin, D, Marwan H., H. Subagyo and A. Hidayat, Technical manual of land suitability for agricultural comodity, 2003. Soil Research
Institute, Research Center for Soil and Agro-climate, Agricultural Research and Development Agency, Ministry of Agriculture (in Indonesian) 49. Ritung, S., Wahyunto, F. Agus and H. Hidayat, Land suitability evaluation with a case map of Aceh Barat district, 2007.Indonesian Soil
Research Institute and World Agroforestry Centre.
50. Widiatmaka, W. Ambarwulan, A. Sutandi, K. Murtilaksono, K. Munibah and U. Daras, Suitable and available land for cashew (Anacardium occidentale L.) in the island of Lombok, Indonesia. Journal of Applied Horticulture, 2015;17 (2):129-139.
51. Forestry Planning Agency, Designation Map of Forest and Water Area, 2002. Forestry Planning Agency, Indonesian Ministry of Forestry. 52. Government of Subang Regency, Official Land Use Planning of Subang Regency 2011-2031, 2014.
53. United States Department of Agriculture (USDA), Keys to Soil Taxonomy, 2010. United States Department of Agriculture.
54. Widiatmaka, W. Ambarwulan, R.P. Tambunan, Y.A. Nugroho, Suprajaka, Nurwadjedi and P.B.K. Santoso, Land use planning of paddy field using geographic information system and land evaluation in West Lombok, Indonesia. Indonesian Journal of Geography, 2014;45 (1): 89-98. 55. Wahyunto, S.M. Murdiyati and S. Ritung, Application of remote sensing technology and and it’s validation test for detection of paddy field
and land use and land cover, Informatika Pertanian, 2004;13:745- 769 (in Indonesian).
56. Widiatmaka, W. Ambarwulan, S. Sabiham, Machfud, M. Hikmat and P.B.K. Santoso, Modelling Land Use Planning for Paddy Field in Subang, West Java. 2015. Research Repport, National Agricultural Research Collaboration with Universities (KKP3N), Research and Development Agency, Ministry of Agriculture (in Indonesian).
57. Li, J. and A.D. Heap, A Review of Spatial Interpolation Methods for Environmental Scientists, 2008. Geoscience Australia, Canberra. 58. Safari, Y., I. Esfandiarpour-Boroujeni, A. Kamali, M.H. Salehi and M. Bagheri-Bodaghabadi, Qualitative land suitability evaluation for main
irrigated crops in the Shahrekord Plain, Iran: a geostatistical approach compared with conventional method. Pedosphere, 2013;23 (6):767-778.