DOI: 10.12928/TELKOMNIKA.v14i4.3792 1228
Analysis of Transmission Lightning Arrester Locations
Using Tflash
M. I. Jambak1, Z. Nawawi2, R.F. Kurnia3, Z. Buntat*4 M. A. B. Sidik*5, Y. Z. Arief6, A. A. Wahab7, Z. Ramli8, M. E. Ramly9
1, 2,3,5Department of Electrical Engineering, Faculty of Engineering, Universitas Sriwijaya, 30662 Indralaya,
Ogan Ilir, South Sumatra, Indonesia
4,5,6Institute of High Voltage and High Current (IVAT), Faculty of Electrical Engineering
Universiti Teknologi Malaysia, 81310 UTM Johor Bahru, Johor, Malaysia
7,8,9Tenaga Nasional Berhad, Malaysia
*Corresponding authors, e-mail: [email protected], [email protected]
Abstract
Tropical countries with extensive lightning activity, such as Malaysia, encounter numerous problems on their electrical transmission and distribution systems. Many overhead lines trip because of back flashover of lightning and shielding failures of the grounding system. To overcome the problem and improve transmission line performance, a detailed lightning study is required to analyse the corresponding lines and determine the best location for transmission line arrester (TLA) installation. We used TFlash to analyse a TLA installation on a 132-kV SSWW-BBST overhead transmission line system located in Selangor, Malaysia. Based on the results, the installation of the TLA at the optimum quantity and at appropriate towers have reduced the number of lines that trip.
Keywords: overhead transmission line, transmission lightning arrester, line performance, lightning protection
Copyright © 2016 Universitas Ahmad Dahlan. All rights reserved.
1. Introduction
Tropical countries located along the equatorial belt have high atmospheric humidity and solar heating. These conditions lead to the development of cumulonimbus clouds, especially during the wet season. Cumulonimbus clouds or thunderclouds are typical clouds that produce lightning events. In addition to its spectacular and fascinating meteorological phenomenon, lightning can cause fatalities and damage to equipment and devices [1, 2].
Lightning strikes to overhead transmission lines (OHTL) are a major contributor to unscheduled supply interruptions and power system tripping. Strikes have caused extensive damage to electrical equipment of the Tenaga Nasional Berhad (TNB) power system [3], and it is estimated that about 50–60% of tripping of the TNB’s power system, especially of transmission and distribution networks, has been caused by lightning [4]. In order to reduce this number, TNB has been conducting numerous studies to ensure the reliability and sustainability of the electrical power supply [5]. Several methods have been proposed to keep failure rates low and to avoid damage and disturbance to the OHTL system. These methods include improving tower footing resistance, installing earth wires, and transmission lightning arrester (TLA) installation [6-8].
Based on reports of various electrical utilities, TLA installation at OHTL towers is the most efficient method compared to other methods for improving OHTL performance. However, due to economic considerations, installation of a TLA at every conductor of an OHTL is impractical. This paper presents an analysis of OHTL performance and a determination of TLA optimum quantity applied at the 132-kV Sungai Semenyih Water Works towards Bandar Baru Salak Tinggi (SSWT-BBST).
2. Description of the Overhead Lines of the 132-kV SSWT-BBST
voltage. Commissioned on 14 August 2007 for Line 1 and on 15 August 2007 for Line 2, the phase conductors used for the OHTL are 2 × 300 mmsq aluminium conductor steel-reinforced (ACSR Batang) with a route length of approximately 14.7 km.
a) Geographical profile
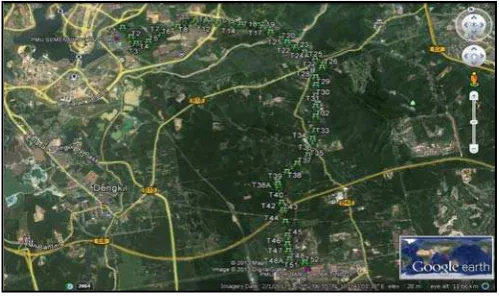
All tower locations were plotted on Google Earth to delineate the OHTL end to end, as shown in Figure 1. The towers were given names by using T followed by continuous numbers.
Figure 1. Tower locations
Figure 2 shows the line end-to-end terrain. Tower T38A is located at the highest elevation (143 m), while towers T21 and T22 are installed at the lowest elevations (14 m).
Figure 2. Tower elevations
b) Tripping records
According to the tripping database Centralized Tripping Information System (CTIS), a total of nine trips occurred from 2007 until 2011. This includes one double-circuit tripping in 2008 and two double-circuit trips in 2010. Table 1 presents the detailed history of trips for the 132-kV SSWW-BBST.
Table 1. Tripping history of the 132-kV SSWW-BBST
No. Date Time Circuit Remarks
1 22/4/2011 16:37 L2 Line tripped - bottom phase
2 28/5/2010 16:47 L1 Line tripped - bottom phase
3 28/5/2010 16:47 L2 Line tripped - bottom phase
4 10/5/2010 17:45 L1 Line tripped - bottom phase
5 10/5/2010 17:45 L2 Line tripped - bottom phase
6 22/2/2010 19:31 L1 Line tripped - bottom phase
7 11/12/2008 17:09 L1 Line tripped - bottom phase
8 11/12/2008 17:09 L2 Line tripped - bottom phase
9 7/10/2007 17:23 L1 Line tripped due to lightning
3. Method
To determine whether a transmission line system requires an improvement in terms of performance, a lightning performance tripping rate has to be calculated. Lightning performance is a measure of the lightning-related flashover for a transmission line. Back flashover (BF), which can occur when lightning strikes the ground wires or towers, and shielding flashover, which occurs when lightning strikes the phase conductors and exceeds the voltage of the the insulation strength, are the types of flashovers that occur along transmission lines. For this study, the line performance tripping rate was calculated as:
/ , (1)
Where lightning performance (LP) is the tripping (T) number divided by the period of service years (S) and length of the lines (l) in kilometres.
If the LP is less than 1.82 trips per 100 km per year, a lightning study is not required. However, if it is more than 1.82 then a study is necessary. From the calculation, the tripping rate for the 132-kV SSWW-BBST line was 16.602 trips per 100 km per year.
The tower model was developed using TFlash software. All data obtained and gathered from the TNB database were translated into parameters for the TFlash software simulation. To develop the model and run the simulation, the required data were tower type, tower impedance, tower footing resistance, installed insulator, circuit assignment and lightning flash density.
The simulation was first run before the TLA was installed. When dubious results were obtained, the entered data were checked. When the relevant data had been obtained, the location and quantity of the TLA was determined. The research methodology flowchart is shown in Figure 3.
Figure 3. Research methodology flowchart
4. Results and Discussion
In Figure 4, the first simulation of the 132- kV SSWW-BBST without an installed TLA is shown.
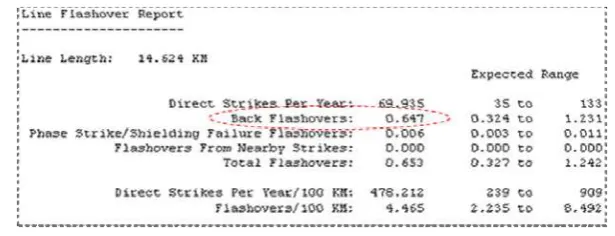
Figure 4. TFlash simulation results (without TLA)
Based on the simulation without the TLA, there were 69 direct lightning strikes to the 132-kV SSWW-BBST lines per year. By normalizing the value per 100 km, 478 flashovers per 100 km per year were found to occur.
The resulting data for BFs showed that there was 0.647 strike per year, which is equal to one strike every 1.55 years. TFlash software was specifically designed to handle the BF issue. The overall occurrence of BFs at each tower is shown in Figure 5.
Figure 5. BF occurrence at the towers
From the data, towers 7, 35, 40, 41 and 45 experienced more than 0.02 BF per year. This rate would decrease to below 0.02 BF per year, which would improve transmission line performance, by installing a TLA.
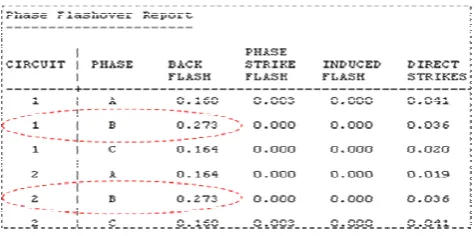
To calculate the rate of backflash, the Phase Flashover Report (PFR) was examined, as presented in Figure 6. ‘Circuit 1–Phase C’ and ‘Circuit 2–Phase A’ have higher rates of BF than other circuits. These data were used to determine which phase in the tower would be equipped with the TLA.
Figure 6. Phase flashover report
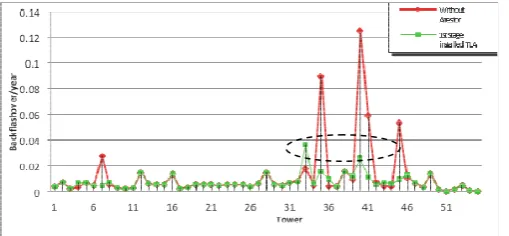
Another simulation (first stage) was then run with an installed TLA, and the baseline and first-stage results were compared (Figure 7).
Figure 7. Comparison of the first stage and before the TLA installation Without Arrester
0 0.02 0.04 0.06 0.08 0.1 0.12 0.14
1 6 11 16 21 26 31 36 41 46 51
Tower
B
ac
k
fl
as
h
o
v
e
r/
y
e
ar
From the first-stage simulation, the BF per year rate for tower 35 and tower 40 were still above the target rate. Therefore, the PFR from the first-stage simulation (Figure 8) was referred to in order to identify other phases that required a TLA installation. As shown in the report, ‘Circuit 1–Phase B’ and ‘Circuit 2–Phase B’ have higher rates of BFs. Therefore, four units of TLAs are required for Tower 35 and Tower 40.
Figure 8. First-stage Phase Flashover Report
Subsequently, another simulation was carried out (second stage) in order to observe transmission line performance. Results of BF per year for the second stage showed that Tower 39 was still above the target rate (Figure 9). The PFR (Figure 10) was then examined to determine another location for the TLA.
Figure 9. Comparison of first and second stages of TLA installation
Figure 10. Second-stage Phase Flashover Report
From the PFR of the second stage, the other TLA units needed to be installed in ‘Circuit 1–Phase B’ and ‘Circuit 2–Phase B’ of Tower 39.
0 0.02 0.04 0.06 0.08 0.1 0.12 0.14
1 6 11 16 21 26 31 36 41 46 51
Tower
Ba
ck
fl
a
so
v
e
r/
y
e
a
r
1st stage installed TLA
Stage 2 with additional TLA
The third stage of the BF per year rate (Figure 11) provided an acceptable result after the installation of two units of TLA in Tower 39, and the overall target (below 0.02 BF/year) was achieved.
Figure 11. Comparison of second and third stages of TLA installation
Table 2. Required number of installed TLAs
Circuit 1 Circuit 2 A B C C B A 1 2 3 4 5 6 0 3 5 0 3 5
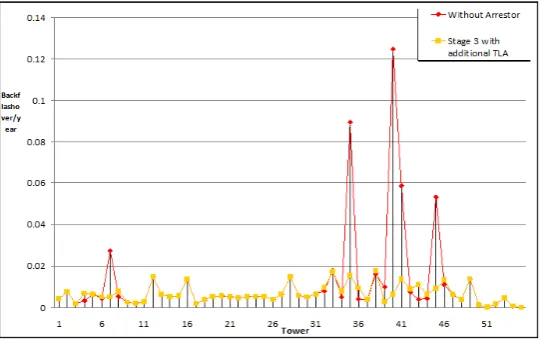
To summarize the entire process, a comparison of BF per year before and after installation of TLAs is shown in Figure 12. In total, 16 units of TLAs were required for the 132-kV SSWW-BBST OHTL (Table 2). Figures 12 and 13 show the final results from this simulation before and after the third stage of TLA installation.
Figure 12. Comparison of BF per year before and after third-stage TLA installation
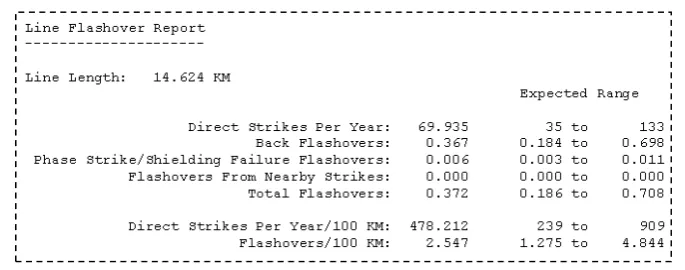
Figure 13. Line flashover report after TLA installation
5. Conclusion
An analysis of OHTL performance of the 132-kV SSWT-BBST was accomplished by using TFlash software. From the simulation, the location and quantity of TLAs required to improve the transmission lines were obtained. Based on the results, the BF was successfully reduced by approximately 56.7%.
Acknowledgements
The authors thank Universiti Teknologi Malaysia for the financial support provided throughout the period of this research and Mr. Zulhilmi Ramli and Mr. Mohd Erwan Ramly from Tenaga Nasional Berhad for the data provided.
References
[1] Z Nawawi, MA Bakar Sidik, M Boon Kean, H Ahmad, Z Buntat, N Azlinda Ahmad, et al. Data transmission system of rotating electric field mill network using microcontroller and GSM module.
Jurnal Teknologi (Sciences and Engineering), 2013; 64: 109-112.
[2] MAB Sidik, H Ahmad. On the study of modernized lightning air terminal. International Review of Electrical Engineering. 2008; 3: 1-8.
[3] N Zawani, Junainah, Imran, M Faizuhar. Modelling of 132kV overhead transmission lines by using ATP/EMTP for shielding failure pattern recognition. In Procedia Engineering. 2013: 278-287.
[4] MK Hassan, A Che Soh, A Kadir, MZ Abidin, A Rahman, R Zafira. Lightning strike mapping for peninsular Malaysia using artificial intelligence techniques. Journal of Theoretical and Applied Information Technology. 2011; 34: 202-214.
[5] H Ahmad, MI Jambak, KY Lau, MKN Mohd Sarmin, SS Ahmed, MAB Sidik. Switching phenomenon in six-phase transmission system. International Review of Electrical Engineering. 2011; 6: 1895-1904. [6] L Ekonomou, DP Iracleous, IF Gonos, IA Stathopulos. An optimal design method for improving the
lightning performance of overhead high voltage transmission lines. Electric Power Systems Research.
2006; 76: 493-499.
[7] N Malcolm, RK Aggarwal. An analysis of reducing back flashover faults with surge arresters on 69/138 kV double circuit transmission lines due to direct lightning strikes on the shield wires. In 12th IET International Conference on Developments in Power System Protection, DPSP 2014. 2014: 1-6. [8] R Zoro, R Mefiardhi, RR Aritonang, H Suhana. Observation on improved 20 kV's overhead distribution