DOI: 10.12928/TELKOMNIKA.v13i2.1323 686
Influences of the Input Factors towards the Success of
an Information System Project
A’ang Subiyakto*1, Abd. Rahman Ahlan2, Mira Kartiwi3, Husni Teja Sukmana4 1,4 Syarif Hidayatullah State Islamic University Jakarta
Jl. Ir. H, Juanda No. 95, 15412, Tangerang, Indonesia Ph./Fax: +6221 7401925/+6221 7493315
2,3 International Islamic University Malaysia
Jl. Gombak, 50728, Kuala Lumpur, Malaysia. Ph./Fax: +60 361964000 /+60 361964053 *Corresponding author, e-mail: [email protected], [email protected],
[email protected], [email protected]
Abstract
This study tried out three input factors which theoretically affect the success of information system (IS) project. These factors were adopted from the McLeod and MacDonell’s (M&M’s) project framework and then examined using survey toward the internal project stakeholder in a sampled institution. A stratified sampling was carried out based on the project experience ownership and then sent both online and paper-based questionnaires to 130 selected respondents. A number of 62 (48%) valid responses were analysed using a partial least squares-structural equation modelling (PLS-SEM) software. The significances of path coefficients, the acceptances of hypotheses, the predictors relevances, and the moderate coefficient determination of the IS project’s success variable present the proposed model approval for the subsequent studies.
Keywords: IS Project, M&M’s Project Framework, Input Factors, Project Stakeholders, PLS-SEM
1. Introduction
Systematically, IS project is a micro environment of the business system [1],[2]. Similar to this systematic-environmental description, [3] also elucidated their concept within four environmental levels of a project, e.g., process, deliverable, business, and context levels. Accordingly, [4] proposed their project framework, based on their meta-analysis study about influencing factors of the software system project outcomes during 1996-2006. Furthermore, [5] adopted and combined that framework with the DeLone and &McLean’s success model [6] to represent the processional and causal model of an IS project in term of its input-proses-output (IPO) logic [7],[8]. These literatures described that several researches [9]-[10] focused on the influences of the environment contexts towards the IS project performance. Like the above scholars, [11],[12] indicated that the most complicated IS project problems are related to managerial, organizational, and cultural issues. Those factors are inherited from the particular context where the projects are carried out [13]. This means that the problems are not only about the technical ones, e.g., the triangle aspects [14]. Despite the fact that an IS project was performed well and it may technically consider “successful,” the project might also reputed to be “futile” due to contextual indifferences [8]. It was reasonable if [15] who cited [10] emphasized that the project success factors are not universal for all projects. Therefore, it is essential for studying factors of each IS project in regard to its specific-environmental contexts.
2. Research Model and Hypotheses
In this study, three factors of the M&M’s project framework [4], i.e., project contents (PCT), people and actions (PAC), and institutional contexts (ICT) were adopted in the proposed model (Figure 1) to measure an IS project success (PCS). The adoption was applied considering the focus of the study, i.e., the input influences in the IPO logic of an IS project model [5],[7],[8]. The similar rationale was also used in respect of the exclusion of the development process factor (4). This factor was excluded because the researchers assumed as the processional factors of the IPO model [5],[7],[8]. The rationale of this modelling was based on the Belout and Gauvreau’s [17] description that most of research models were modelled based on the previous models or theories.
Figure 1. The proposed research model
Retrospectively, some researchers [18]-[20] described that the success definition of a project was extended from the technical perspectives to the strategic ones [19] considering the stakeholder perceptions. Therefore, the researchers formulated resources savings (PSC1), managerial effectiveness (PCS2), productivity improvement (PSC3), customer satisfaction (PCS4), and competitive advantage (PSC5) as the PCS indicators [5],[11],[18]-[22]. Meanwhile, many scholars [4],[5],[8],[9],[11],[18],[19] indicated that PCT is one of the input factors of the PCS. This variable is related to the characteristics of the technology, interrelationship, process, and structure used in the project which materially affects the project outcome. [23] indicated that the managerial capability of the variable has consequences toward the project success. Accordingly, we used project size (PCT1), project complexity (PCT2), resource availability (PCT3), technology development (PCT4), data quality (PCT5) [4],[5],[11],[19] as the PCT indicators and hypothesize that PCT affect significantly PAC (H2) and PCS (H4).
3. Research Method
This empirical study was methodologically performed in eight stages during ten months in 2014 (Figure 2).
Figure 2. The research procedures
The Instrument was a questionnaire, including the invitation letter, its research introduction, and the question pages (i.e., three participant profile, six project profile, and 20 main questions). Specifically, the measurement of the main question was designed using the five-point Likert scale ranging from “strongly disagree” (1) to “strongly agree” (5) [31]. In order to ensure validity and reliability of the instrument, the researchers adopted the selected items of the previous studies [4]-[6],[19], conducted a pre-test examination to receive empirical feedback from five IS academician [32],[33], and conducted the unidimensionality procedure [34],[35] with five deletions (PCT1, PCT2, PCT4, ICT1, and ICT5). Meanwhile, the data collection was involved the internal IS project stakeholders, i.e., top users, business key users, IT key users, project managers, and project team members in the sampled institution. The justification of this involvement was based on the significance of the key informant roles [32],[33],[36]. The scholars obtained the data from the IT unit in the sampled institution, including names, positions, telephones, and emails (N=257). A purpose sampling then was applied based on the project experience ownership. The questionnaire distribution was conducted via email and direct visitations towards 130 (49%) respondents who experienced in the IS projects. The result of this data collection was, the researchers collected 62 (48%) valid responses, including 40 (31%) online and 23 (17%) paper-based answers. The majorities of the participants (91.9%) were the bachelor graduates and above with the highest percentage of the education levels was the master graduates (56.5%). Most participants (91.9%) experienced during under 10 years and most of them (40.3%) experienced during 5-10 years in the IS project works. Meanwhile, the highest percentage of the participants (58.1%) is the project team members.
In addition, the data analysis was statistically carried out using MS. Excel 2007 to represent the demographic data and SPSS version 20 to prepare PLS-SEM analysis. Afterwards, SmartPLS 2.0 was used in the inferential data analysis. This PLS-SEM software was applied regarding its vast potential in SEM method [37]-[41]. It was related to the objectives of the exploration and prediction with the relative-small sample size (n=62). In this inferential analysis, the researchers performed the measurement model assessments to evaluate reliability and validity of the outer model and the structural model assessments to represent the path and explanatory power of the inner model [37]-[41]. The measurement model assessments included the indicator reliability, internal consistency reliability, convergent validity, and discriminant validity assessments. Meanwhile, the structural model assessments were applied through path coefficient (β), coefficient of determination (R2), t-test, effect size (f2), predictive relevance (Q2) and relative impact (q2) assessments [37]-[41].
4. Analysis Results
4.1. The Demographical Information of the IS Project
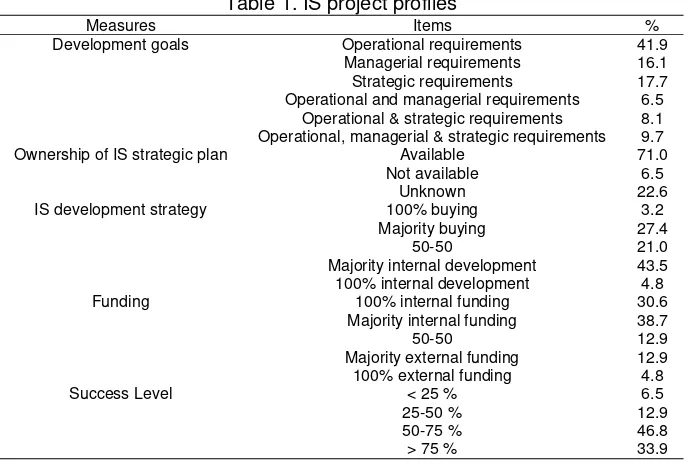
percentage of the participants (38.7%) answered that the projects were funded by internal funding. Moreover, majority participants (80.7%) answered that percentage of the project success level is more than 50% and 33.9% of the participants stated that this percentage was more than 75%.
Table 1. IS project profiles
Measures Items %
Development goals Operational requirements 41.9 Managerial requirements 16.1 Strategic requirements 17.7 Operational and managerial requirements 6.5
Operational & strategic requirements 8.1 Operational, managerial & strategic requirements 9.7 Ownership of IS strategic plan Available 71.0
Not available 6.5 Unknown 22.6 IS development strategy 100% buying 3.2
Majority buying 27.4 50-50 21.0 Majority internal development 43.5 100% internal development 4.8 Funding 100% internal funding 30.6
Majority internal funding 38.7
50-50 12.9
Majority external funding 12.9 100% external funding 4.8
Success Level < 25 % 6.5 25-50 % 12.9 50-75 % 46.8 > 75 % 33.9
4.2. The Measurement Model Assessments
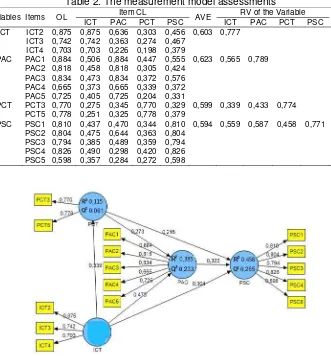
Table 2. The measurement model assessments
Variables Items OL ICT PAC PCT PSC Item CL AVE ICT PAC PCT PSC RV of the Variable CR ICT ICT2 0,875 0,875 0,636 0,303 0,456 0,603 0,777 0,819
ICT3 0,742 0,742 0,363 0,274 0,467 ICT4 0,703 0,703 0,226 0,198 0,379 PAC PAC1 0,884 0,506 0,884 0,447 0,555 0,623 0,565 0,789 0,891 PAC2 0,818 0,458 0,818 0,305 0,424 PAC3 0,834 0,473 0,834 0,372 0,576 PAC4 0,665 0,373 0,665 0,339 0,372 PAC5 0,725 0,405 0,725 0,204 0,331 PCT PCT3 0,770 0,275 0,345 0,770 0,329 0,599 0,339 0,433 0,774 0,750
PCT5 0,778 0,251 0,325 0,778 0,379 PSC PSC1 0,810 0,437 0,470 0,344 0,810 0,594 0,559 0,587 0,458 0,771 0,879
PSC2 0,804 0,475 0,644 0,363 0,804 PSC3 0,794 0,385 0,489 0,359 0,794 PSC4 0,826 0,490 0,298 0,420 0,826 PSC5 0,598 0,357 0,284 0,272 0,598
Figure 3. Results of the SmartPLS analysis
4.3. The Structural Model Assessments
These assessments were carried out through six assessment stages and the results were presented graphically in Figure 3 and Table 3. First, βwas evaluated with the above value of 0.1 to determine the path impact within the model [37]-[41]. The results presented statistically that the six paths were significant. Second, R2was evaluated to describe variance of the target endogenous variable [37]-[41] with values approximately 0.670 substantial, around 0.333 moderate, and about 0.190 and lower weak. The results presented that R2 of PCT (0.115) was weak, which it was meant that ICT weakly explained 11.5% of the PCT variance, PCT and ICT together moderately expressed 38.5% of the PAC variance, and ICT, PCT, and PAC together also moderately described 45,8% of the PSC variance. Third, t-test was evaluated via bootstrapping procedure using two-tailed test with a significance level of 5%, whereas the hypotheses will be accepted if the t-test is larger than t-values (1.96) [39]-[40]. The results indicated that overall hypotheses were accepted.
Table 3. The Structural model assessments H Paths β t-test f2 q2 Remarks
β t-test * f2 q2
H1 ICTPCT 0.339 5,283 0,130 0,088 Significant Accepted Medium small H2 PCTPAC 0.273 4,864 0,106 0,051 Significant Accepted Medium small H3 ICTPAC 0.473 11,774 0,315 0,178 Significant Accepted Large medium H4 PCTPSC 0.215 3,827 0,059 0,030 Significant Accepted Low small H5 PACPSC 0.304 3,710 0,114 0,029 Significant Accepted Medium small H6 ICTPSC 0.322 3,942 0,094 0,079 Significant Accepted Medium small
5. Discussions
In this section, two discussion points are related to the demographic information and the inferential measurement results.
First, it is reasonable that majority participants (80.7%) presented the project success percentage was more than 50% and around 33.9% of the participants even mentioned that the success percentage was more than 75%. It is because the IS project may have carried out based on availability of the IS strategic plan as stated by about 71% of the participants, the gradual project implementation as presented by the development goal attainment focusing on the operational into strategic requirements, and the internal party involved as presented by almost 70% of the participants. In short, the state and attainment of the IS project success were in line with the previous IS project success studies, e.g., [2] and [18] who elucidated that the IS project success related to both the project management and product utilization successes.
Second, although the overall outer model statistically demonstrated good psychometric properties, the five rejection indicators were needed to be notice for being inconsistent with the selected prior literatures [4],[8],[9],[18],[19]. In this study, this might unsupported by the developed instrument, the collected data or the trend of the IS project implementation in the sampled institution. In addition, based on the structural model assessments, we also notice two highlight points. (1) However, the estimated values of ICTPCT presented significantly, the hypothesis was accepted, and the Q2 were predictive relevance, but R2 of the PCT was explained weakly (11,5%) by ICT. The significance, acceptance, and relevance of the path are consistent with the basis literatures used. However, the weak explanation should properly become an attention, related to the developed instrument and the collected data in the study or this might be the tendency of the IS project implementation in the sampled institution. (2) Similar to the significance, acceptance, and relevance of the path, the low f2 of the PCTPSC is also suitable to be noticed. This might unsupported by the developed instrument, the collected data and the analysis or portrait of the project implementation trends whereas PCT did not influence PSC.
6. Limitations
There are three inherent limitations of this study. First, the collected data of the survey were obtained from the sampled institution. Therefore, the findings should not be generalized for the other institutions. It is because data from the other institutions may be different from what were found and discussed in this study. Second, the questionnaire items were adopted and adapted from the selected literatures, thus the other studies which use different items may produce the different findings. Third, this study involved the selected respondents who most of them are the project team members in almost 60%. Accordingly, the other proportions of the respondents may differently present the findings. In brief, the subsequent researches can take this study findings and reconsidering the limitations.
7. Conclusion
regarding to its vast potential in SEM method with the relative sample size (n=62) for assessing the measurement and structural model. Despite this study have several limitations, the results of the measurement and structural model assessments are potential parameters that may be a consideration point for the next studies, especially the moderate R2 of PCS that presents the model acceptability
Acknowledgements
This work was supported by the Research-Based National Publication Program No. Un.01/KPA/182/2014, the Center of Research and Publication, Syarif Hidayatullah State Islamic University Jakarta, Indonesia.
References
[1] Lim CS, Mohamed MZ. Criteria of project success: an exploratory re-examination. International Journal of Project Management (IJPM). 1999; 17(4): 243-248. DOI:10.1016/S0263-7863(98)00040-4. [2] Kerzner HR. Project management: a systems approach to planning, scheduling, and controlling. John
Wiley & Sons. 2013.
[3] Howsawi EM, Eager D, Bagia R. Understanding project success: The four-level project success framework. IEEE International Conference on IEEM. Singapore. 2011: 620-624. DOI: 10.1109/IEEM.2011.6117991.
[4] McLeod L, MacDonell SG. Factors that affect software systems development project outcomes: A
survey of research. ACM Computing Surveys CSUR. 2011; 43(4): 24. DOI:
10.1145/1978802.1978803.
[5] Subiyakto A, Ahlan AR. Implementation of input-process-output model for measuring information system project success. TELKOMNIKA Indonesian Journal of Electrical Engineering. 2014; 12(7): 5603-5612. DOI: 10.11591/telkomnika.v12i7.5699.
[6] DeLone WH, McLean E. The DeLone and McLean model of information systems success: a ten-year
update. Journal of Management Information Systems. 2003; 19(4): 9-30.
http://mesharpe.metapress.com/content/PEQDJK46VY52V4Q6
[7] Davis WS. HIPO Hierarchy Plus Input-Process-Output. The information system consultant’s handbook: Systems Analysis and Design. CRC, Florida. 1998: 503-510.
[8] Kellogg WK. Logic model development guide. Michigan: WK Kellogg Foundation. 2004.
[9] De Wit A. Measurement of project success. IJPM. 1988; 6: 164-170. DOI: 10.1016/0263-7863(88)90043-9.
[10] Dvir D, Lipovetsky S, Shenhar A, Tishler A. In search of project classification: a non-universal approach to project success factors. Research Policy. 1988; 27(9): 915-35. DOI: 10.1016/S0048-7333(98)00085-7.
[11] McLeod L, Doolin B, MacDonell SG. A perspective-based understanding of project success. PMJ. 2012; 43(5): 68-86. DOI: 10.1002/pmj.21290.
[12] Hussein BA, Klakegg OJ. Measuring the impact of risk factors associated with project success criteria in early phase. Procedia-Social and Behavioral Sciences. 2014; 119: 711-718. DOI: 10.1016/j.sbspro.2014.03.079.
[13] Azimi A, Manesh FS. A new model to identify and evaluate critical success factors in the IT projects; Case study: using RFID technology in Iranian fuel distribution system. IJISM. January-June 2010; 99-112. http://ijism.ricest.ac.ir/index.php/ijism/article/view/142/125.
[14] Atkinson R. Project management: cost, time and quality, two best guesses and a phenomenon, its time to accept other success criteria. IJPM. 1999; 17: 337-342. DOI: 10.1016/S0263-7863(98)00069-6.
[15] Sudhakar GP. A model of critical success factors for software projects. JEIM. 2012; 25(6): 537-558. DOI: 10.1108/17410391211272829.
[16] Xu X, Zhang W, Barkhi R. IT infrastructure capabilities and IT project success: a development team perspective. ITM. 2010; 11(3): 123-142. DOI: 10.1007/s10799-010-0072-3.
[17] Belout A, Gauvreau C. Factors influencing project success: the impact of human resource management. IJPM. 2004; 22(1): 1-11. DOI: 10.1016/S0263-7863(03)00003-6.
[18] Jugdev K, MÜller R. A retrospective look at our evolving understanding of project success. PMJ. 2005; 36: 19-31. DOI: 10.1109/EMR.2006.261387.
[19] Subiyakto A, Ahlan AR. A Coherent Framework for Understanding Critical Success Factors of ICT Project Environment. Proceeding of ICRIIS. Kuala Lumpur. 2013: 342–347. DOI: 10.1109/ICRIIS.2013.6716733.
[21] Gable GG, Sedera D, Chan T. Re-conceptualizing information system success: The IS-impact measurement model. JAIS. 2008; 97: 377–408. http://aisel.aisnet.org/jais/vol9/iss7/.
[22] Belassi W, Tukel OI. A new framework for determining critical success/failure factors in projects. IJPM. 1996; 14(3): 141-151. DOI: 10.1016/0263-7863(95)00064-X
[23] Hussein BA, Silva PP, Pigagaite G. Perception of complexities in development projects. IEEE 7th IDAACS. 2013; 2: 537-542. DOI: 10.1109/IDAACS.2013.6662982.
[24] Randeree K, Faramawy ATE. Islamic perspectives on conflict management within project managed environments. IJPM. 2011; 29(1): 26-32. DOI: 10.1016/j.ijproman.2010.01.013.
[25] Liu JYC, Chen HG, Chen CC, Sheu TS. Relationships among interpersonal conflict, requirements
uncertainty, and software project performance. IJPM. 2011; 29(5): 547-556. DOI:
10.1016/j.ijproman.2010.04.007.
[26] Marnewick C, Les Labuschagne. Factors that influence the outcome of information technology projects in South Africa: An empirical investigation. Acta Commercii. 2009; 9(1): 78-89. DOI: 10.4102/ac.v9i1.98.
[27] Chandrasekaran A, Linderman K, Schroeder R. The role of project and organizational context in
managing high‐tech R&D projects. Production and Operations Management. 2014. DOI:
10.1111/poms.12253.
[28] Qureshi SM, Kang C. Analysing the organizational factors of project complexity using structural equation modelling. IJPM. 2015; 33(1): 165–176. DOI: 10.1016/j.ijproman.2014.04.006.
[29] Nasir MH, Sahibuddin S. Critical success factors for software projects: A comparative study. SRE. 2011; 6(10): 2174-2186. DOI: 10.5897/SRE10.1171.
[30] Amiri M, Sarfi A, Kahreh MS, Maleki MH. Investigation the Critical Success Factors of CRM Implementation in the Urban Management; Case Study: Tehran Municipality. International Bulletin of Business Administration. 2011; 9: 120-132.
[31] MC Kaptein, et al. Powerful and consistent analysis of likert-type ratingscales. Proceedings of the SIGCHI Conference on Human Factors in Computing Systems. ACM. 2010: 2391-2394. DOI: 10.1145/1753326.1753686.
[32] Creswell JW, Research design: Qualitative, quantitative, and mixed methods approaches. Sage Publications. 2013.
[33] Marshall C, Rossman GB. Designing qualitative research. Sage Publications. 2010.
[34] Fornell C, Larcker DF. Evaluating structural equation models with unobservable variables and measurement error. JMR. 1981: 39-50. http://www.jstor.org/stable/3151312.
[35] Afthanorhan WMABW. A Comparison Of Partial Least Square Structural Equation Modeling (PLS-SEM) and Covariance Based Structural Equation Modeling (CB-(PLS-SEM) for Confirmatory Factor
Analysis. IJESIT. 2013; 2(5): 198-205.
http://www.ijesit.com/Volume%202/Issue%205/IJESIT201305_27.pdf.
[36] Beringer C, Jonas D, Kock A. Behavior of internal stakeholders in project portfolio management and its impact on success. IJPM. 2013; 31(6): 830-846. DOI: 10.1016/j.ijproman.2012.11.006.
[37] Henseler J, Ringle CM, Sinkovics RR. The use of partial least squares path modeling in international
marketing. Advances in International Marketing. 2009; 20: 277-319. DOI:
10.1108/S1474-7979(2009)0000020014.
[38] Urbach N, Ahlemann F. Structural equation modeling in information systems research using partial least squares. JITTA. 2010; 11(2): 5-40. http://aisel.aisnet.org/jitta/vol11/iss2/2
[39] Hair JF, Ringle CM, Sarstedt M. PLS-SEM: Indeed a silver bullet. JMTP. 2011; 19(2): 139-152. DOI: 10.2753/MTP1069-6679190202
[40] Hair JF, Sarstedt M, Ringle CM, Mena JA. An assessment of the use of partial least squares structural equation modeling in marketing research. JAMS. 2012; 40(3): 414-433. DOI: 10.1007/s11747-011-0261-6.
[41] Wong KKK. Partial Least Squares Structural Equation Modeling (PLS-SEM) Techniques Using
SmartPLS. Marketing Bulletin. 2013; 24: 1-32.
http://marketing-bulletin.massey.ac.nz/v24/mb_v24_t1_wong.pdf.
[42] Nunnally JC, Bernstein IH. Psychometric Theory. New York: McGraw-Hill, 1994.