Delayed stool specimen collection during the early and late stages of the
Polio outbreak increase the risk of negative Wild Poliovirus laboratory
results in some districts in Indonesia
Antonia Retno Tyas Utami1, Bastaman Basuki2, Agus Sjahrurahman3
Abstrak
Pada tahun 2005 Indonesia mengalami Kejadian Luar Biasa (KLB) polio. Sebanyak 58,9% kasus KLB nasional terjadi di tiga kabupaten Lebak, Serang dan Sukabumi. Namun, beberapa spesimen tinja kasus lumpuh layu akut (Acute Flaccid Paralysis atau AFP) menunjukkan hasil pemeriksaan negatif virus polio liar (VPL). Tujuan penelitian ialah untuk mengetahui beberapa faktor risiko yang dominan terhadap hasil pemeriksaan negatif VPL. Pada studi potong lintang terhadap semua sampel spesimen yang pertama yang diambil dari kasus AFP selama tahun 2005 dari tiga kabupaten. Data berasal dari Laboratorium Nasional Polio tentang: identitas kasus AFP; tanggal: lumpuh, ambil spesimen, kirim, diterima, dan proses; kondisi diterima dan hasil uji. Di samping itu dilakukan konfirmasi lapangan: data tempat pengambilan spesimen, fasilitas, dan tenaga surveilans. Analisis memakai pendekatan risiko relatif (RR) terhadap hasil pemeriksaan negatif VPL dengan menggunakan regresi Cox. Prevalensi hasil negatif VPL adalah 31,5%. Hasil negatif didapat pada masa awal KLB Februari-April (60%) dan akhir KLB Juli-Desember 2005 (66,2%), sedangkan yang terendah adalah pada bulan Mei-Juni (15,5%). Faktor-faktor yang dominan berkaitan dengan risiko hasil pemeriksaan negatif VPL adalah faktor tidak tepat waktu ambil spesimen, kabupaten asal spesimen, dan periode bulan pengambilan. Keterlambatan pengambilan spesimen mempertinggi risiko hasil pemeriksaan negatif VPL sebesar 70% dibandingkan dengan spesimen yang diambil tepat waktu [risiko relatif suaian (RRa) = 1,70; 95% interval kepercayaan (CI): 1,01 – 2,88]. Faktor ketidaktepatan waktu pengambilan spesimen,
periode awal dan akhir KLB mempunya risiko lebih tinggi terhadap risiko hasil pemeriksaan negatif VPL. Oleh karena itu perlu perhatian khusus terhadap faktor-faktor risiko tersebut. (Med J Indones. 2007;16:122-6)
Abstract
In 2005, a wild poliovirus (WPV) outbreak occurred in Indonesia. Some stool specimens from acute flaccid paralysis (AFP) subjects, showed negative laboratory results for WPV. The aim of this study was to identify several risk factors associated with negative WPV laboratory results. A cross-sectional study was conducted on all AFP surveillance stool specimens taken from the three districts where 58.9% of the outbreak cases occurred. Data were obtained from Bandung and Jakarta National Polio Laboratory regarding identity of cases; onset of paralysis; data on specimen collected (timing, dispatched, received, and tested); and results of the tests. In addition, field visits were conducted to the three districts for confirmation of data collecting methods, facilities, and field personnel. The Cox regression method for relative risk (RR) was used for analysis. The prevalence of negative results was 31.5%. Negative results at the beginning of the outbreak (February–April) were 60%, at the end of the outbreak (July–December) were 66.2%, and at the height of the outbreak (May–June) were 15.5%. Negative WPV results were related to delayed specimen collection, origin of district specimen, and the period of specimen collection. Delayed versus on-time stool collection increased the risk of negative results by 70% (adjusted relative risk = 1.70; 95% confidence intervals = 1.01 - 2.88). In conclusion, inappropriate timing of specimen collection, in particular during the early and late stages of the polio outbreak, needs special attention to minimize the risk of negative WPV laboratory results. (Med J Indones. 2007;16:122-6) Keywords. polio, surveillance, specimen collection, risk of negative result
Polio surveillance is directed at detecting all cases of Acute Flaccid Paralysis (AFP) in children under the
age of 15 years and identifying the circulating wild poliovirus (WPV). In the last 10 years, from 1996 to 2005, no case of AFP was confirmed as polio in Indonesia.1However, in March 2005 an AFP case was noted, and within 23 weeks the virus had spread to 4 provinces in Java and two provinces in Sumatra.1,2
Laboratory tests play an important role in polio surveillance since AFP can be caused by agents other 1
National Agency for Drug and Food Control Republic of Indonesia, Jakarta, Indonesia
2
Department of Community Medicine, Faculty of Medicine, University of Indonesia, Jakarta, Indonesia
3
than the poliovirus. Therefore, all suspected cases must undergo thorough virological tests. Since only 0.1 – 1.0% of polio infection present symptoms of AFP, it is important to accurately and reliably identify any suspected WPV transmission.1,2
In April 2005, the virus isolated from the stool of an AFP case in the district of Sukabumi was found to be type 1 WPV. This virus originated in Nigeria and was believed to be the cause of the polio outbreak in Indonesia. A study should be undertaken to identify contributing factors for this findings, since surveillance data from 2003-2004 reported an excellent achievement where the total national rate for AFP was 1.26 per 100.000 with adequate specimen collection reaching 90.1%.3 Several possible risk factors contributed to this outbreak, bringing about the spread of the virus which exceeded estimation in the subsequent mop up efforts. The specimen needs to be identified in order to classify cases virologically, which is a part of AFP surveillance.3,4 Improper timing of specimen collection and/or failure to handle the specimen thoroughly in the cold chain before reaching in the laboratory will potentially yield a negative result.4-6
The aim of this study is to identify the risk factors, such as the timing of the specimen collection, which lead to negative results for poliovirus in the National Polio Laboratory.
METHODS
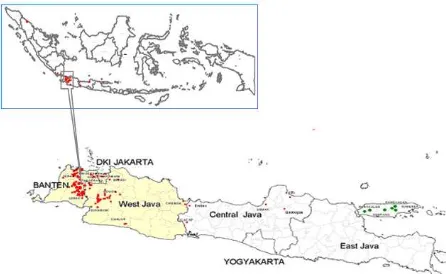
This is a cross-sectional study. Secondary data were obtained from the National Polio Laboratory in Bandung and Jakarta for all cases of AFP in 2005 that came from 3 districts in West Java (Sukabumi, Lebak, and Serang). These districts accounted for 58.9% of the AFP cases in Indonesia.4
The data extracted covered the time of specimen collection, the district where the specimen originated, the place of collection, the rapidity of dispatching the specimen, the period when it was examined, and the level of activity in the laboratory during the months of the outbreak. For the purpose of analysis, the time of specimen collection is the interval of days between onset of paralysis and stool specimen collection (on time if ≤ 14 days; delayed if > 14 days);2-6 district of origin (either Lebak, Serang, or Sukabumi); place of collection (either
hospital or patient’s home); rapidity of dispatching the
specimen collected is the interval of days from
collection up to the time received by the National Laboratory in Jakarta or Bandung (fast if ≤ 3 days; slow if > 3 days); the period when stool specimen was taken in 2005 (July-December, May–June, February– April); the period when the specimen was examined in 2005 (July-December, May– June, February–April); and the level of activity in the laboratory, which was the number of specimens examined in one day in a particular laboratory (normal = 2-10 specimens, high = 11–20 specimens, very high = > 20 specimens). The data on field conditions of the cases was obtained by direct field observations by the first author in all 3 districts from February-April 2006. It is hoped that the data obtained will fully describe the outbreak of polio in these districts.
Relative risk was calculated by Cox regression method instead of logistic regression, since the prevalence of WPV negative laboratory results were high.7 A risk factor was considered to be a potential confounder if the univariate test resulted in a P-value of < 0.25. It will then be a candidate in the multivariate analysis for negative WPV laboratory results risk factors.8 Ninety-five percent confidence intervals were based on the standard error of coefficient estimates. Statistical analyses were done using STATA 6.0 software.9 Ethical clearance was granted by the Board of Epidemiologic Post Graduate Program, Faculty of Public Health of the University of Indonesia.
RESULTS
Figure 1 shows the location of the study areas in three districts in the western part of Java Island.
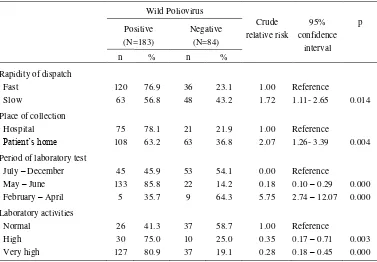
Table 1. Several risk factors and the risk of negative laboratory results for Wild Poliovirus
Wild Poliovirus
Crude relative risk
95% confidence
interval p Positive
(N=183)
Negative (N=84)
n % n %
Rapidity of dispatch
Fast 120 76.9 36 23.1 1.00 Reference
Slow 63 56.8 48 43.2 1.72 1.11- 2.65 0.014
Place of collection
Hospital 75 78.1 21 21.9 1.00 Reference
Patient’s home 108 63.2 63 36.8 2.07 1.26- 3.39 0.004
Period of laboratory test
July – December 45 45.9 53 54.1 0.00 Reference
May – June 133 85.8 22 14.2 0.18 0.10 – 0.29 0.000
February – April 5 35.7 9 64.3 5.75 2.74 – 12.07 0.000
Laboratory activities
Normal 26 41.3 37 58.7 1.00 Reference
High 30 75.0 10 25.0 0.35 0.17 – 0.71 0.003
Very high 127 80.9 37 19.1 0.28 0.18 – 0.45 0.000
Table 2. The relationship between timing of specimen collection, district of origin, period when specimen was taken and the risk of negative laboratory results for WPV
Wild Poliovirus
Adjusted relative risk*
95% confidence
interval P Positive
(N=183)
Negative (N=84)
n % n %
Timing of specimen collection
On time 144 74.6 49 25.4 1.00 Reference
Delayed 39 52.7 35 47.3 1.70 1.01 – 2.88 0.047
District of origin
Lebak 104 74.8 35 25.2 1.00 Reference
Serang 53 74.6 18 25.4 2.14 1.18 – 3.89 0.013
Sukabumi 26 45.6 31 54.4 4.70 2.62 – 8.43 0.000
Period of specimen collection
July – December 24 33.8 47 66.2 1.00 Reference
May – June 153 85.5 28 15.5 0.26 0.14 – 0.46 0.000
February – April 6 40.0 9 60.0 2.70 1.19 – 6.13 0.017
Specimens were obtained from 269 cases, but 2 could not be analyzed due to incomplete data.
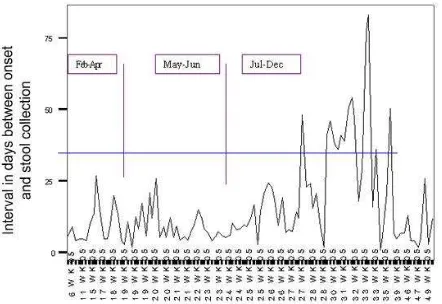
Figure 2 shows the weekly report of the number of specimens obtained in 2005. From the report it was noted that, with respect to timing, collection of a high number of stool samples was delayed at the beginning of the outbreak in February-April 2005 (26.7%) and at the end of the outbreak (50.7%), but not at the peak of the outbreak in May-June 2005 (18.7%).
Figure 2. Number and interval (days) between onset and stool collection during Polio outbreak in 2005
(Drawing from surveillance data of Ministry of Health of Republic Indonesia)
Table 1 shows that 31.5% (84/267) of the laboratory results were negative for WPV. Slow dispatch of sample, sample collection at home, and sample being taken at the beginning of the outbreak (February-April 2005) were more likely to increase the risk of negative results for WPV. On the other hand, at the peak of the outbreak there was a decrease in negative WPV results. This decrease was also found during high and very high levels of laboratory activity. The results of multivariate analysis show that on-time specimen collection and the period of specimen collection, along with the district of origin of the sample, were the dominant factors associated with negative laboratory results for WPV (Table 2). After controlling for confounding factors (district and period during which the sample was taken), the specimens that were not collected on time had a 70% greater chance of negative laboratory results for WPV. Compared to the District of Lebak, delayed specimen collection coming from the districts of Serang and Sukabumi had a greater probability of negative laboratory results for WPV.
DISCUSSION
There are several limitations in this study, among others: (1) the results of the study does not necessarily reflect the conditions in Indonesia since the data analyzed were only from 3 (three) districts in Java. However, this data represented 59.8% of AFP cases in Indonesia; (2) the study used secondary data from written reports of AFP surveillance activities using report form 1 (FP1), case records in the District Health Office, and the sample registers from the 2 laboratories. This can lead to information bias on the date of AFP onset by the case’s family and the health personnel in charge. To minimize this information bias, the surveillance officers had been retrained at the beginning of the outbreak on how to identify cases of AFP, how to correctly interview the family on the exact date of onset of AFP, how to collect and dispatch the specimens and other factors associated with AFP surveillance; and finally, (3) the condition of the specimen when received was not further analyzed since the data were considered not representative of the field conditions and, except for time, no data were recorded for cold chain facilities.
The prevalence of negative WPV results was 47.3% for delayed specimen collection. The results for Non Polio Enterovirus (NPEV) were below the target of 10% of the cases. This most probably meant that cold chain specimen handling was not properly supervised. NPEV could not be included in the analysis since there were no measurable data to confirm the cold chain facilities.2
When compared with other nonendemic countries experiencing outbreaks of imported type 1 WPV, the interval between the first cases of AFP until laboratory confirmation was relatively rapid in Indonesia (43 days). In other countries, Ghana was faster (24 days) while Guinea had the longest interval (129 days). The duration of the 2005 outbreak in Indonesia was 38 weeks, with a rather long interval of 36 days between confirmation of the first case and outbreak response immunization (ORI). Other countries in Africa and Asia carried out ORI much faster resulting in a low number of cases, although the duration of outbreak did not become shorter.2
Compared to the samples taken during the periods of July-December, February-April had a 2.7-fold higher negative WPLV results. Specimens taken between May-June 2005 had 74% lower negative laboratory results for WPV. The period between February-April was actually critical for finding new cases as early as possible, because before outbreak, a delay in specimen collection presenting negative results can compromise the rapidity of discovering WPV compared to when the virus has spread.
Negative results for the period between February-April was 60%, for May-June 15.5%, and July-December 66.2%. When confirmed with the decision for compatible polio cases, then the majority of negative results was for the period of July-December 2005.11 Since the percentage of negative results was large, the percentage of NPEV results was small (less than 10%), cold chain facilities in the field were inadequate, and the tendency not to follow-up on AFP cases with negative laboratory results, then 60-day follow-up visits should be given to all cases of AFP with negative laboratory results.
Considering the field conditions and the results of the study, efforts should be made to maintain preparedness by holding intensive training on AFP surveillance periodically for field personnel and extended to include monitoring of the area. Observing recommendations by the WHO, surveillance should be integrated into a surveillance system for AFP enabling the detection of silent transmission.12-14 Areas where the risk of infection is high, with immunization coverage of less than 80% and low access to health services, must receive the highest priority.
CONCLUSION
The timing of specimen collection, the period when the stool sample was collected, and the district where the sample originated were dominant factors associated with negative laboratory results for WPV. With the high percentage of negative specimen results and inadequate cold chain facilities in the field, along with the tendency not to follow-up AFP cases with negative specimens, 60-day follow-up visits should also be given to cases of AFP with negative specimen results. In addition, to maintaining preparedness, there should be periodic intensive trainings for field personnel which could be broadened to include field monitoring for observing any silent transmission that occurs.
Aknowledgments
The authors would like to thank the National Polio Laboratories in Bandung and Jakarta for permission to access data and the Health Offices in the districts of Sukabumi, Lebak, and Serang for their assistance in confirming data in the field. We thank especially Dr. Elisabeth Emerson for her intelligent editing.
REFERENCES
1. Directorate General of Communicable Diseases Controls and Environmental Health, Ministry of Health of Republic of Indonesia. Polio: Problems and control (Polio, masalah dan penanggulangannya). Jakarta: The Directorate General; 2005. 2. Directorate General of Communicable Diseases Controls
and Environmental Health, Ministry of Health of Republic of Indonesia – World Health Organization. Acute flacy paralysis Surveillance technical guidance (Petunjuk teknis surveilans AFP untuk petugas surveilans). Jakarta: The Directorate General – WHO; 2002.
3. Imari S. Polio mopping up immunization in West Java, Banten, and Jakarta to control polio at Cidahu Sukabumi (Imunisasi polio massal mopping up di Jawa Barat, Banten dan Jakarta, bersama membebaskan Cidahu Sukabumi dari virus polio). Epidemiol Bulletin. March 2005: 1 – 6. 4. Washington State Department of Health Office of
Epidemiology. Surveillance and reporting guidelines for polio [cited 2006 March 22]. Internet access: Notifiable Condition Polio.
5. Cono J, Alexander LN. Poliomyelitis: vaccine preventable diseases surveillance manual 3rd ed. Atlanta: CDC; 2002.
6. Department of Communicable Disease, Surveillance and Response WHO. Guidelines for the collection of clinical specimens during field investigation of outbreak. Geneva: WHO; 2000. code: WHO /CDS/ CSR/EDC/2000.4. 7. Barros AJD, Hirakata VN. Alternative for logistic
regression in cross-sectional studies: an empirical comparison that directly estimates the prevalence ratio. BMC Medical Research Methodology [serial online]. Oct. 2003 [cited 2006 Aug 1]; 3 (21): [13 p]. Available from: http//www.biomedcentral.com/1471-2288/3/21.
8. Hosmer DW, Lemeshow S. Applied logistic regression. 2nd ed. New York: John Willey & Sons; 2000.
9. StataCorp. Stata statistical software: Release 6.0. Texas: College Station; 2000.
10. CDC. Resurgence of Wild Poliovirus Type 1 Transmission and consequences of importation—21 countries, 2002 - 2005. MMWR February 17, 2006/ 55(06); 145-150. 11. Directorate General of Community Health, Ministry of
Health of Republic of Indonesia. Report of AFP surveillance January 2006. Jakarta: The Directorate General; 2006. 12. WHO/EPI/GEN. Manual for the virological investigation
of polio. Geneva: The Organization; 1997. Code WHO/EPI/GEN/97.01.
13. WHO. Guidelines for environmental surveillance of poliovirus circulation. Geneva: The Organization; 2003.
14. WHO. Laboratory biosafety manual. WHO/ CDC/ CSR/LYO 2003.4 [cited 2006 Feb 3] Available from: