Vol7, No 1, January - March.1998 C hromium supp lementalion 33
Effect
of
chromium
supplementation
on chromium
status,
insulin
and
glucose
level
in Non-insulin
Dependent
Diabetes
Mellitus (NIDDM)
subjects
Murjiah Dinarto*,
Arifin
Suyarcli*,Sarwono
WaspacljiTAbstrak
Telah diteliti pengaruh pemberian kromium pikolinat terhadap status kromium tubuh, insulin serum serta glukosa darah pada 20 pasien DMTTL Subyek dibagi menjadi kelompok perlakuan dan kelompok kontrol masing-masing 10 pasien. Sejumlah 3 pasien gagal menyelesaikan penelitian sehingga jumlah akhir menjadi 17 pasien. Didapatkan
nilai
median kromium serum 0,09 TtglL dengan rentangan 0,07 - 0,48 ptglL. Tidak tlidapatkan perbedaan bermakna untuk status kromium tubuhyang dinyatakan sebagai respons relatif kromium, insulin serum maupun glukosa darah antara kedua kelompok setelah pemberian kromium pikolinat 500 ytglhari selama 4 minggu. Data ini menunjukkan bahwa secara statstik belum lampak pengaruh kromium terhadap status kromium tubuh, insulin serum maupun glukosa darah pada pasien DMTTI.Ahstract
The eftècts olsupplemental Ci1 piç6lip21e on body Cr state, serum insulin and blood sugar in 20 NIDDM subjects was studied. Subjectsweredividedintoatreatmentandcontrol group, l0subjectsforeachgroup. Threesubjectsdroppedoutofthestudy.Median value of Clr serunr was 0,09 pg/L with a range ol 0,01 - 0,48 StglL. There was no significant difference for the body Cr state expressed as relative chromium response, serunr insulin as well as blood sugar between the two groups after supplementation of 500 pgldaily of Cr picolinate tbr 4 weeks. These datas showed that the effect of Cr supplementation on body Cr state, serum insulin and blood sugar in
NIDDM subjects was not statistically signiticant.
Keywords: glucose metabolisnr, insulin potentiator, diabetes mellitus control.
Chromiurn
is an essential elernent in the rnetabolisrnof
carbohydrate.
fat
and proteiu, actiug as an
insulin
potentiator.'-'
Daily
Cr requiremeutdiffers according
to
ase. In
the adult
it
varies
between 50-200
Wgd;ily,5'6 aucl that arnount
lnight not
always
bepresent
in
the
daily
food
consumed. Sorne
factorsmight affect
thebiological activity of
Cr
in
food
sour-cesi.e. whether
it
is
in
theorgauic
or
inorganic
fonn,
theway
foocl is preparecl auclrirelu
.uurporitiou.T'8'9'lÔThe WHO (1996)
stated
that the nonnal level
of
Cr
serurnis
0, 14-0, 15pglL
whereas less than0,14
1t"glL is corniclerecl to be Crdeficient.l0 Chrorniuur
cleficien-cy
iu
hunlan
isstill
hypothetical although
solle
coudi-tions such asglucose intolerauce
and iucreasedinsulin
requireureut
could
be stated asclinical
rlranifestationsof
theconclitiorr.ll
+
Department of Nutririon, Faculry, of Medicine, Universiry
,
of Indonesiu, Jakarla, Indone.sia.I Depar!menl of Internal Medicine, Fuculty ol Medicine, Llniversity of Indonesia I Dr. Cipto Mangunkusumo Nalional.
C entra I C ene ra I H osp i ta I, J a ku rt a, I ndon.es i a.
In
diabetic subiects
theCr
serurnlevel is
6O7o thatof
the nonnal
suËi.cts.l2
Although
rhere
are
still
dif-ferencesin
results, some studies show thebenefit of Cr
suDDlelnentaai"u"t"r.
l5'16 the ageof
401Cr
as an
ind
linked.
The airn
of
this study
is to
detennine whether
Cr
supplemeutation
affects
the
body Cr
state, serurn
in-sulin
audblood
sugarcontrol in NIDDM
subjects.METHODS
Twenty
NIDDM
subjects,
7
females
and 13
males, agedbetween 40-65 years,
with body
massindex of
2I-25
(females)
and 22,5-27 (males),
fair
and
well
controllecl
blood sugar levelsle pariicipatecl
in
thestudy (Table
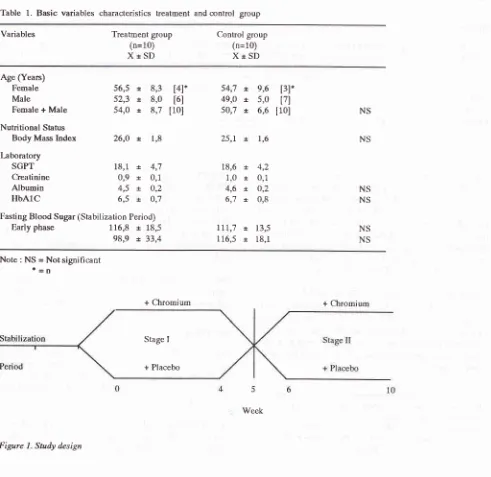
1).After
aninitial
stabilizztion period
of 2 weeks, subjectswere raudomly divided
into
treaturent and
control
34 Dinarto el al.
divided into two
stages,with
a washing period oftwo
weeksin between
(Figure 1).
Thestabilization period
was to prepare subjects so thatcompliance on
dietwith
or
without oral
hypoglycaemic medicine
could
bemaintained throughout
thestudy.
In
the
fint
four
weeks
(First
stage) eachsubject
wasgiven
a capsule
of
Cr
picolinate
500
pgldaily
or
placebo
according to their
group.
After
a two-week
washing
period, another four weeks
(Second stage)
wilh
the same procedure was done after cross changing the groups. [image:2.595.48.539.275.752.2]On
weeks
O, 4, 6and
10fasting and
t
hour
serum Cr,fasting
and
2
hours serum
insulin, blood
sugar level
Table 1. Basic variables characteristics treatment and control group
MedJ Indones
(every 30 minutes
for 2 hours)
after
75gram
glucoseloading were
checked.Cr
serumlevels were
measuredwith
the Neutron
Ac-tivation Analysis
method,2Oserum
insulin
with
theRadio Immunoassay method
andblood
sugarwith
theGlucose Oxydase Peroxydase method (Boehringer
Mannheim).
Cr status was
defined as a relative chromium
responsewhich is
aratio
of
t
hour Cr level
against
fasting
Cr
level2l
-andwhich
till
now could
represent
body
Cr
index.lo
Variables Treatment group
(n=10)
XtSD
Control group (n=10)
XtSI)
Age (Years) Female Male
Female + Male
Nutritional Status Body Mass Index
l:boratory
SGPT Creatinine Albumin
HbAIC
56,5
*
8,352,3
t
8,054,0
t
8,726,0
*.
1,818,1
*
4,70,9
r
0,14,5
t
O,26,5
x,
O,7116,8 t
18,598,9
x, 33,454,7 t 9,6
[3]*49,o x,
5,0
l7l50,7 x,
6,6
[10]25,1. x, 1,6 [4]*
t6l [10]
18,6 t
1,0
t
4,6
x.6,7
*.4,2
0,1
o,2 0,8
13,5 18,1
NS
NS
NS NS NS NS
Fasting Blood Sugar (Stabilization Period)
Early phase
Ill,7
x.116,5 +
Note : NS = Not significant
t=n
+ Chromium + Chromium
Stage I
+ Placebo
Figure 1. Study design
Vol 7, No 7, January - March 1998
Blood
sugar
control
was
expressedâs
"Â
area underthe curve"
which
was the difference
between
area under thecurve
andfasting blood
sugar area.Diet stabilization
compliance
was establishedthrough
quantitative food review
atweek
0 and 6 with the"two
daysrecall"
method, helped by using food modelsfrom
the
Nutrition
Study and Development
Centre,Bogor,
Indonesia
and
a
subsequent
analysis
with
Indonap 2.021 was used.Statistical
analysis was done
at
stage
I,
stageII
and both stageI
andII.
Mean value and student T test were usedfor normal distribution,
where
as rnedian value,Wilcoxon
and
Mann Whitney
testswere
usedfor
ab-normal
distribution.
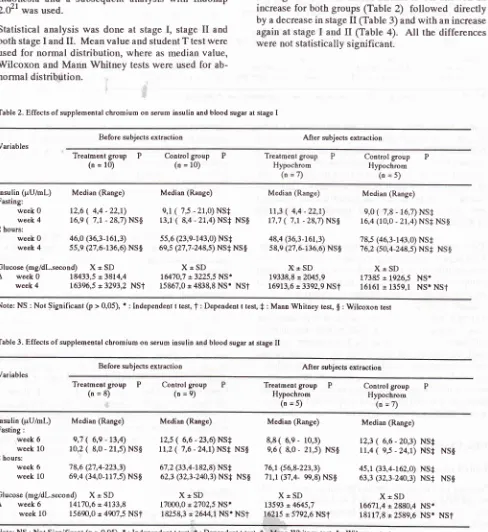
Table 2. Effecls of supplemental chrgmium on serum insulin and blood sugar at stage I
C hrom iu m s upp lement at io n 35
RESULTS
Chromium
serumlevel for all
subjects was 0,09
pgll-with a
range
of
0.01-0.48
pgll-.
There was no
sig-nificant
difference for
therelative chromium
responsebetween
thetreated and
control group
in
stageI
and stage II.Fasting and
2
hours serum
irnulin
levels
showed
anincrease
for
both groups (Table
2)
followed
directly
by
a decreasein
stageII
(Table
3) andwith an
increaseagain
at stageI
andII
(Table
4). All
the differences
were
notstatistically
significant.
Before subjects exaraction After subjects extraction Variables
Treatment
group
P(n = 10)
Control
group
P(o = 10)
Treatmenl
group
PHypochrom
(n=7)
Contro[
group
PHypochrom
(o=s)
lnsulin (pU/mL)
Fasting:
Week 0 week 4 2 hours:
week 0 week 4
Â
week 0 week 4Median (Range)
12,6
(
4,4 -22,r) t6,e ( 7,t - 28,7) NS$46,0 (36,3-161,3) ss,e (27,6-136,6) NS$
r8433,5 =3814,4 163%,5 = 3293,2 NSt
Median (Range)
e,t ( 't,5 - 21,0) NS+ 13,1
(
8,4 - 21,4) NS+ NS$5s,6 (23,e-r43,0) NS+
6e,s (27 ,7 -248,s) NS+ NS $
X*SD
1647O,7 =3225,5 NS*15867,0 * 4838,8
NS'
NSTGlucose (mg/dL.second) X = SD
Median (Range) Median (Range)
tt,3
(
4,4 -22,1)
e,0(
7,8 _ 16,7) NS+17,7
(
7,t
- 28,7)Ns$
16,4 (10,0 - 21,4) NS+ NS$48,4
Q6,3-16t,3)
78,5 (46,3-143,0) NS+ s8,e (27,6-136,6)NS$
16,2 (so,4_248,s) NS+ NS$X+SD
X*SD
19338,8t20/.5,9
tr7385*
1.926,5 NS.16913,6 = 339,9
NSf
16161r 1359,1
NS. NSI Note:NS:NotSignificant(p>0,05),*:Independentttest,T:Dependenittest,+:MannWhitneytest,g:Wilcoxo1resrTable 3. Effects of supplemental chromiuûl on serun insulin and blood sugar at stage II
Before subjecrs extraction Aft er subjects extraction Variables
Treatmeni
group
P(n=8) Control group(n=e) Treatmeot Hypochrom
group
P(n =s)
Control group Hypochrom
(n=7)
Insulin (pU/mL)
Fasting :
week 6
week
l0
2 hours:
week 6
week 10
Median (Range)
e,7
(
6,e -13,4) 10,2(
8,0 - 21,s) NS$'78,6 (2't,4-223,3)
6e,4 (34,0-117,t NS$
Median (Range)
tz,s ( 6,6 - 23,6) NS+
tt,z
(
7 ,6 - 24,1) NS+ NS$67,2 (33,4-182,8) NS+
62,3 (32,3-2û,3) NS+ NS$
XtSD
17000,0 * 2702,5 NSI18258p *2644,1 NS* NST
Median (Range)
8,8( 6,e- 10,3)
e,6
(
8,0- 21,s)
NS$76,1 (56,8-223,3)
'lt,t
(37,4- ee,8) NS$X+SD 13593 x 4645,7 16215 x.5792,6 NSt
Median (Range)
12,3
(
6,6 - 20,3) NS+ 11,4(
e,s - 24,1) NS+ NS$4s,r (33,4-162,0) NS+ 63,3 Q2,3-24O,3) NS+ NS$
X+SD
16671,4
r
2880,4 NS'18117,8 r2589,6 NS* NSI
Glucose (mg/dl.second) X= SD
 week 6 14170,6
-
4133,8week
10
15690,0 = 447,5 NSf [image:3.595.52.540.184.716.2]36 Dinarto et al
Table 4. Effects of supplenrental chromium on serum insulin and blood sugar at stage I and II
MedJ Indones
Before su bjects extraction After subjects extraction Variables
Treatment
group
P(n = 18)
Control
group
P(n = le) teatment Hypochrom
group
P (n =12)Control group Hypochrom
G=12)
lnsulin (pU/mL)
Fasting :
week 0,6 week 4,10
2 hours: week 0,6 week4,10
Median (Range) Lo,zs (4,4 - 22,t)
t3,2
(7,1 - 28,7) NS$58,6 (27,4-223,3) 61,e (27,6-136,6) NS$
Median (Range) e,s (6,6 - 23,6) NS+ tt,4 (7,6 - 24,1) NS+ NS$
56,4 (23,e-182,8) NS+
64,3 Q7,7-248,' NS+ Ns$
Median (Range) e,ss (4,4 - 22,1)
10,0 (7,1 - 28,7) NS$
62,3 Q6,3-223,3)
66,3 (27,6-136,6) NS$
Median (Range)
It,8(
6,6-20,3) t2,e(
e,s -24,1)61,0 Q349-t62,0)
7o,t (32,3-248,5) NS+ NS+ NS$ NS+
NS+ NS$
Glucose(ng/dl.second)
X+SD
X*SD
X=SDÂ week6 16583,3t4389,7
16760,5=2978,9NSt
t69BB,7t44li,S
week
4,10
16713,3 = 4265,2NSt
t6999,'7 = 4039,7 NS+NST
16622,5r
4313,9 NStX*SD
16968,7
r
2485,7 NSI 173A2,5 = 2311,9 NS* NSt Note:NS:NotSignificant(p>0,05),r:lndependentttest,t:Dependentttest,f:MannWhitneytesl,g:WilcoxontesrSome investigators reported that suplemental
Cr
was morebeneficial in NIDDM
subjectswith low
level
of
body
Cr.23'24
With
a cut
off
point
of
O.I4
ltglL
Cr
serum
(WHO,
1996),
an extraction
of
hypochromic
subjects(<0,14 1tglL
Cr serum) was donein
thisstudy
to
see
whether
it
gave the
same
results.
Statistical
analysis
on hypochromic
subjects
from
the
treatmentand
control group
showed
no significant
differences
(Table 2,3,4).
The
same
results were
seen
for
blood
sugar
levels.With
regard
to blood
sugarcontrol,
there was nosig-nificant difference
between the treatment
andcontrol
group
at stageI
(Table
2)
and srageII
(Tabel 3)
evenwhen
thehypochromic
subjectswere
extracted.Overall analysis
for
both
stage
I
and
II
showed
adifferent outcome.
Increase
in
the Â
areaunder
thecurve
which was
seen
in
both groups was directly
followed by a
decreasein
the hypochromic
subjectsfrom
the
treatment group and
an
increase
in
thehypochromic
subjectsof
thecontrol,
eventhough
thiswas
still
not
statistically significant. Above
datas showed that 500 pgCrpicolinate
daily
as asupplemen-tation
for
4weeks
in NIDDM
subjectsdid
notcontrol
seruminsulin
andblood
sugarbetter
thanwithout.
DISCUSSION
Body Chromium
Serum Cr levels
in
this study showed
the same resultsin
NIDDM
patients
as report^edby Morris which
was 6O7oof
thenormal subjects.rz
tn
this study,
theeffect
of
Cr supplementation
onrelative chrornium
response was not seenin
thetreatment group
aswell
ascontrol.
The
very low
serumCr
levels and
thestill
not clearly
known Cr
metabolism made
this fact
difficult
to
ex-plain.
This might
belinked
to the
fact
that
there wasstill
a
very small
number
of
studies done
on
hyper-glycemic and diabetic subjects
in
connection with
body Cr
levels.Serum
Insulin
levels
which
was
statistically
by
Anderson using
500g Cr
r
2 -
4
months
in
60NIDDM
In this study
the changein
seruminsulin
level
2 hours after glucoseloading'was inconsistent although overall
it bas
beenshown
to
be beneficial
to
the
treatment
group. In
stageI
(Table
2)increase
in
serum
irnulin
i.e.,and the
treatment
group:
21(Table 3)
decreaseof
serumgroup
(1
(7Vo). The
com_bined
an
Table 4)
showedthat the
i
14Vo)w,asbiggerthan
the
ertheless,ali
ihe
findings were not statistically
significant.
It
seemsthat the
dosage
of
Cr,
length
of
treatment and
thenumber
of
subject made these results
different from
Anderson's
study.Blood
Glucose
in
rtedan
ectSVol7, No 7, January - March 7998
days.15 Some results
was found by Levine
in
4 outof
l0diabetic
subjectsgiven
L50 Wgldailyfor
4 months.25On
the other hand, other investigators reported
noimprovement in blood
glucose
after Cr
supplementa-,ron.zo'zlIn
this study
theblood
sugarcontrol
showedinconsis-tent
result.
Decreasein
stageI
(Table
2) wasfollowed
by an
increase
in
stageII
(Table
3).
This might
beconnected
in
someway
to theindividual
variety of
thesubjects
especially
wilh
regard totheir
diet.
Thequan-tity
of food
intake between the treatment group in stageI
which
becamethe
control
group
in
stage II showedan
increase
of
carbohydrate
intake
(ÀOEo)although
these
findings
were not
statistically
significant.
Analysis
on
both
stage I and IIwhich
eatlier
showedan
increase
in
the
"A
areaunder the curve"
in
both
groups,
after
extraction was soon
followed
by
a decreasein
thehypochromic
treatment subjects and anincrease in the
hypochromic control
subjects (Table 4).It
seemsthat Cr supplementation
was morebeneficial
to
the
diabetic
subjects
with low
serum
Cr
levels
al-though this was not
statistically significant.
CONCLUSION
After
statistical
analysis,findings in this
study showedthat supplemental
Cr
picolinate 500 pgldaily
for
4weeks
in NIDDM
subjects
doesaffect
serum
insulin
levels
andblood
sugarcontrol.
A
bigger
number
of
subjects
with
a longer
period of
treatment,
using larger
doses
of
Cr
(800-1000
pgldaily) might be
needed
to
determine
this
matter
further.
REFERENCES
1. Pi-Sunyer
FX,
OffenbacherEG.
Chromium. In: Present Knowledge in Nutrition (Olson R.8., ed.) vol. 2,5th ed., The Nutrition Foundation, Washington DC. 1984: 57L-86. 2. Committee oo Diet and Health, Food and Nutrition Board.Trace elements. National Academy of Sciences,Washington
DC. 1989: 381-2.
3. Czajka Narins
DM.
Minerals. In Krause's Food, Nutritionand Diet Therapy (Mahan
LK,
Arlin
MT).
8th ed. W.B.Saunders Company, Philadelphia. L992:
l3I-2.
4. Nielsen FH. Chromium. In Modem Nutrition in Health and Disease.8th ed. Lea & Febiger. AWaverly Company. 1994;
I:264
- 8.5. Anderson
RÀ
Kozlovsky AS. Chromium intake, aborption and exretion of subjects consuming self selected diets. Am J Clin Nutr 1985; 41:ll77-83.
6. National Research Council. Recommended Dietary
Al-lowances. 10th ed. National Academy Press, Washington
DC.1989;241-3.
Chromium
supplementation
377. Schroeder HL. The role of chromium in mammalian
nutri-tion. Am J Clin Nutr 1968;2I:230 - 44.
8. Stoecker BJ. Chromium. In: Present Knowledge in Nutrition
(Brown ML. ed),6th ed. Nutrition Foundation, Washington DC.1990: 287-91.
9. Offenbacher EG, Pi-Sunyer
FX,
Rinko
Cl.
Rapiden-zymahic preheatment of samples be[ore determining
chro-mium in serum or plasma. Clin Chem 1986;32: 1383-6. 10. WHO. Chromium. In: Trace elements io human nutrition and
health. 1996: 155 - 9.
1-1. Solomon NW. Chromium dalam Parenteral Micro-nuhition
(Baumgartner TG, ed). 2nd ed. Fujisawa, USA. 1991: 253 _ 6L.
12. Monis BW, Grifhths
H,
Kemp GJ. Correlations between abnormalitiesin
chromium and glucose metabolismin
a group of diabetics. Clin Chem 1988; 34: 1525-6.13. Jeejeebhoy
KN,
Chu RC, MarlissEB, et al.
Chromium deficiency, glucose intolerance, and neuropathy reversed by chromium supplementation, in a patient receiving long term total parenteral nutrition. Am J Clin Nutr 1977; 30: 531-8. 14. Andersonfu\
PolanskyMM,
BrydenNA,
Canary JJ.Supplemental
cbromium effects
on
glucose, insulin,glucagon and urinary chromium losses in subject consuming
controlled low chromium diets. Am J Clin Nutr
I99l;
I54:
909-16.
15. Glinsmann
WH,
MerE W. Eftect of trivalent chromium onglucose tolerance. In: Metab Clin Exp 1966; 15: 5lO-20.
16. Uusitupa MIJ, Kiempulainen JT, Voutilainen E, et.al. Effect
of oral chroium supplementation
in
glucose tolerance,in-sulin response, and serum lipids
in
non insulin dependentdiabetics. Am J Clin Nutr 1983; 38: 404-10.
17. Waspadji S. Penelitian Diabetes Melitus
-
Suatu tinjauantentang hasil penelitian dan kebutuhan penelitian masa yang
akan datang. Acta Med Indones 1988; XX: 87-98.
18. Oftenbacher EG. Metabolic chromium balances in man. Am
J Clin Nutr 1986;44:77-82.
19. Konsensus Pengelolaan Diabetes
Melitus
di
Indonesia. t993.20. Badan Tenaga Atom Nasional. Pusat Aplikasi Isotop dan
Radiasi Laboratorium
Radiokimia Bidang
Kimia
danBiologi. Analisis Pengaktifan Neutron, Jakarta. 1996.
2L
Liu
VJK, Morris JS. Relative chromium responseas
anindicator
of
chromium status. AmJ
ClinNutr
L978;3L: 972-6.22. Nelson
M.
INDONAP-lndonesian Foods Nuhient Analysis Programme. Version 2.0. Kings College l-ondon. 1995. 23. AbrahamAS,
Brooks
BA,
Eylath
U.
The
effectsof
chromium suplementation on serum glucose and lipids in patients with and without non-insulin dependent diabetes. Metabolism 1992;
4l:
768-7l.
24. Anderson RA. Trace metal supplements lower blood glucose
and improve insulin levels. Asian Medical News, September ed. (abstract). 1996.
25.l,nvine RA,
Stretcbten DHP, Doisy RJ. Effectsof
oralchromium supplementation
on
the glucose toleranceof
elderly human subjects. Merabolism 1968;
l7;
II4-25.
26. Sherman
L,
Glennon JAo Breck WJ. Failureof
trivalent chromium to improve hyperglycaemia in diabetes mellitus. Metabolism 1.968;l7:
439-42.