Determination of the neutron spectrum shape parameter
a
in
k
0
NAA
methodology using covariance analysis
Mauro S. Dias
, Vanderlei Cardoso, Marina F. Koskinas, Ione M. Yamazaki
Instituto de Pesquisas Energe´ticas e Nucleares (IPEN-CNEN/SP), Centro do Reator de Pesquisas-CRPq, Av. Prof. Lineu Prestes 2242, 05508-000-Sao Paulo-SP, Brazil~
a r t i c l e
i n f o
Keywords: k0method Neutron Activation Covariance Uncertainty
a b s t r a c t
Thek0method for quantitative reactor neutron activation analysis (NAA) has been applied in several
laboratories for the determination of multi-elemental concentrations in different materials. The general formula that yields the concentration value can be divided in two parts: one involving detection parameters and the other involving irradiation parameters. A rigorous uncertainty calculation must take into account the correlations between each of these parameters. The Nuclear Metrology Laboratory at IPEN has a research program intended to develop a methodology applying covariance analysis in order to obtain the overall uncertainty in the concentrations of different elements in a given sample, and the correlation between each pair of them. The present paper concentrates in the determination of the neutron spectrum shape factoraby two methods:Cd-coveredandCd-ratio, using experimental data obtained in the IEA-R1 research reactor. The final values forawere: (0.00170.018) and (0.00170.019) for theCd-coveredandCd-ratiomethods, respectively, in good agreement with each other.
&2009 Elsevier Ltd. All rights reserved.
1. Introduction
One of the most widely used methods for measuring multi-element concentrations in different samples is the neutron activation analysis (NAA) (see for instance De Corte, 2000; De Corte and Simonits, 2003). This method can be applied in two different ways: comparing the result with element standards irradiated together with the sample of interest, or by means of the
k0method, as described byDe Corte (2000). In the latter case, the sample is irradiated together with a comparator (usually Au) and from the ratio between the sample and comparator activities, the element concentrations can be derived.
Thek0 method can only be applied if the neutron spectrum shape characteristics are known. In this context, the neutron spectrum shape parameter
a
plays an important role in NAA methodology. Ideally, the epithermal neutron spectrum is de-scribed as a 1/E function, where E is the neutron energy. In practice, distortions can change this behavior but the spectrum can still be described approximately by 1/E1 +a wherea
is the spectrum shape parameter. If the neutron spectrum is shifted to higher energies thena
is negative and inversely if the neutrons tend to be more thermalized thena
becomes positive (De Corte et al., 1984).The
a
parameter determination is based on the response of selected activation nuclei having resonance peaks for neutron capture at different neutron energies in the epithermal region.Three methods have been described in the literature, namely:
Cd-covered multi-monitor,Cd-ratio multi-monitorandBare-irradiation
methods (De Corte, 1987;Dung and Sasajima, 2003). The first two require a smaller number of flux monitors and less effort to obtain the result, whereas the third one requires twice as many monitors. However, the latter method is based on a smaller number of parameters and, in principle, can achieve a lower uncertainty. The present paper is focused on the covariance analysis ofCd-covered
andCd-ratiomethods.
2. Methodology
2.1. Determination of neutron spectrum shape parameter
a
2.1.1. Cd-covered multi-monitor method
In this technique (De Corte, 1984; De Corte, 1987; Dung and Sasajima, 2003) a set of monitors is irradiated under a cadmium cover and the radionuclide activities are measured with an efficiency calibrated HPGe gamma-ray spectrometer. If the neutron capture cross sections of the monitors behave according to 1/
n
law in the thermal region, thena
can be obtained from the slope of the curveYi=a+a
Xiwhere:Xi¼lnEr;i ð1Þ
and
Yi¼ln
ðEr;iÞaðAsp;iÞCd
k0;AuðiÞ
e
p;iFCd;iQ0;iða
Þ Ge;ið2Þ
ARTICLE IN PRESS
Contents lists available atScienceDirect
journal homepage:www.elsevier.com/locate/apradiso
Applied Radiation and Isotopes
0969-8043/$ - see front matter&2009 Elsevier Ltd. All rights reserved. doi:10.1016/j.apradiso.2009.09.065
Corresponding author. Tel.: + 55 11 3133 8822; fax: +55 11 3133 9960.
E-mail address:[email protected] (M.S. Dias).
ARTICLE IN PRESS
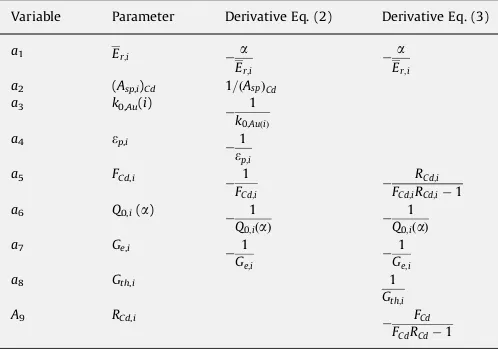
In these expressions, indexirefers to the i-th target nucleus and:Er;i is the average resonance energy; (Asp,i)Cdis the total absorption gamma-ray peak area of the reaction product, corrected for saturation, decay time, cascade summing, geometry, measuring time and mass; k0,Au(i) is the k0 factor for the monitor with respect to Au;
e
p,i is the HPGe peak efficiency for the monitor gamma-ray energy; FCd,iis the Cd transmission factor for epithermal neutrons; Q0,i (a
) is the ratio between the resonance integral and thermal cross section of the target nucleus as a function ofa
and Ge,i is the self-shielding correction factor for epithermal neutrons.Since Yi depends on the shape parameter
a
, an iterative procedure becomes necessary in order to obtain a final value fora
. From Eqs. (1) and (2) correlation between factors involvingQ0,iandEr;ican be observed because both parametersdepend on the same
a
parameter. This effect occurs for the sameYivalue and also for different pairs ofYi. There is another correlation between efficiencies for different gamma lines from the same monitor and for each pair of monitors because all of them were taken from the same calibration curve. An additional correlation exists betweenXiandYi, because both depend on the same value ofEr;i.2.1.2. Cd-ratio multi-monitor method
This technique is similar to the previous one (De Corte, 1984; De Corte, 1987;Dung and Sasajima, 2003), except that two set of monitors are prepared. One is irradiated with a cadmium cover and the other without. The cadmium ratios (RCd,i) are calculated and the value of
a
can be obtained from the curve Yi=a+a
Xi where,Xiis the same as in the previous case and:Yi¼log
ðEr;iÞaGth;i
ðFCd;iRCd;i1Þ Q0;ið
a
Þ Ge;ið3Þ
In this expressionGth,iis the self-shielding correction factor for thermal neutrons.
The correlations observed in the previous case also occur in Eq. (3) except for the case of HPGe efficiency values which are not present because they cancel out when the cadmium ratios are evaluated.
In expressions (2) and (3), the values of the average resonance energy,Q0andk0were taken fromKolotov and De Corte (2002). The values ofGthandGewere calculated on basis of expressions given byMartinho et al. (2003, 2004), respectively, using gamma-ray width (
G
g) and neutron width (G
n) taken fromCullen (2007).2.2. Covariance analysis
From the series expansion of the function Y¼ Yða1;a2;
a3;. . .;anÞ, it can be shown that (Smith, 1991):
s
2Yffi
Xn
n¼1
@Y
@an Xn
l¼1
@Y
@al
/ðana0;nÞðala0;lÞS ð4Þ
The partial derivatives in (4) are calculated ata¼a0, wherea0 is the expectancy value ofa. The parameter/ðana0;nÞðala0;lÞS is called covariance of an with respect to al and usually has a nonzero value. Whenan is independent ofal the covariance is zero. The variance ofan corresponds to the covariance ofan with itself:
s
2n¼covðan;anÞ ¼/ðana0;nÞðana0;nÞS¼varðanÞ ð5Þ
The expression for the covariance ofYbecomes:
s
2Yffi
Xn
n¼1
@Y
@an a¼a0
Xn
l¼1
@Y
@al a¼a0
covðan;alÞ ð6Þ
Using matrix notation, the covariance becomes Vn;l¼covðan; alÞ, and the vector for the partial derivatives, G¼@Y=@anja¼a0.
FunctionGcan be understood as the gradient ofY(a)calculated at pointa0. In this notation, Eq. (6) can be rewritten as:
Vn;l¼GtVG ð7Þ
In order to get vectorG, all variables from functionYshould be considered and the corresponding derivatives are shown in Table 1.
2.3. Determination of the gamma-ray detection efficiency curve
The HPGe gamma-ray efficiency curve has been determined by means of60Co,133Ba,137Cs and152Eu standard sources supplied by the IAEA (International Atomic Energy Agency), in the energy range from 244 and 1408 keV. The distance from the radioactive source to HPGe detector frontface was approximately 17.9 cm for reducing cascade summing corrections. A sigmoidal step function has been applied to the gamma-ray peak in order to subtract the source background, as described byDias et al. (2004).
The detector efficiency curve as a function of the gamma-ray energy has been fitted by means of a third degree polynomial in log–log scale, applying covariance matrix methodology (Smith, 1991). All partial errors involved in each calibration energy as well as their correlations have been considered, namely: peak area statistics, standard activity value, decay correction, geometric correction, dead time, cascade summing correction and gamma emission probability per decay.
2.4. Irradiation process
The selected targets were197Au (0.10% Al alloy),94Zr,64Zn,45Sc and139La (0.47% Al alloy), activated by (n,
g
) reaction. The samples were encapsulated in aluminum and the masses ranged from around 5 (94Zr) to 250 (64Zn) mg.Two irradiations were performed in sequence using two set of samples: one with and the other without Cd cover. The irradiation times were 1 and 2 h, respectively, in a 1.61013cm2s1 thermal neutron flux. The gamma spectrometry was carried out after at least one day and the measurement times ranged from 103 to 2105s.
Table 1
Parameters of functionYand their derivatives.
Variable Parameter Derivative Eq. (2) Derivative Eq. (3)
a1 Er;i a
Er;i
a
Er;i
a2 (Asp,i)Cd 1=ðAspÞCd
a3 k0,Au(i) 1
k0;AuðiÞ
a4 ep,i 1
ep;i
a5 FCd,i 1
FCd;i
RCd;i
FCd;iRCd;i1
a6 Q0,i(a) 1
Q0;iðaÞ
1
Q0;iðaÞ
a7 Ge,i 1
Ge;i
1
Ge;i
a8 Gth,i 1
Gth;i
A9 RCd,i FCd
FCdRCd1
ARTICLE IN PRESS
3. Results
3.1. HPGe efficiency curve
Table 2shows the parameters and corresponding covariance matrix of the polynomial fit in log–log scale, between the HPGe peak efficiency as a function of the gamma-ray energy. The uncertainty in the interpolated values resulted between 0.36 and 0.79%.Fig. 1shows the behavior of the efficiency curve. The error bars are too small to be visible.
3.2. Shape parameter
a
Fig. 2 shows the behavior ofYas a function ofXfor the
Cd-covered multi-monitor method. The curve is almost flat with all
error bar crossing the fitting line, except for46Sc, which is slightly above the others. The resulting value for
a
was (0.00170.018). Fig. 3shows the behavior ofYas a function ofXfor theCd-ratiomulti-monitor method. The same behavior as inFig. 2is observed.
Again46Sc data point is located above the others. The reason for this peculiar behavior is being investigated. The resulting value for
a
in the latter method was (0.00170.019), in excellent agreement with the first method.Table 3 shows the main partial errors involved in the
a
parameter determination for each monitor in both methods. As can be seen the main contribution comes from Q0, k0 and detection efficiency.Tables 4 and 5show theYvalues obtained Table 2
Efficiency parameters and corresponding covariance matrix of the polynomial fitting.
Fitting parameters
Value Covariance matrix
a0 5.984024 1.07091E+ 01
a1 1.901061 5.07090E+ 00 2.40317E+ 00
a2 0.5163550 7.96689E–013.77881E–01 5.94691E–02
a3 0.03019941 4.15337E–02 1.97163E–023.10543E–03 1.62296E–04
w2 1.25
Fig. 1. Behavior of the HPGe peak efficiency curve in log–log scale.
Cd-covered Multi-Monitor Method
22.0 23.0 24.0 25.0 26.0 27.0 28.0
0
Y
X
2 4 6 8 10
Fig. 2.Behavior of parameterYas a function ofXfor theCd-covered multi-monitor method.
Cd-Ratio Multi-Monitor Method
-4.2 -4.0 -3.8 -3.6
0
X
Y
2 4 6 8 10
Fig. 3.Behavior of parameterYas a function ofXfor theCd-ratio multi-monitor method.
Table 3
Main partial errors involved in functionY(in percent).
Monitor Energy (keV) Peak area Q0 k0 RCd HPGe efficiency
198Au 411.8 0.85 1.8 0 0.39 0.46
140La 1596.2 1.09 1.3 1.1 0.44 0.44 46
Sc 1120.5 0.78 1.4 1.2 0.36 0.79
95
Zr 724.2 0.97 3.1 1.3 0.26 0.42
65
Zn 1115.5 0.72 2.5 0.4 0.34 0.36
Table 4
Covariance matrix of functionYobtained by theCd-ratio multi-monitormethod. Monitor X Y UY(%) Correlation matrix
198
Au 1.732 3.851 0.64 1000 95
Zr 8.742 3.898 3.13 0 1000 65
Zn 7.848 3.950 2.60 11 0 1000
140
La 8.543 3.676 1.36 4 0 10 1000
46Sc 4.3307 3.8118 1.41 0 0 1 0 1000
Table 5
Covariance matrix of functionYobtained by theCd-covered multi-monitormethod.
Monitor X Y UY(%) Correlation matrix
198
Au 1.732 25.173 1.63 1000 95Zr 8.742 25.130 2.06 144 1000 65Zn 7.848 25.057 1.92 146 76 1000 140La 8.543 25.317 3.48 211 113 118 1000 46
Sc 4.331 25.181 2.65 276 148 146 216 1000
M.S. Dias et al. / Applied Radiation and Isotopes 68 (2010) 592–595
ARTICLE IN PRESS
from Eqs. (2) and (3), together with their overall uncertainties and corresponding correlation matrixes. For theCd-ratiomethod the correlation matrix is almost diagonal because several factors involved in the activity determination cancel out. These factors include: detection efficiency, geometry, gamma-ray attenuation and gamma-ray probability per decay.
4. Conclusion
A rigorous uncertainty analysis ofk0method must consider all correlations involved in the procedure followed in order to obtain the element concentration. The present paper performed this treatment, taking into account all partial errors involved in the determination of neutron spectrum shape parameter
a
as well as their correlations, by means of two methods, namely:Cd-coveredmulti-monitor method and Cd-ratio multi-monitor method. The
values of
a
obtained by these two methods were (0.00170.018) and (0.00170.019), respectively, showing a very good agreement. All partial errors involved in thea
parameter determination were considered, for each monitor in both methods. The main contribution to the overall uncertainty comes from Q0, k0 and detection efficiency.References
Cullen, D.E., 2007. A Temperature Dependent ENDF/VII Data Cross Section Library. Lawrence Livermore National Laboratory, University of California.
De Corte, F., 2000. k0and comparator NAA: influences and interactions. Journal of Radioanalytical and Nuclear Chemistry 245 (1), 157.
De Corte, F., Jovanovic, S., Simonits, A., Moens, L., Hoste, J., 1984. Determination of the essential flux parameters for (n,g) activation analysis: a new methodology, applied to reactor. Kernenergie-Kerntechnik (Suppl.), 641–647.
De Corte, F., 1987. The k0Standardization Method—a Move to the Optimization of
NAA, Rijksuniversiteit Gent.
De Corte, F., Simonits, A., 2003. Recommended nuclear data for use in the k0 standardization of neutron activation analysis. Atomic Data and Nuclear Data Tables 85, 47.
Dias, M.S., Cardoso, V., Vanin, V.R., Koskinas, M.F., 2004. Combination of nonlinear function and mixing method for fitting HPGe efficiency curve in the 59– 2754 keV energy range. Applied Radiation and Isotopes 60 (5), 683. Dung, H.M., Sasajima, F., 2003. Determination ofaand f for k0-NAA in irradiation
sites with high thermalized neutrons. Journal of Radioanalytical and Nuclear Chemistry 257 (3), 509.
Kolotov, V.P., De Corte, F., 2002. Compilation of k0and Related Data for NAA in the Form of Electronic Database, International Union of Pure and Applied Chemistry. Martinho, E., Salgado, J., Gonc-alves, I.F., 2003. Universal curve of epithermal
neutron self-shielding factor in foils, wires and spheres. Applied Radiation and Isotopes 58, 371.
Martinho, E., Salgado, J., Gonc-alves, I.F., 2004. Universal curve of thermal neutron
self-shielding factor in foils, wires, spheres and cylinders. Journal of Radio-analytical and Nuclear Chemistry 261 (3), 637.
Smith, D.L., 1991. Probability, Statistics, and Data Uncertainties in Nuclear Science and Technology, Series: Neutron Physics and Nuclear Data in Science and Technology, American Nuclear Society.