CONSUMER CONFUSION IN LOW INVOLVEMENT PRODUCTS: AN EMPIRICAL STUDY AMONG UNIVERSITY STUDENTS
IN D.I. YOGYAKARTA
Yessa Gusti Alexander Fandy Tjiptono
International Business Management Program
Faculty of Economics – Universitas Atma Jaya Yogyakarta Jalan Babarsari 43-44
Abstract
Purpose – This paper aims to examine what dimension of confusion that present in low-involvement products in D.I. Yogyakarta.
Research Design - This study replicated a previous study by Leek and Kun (2006) who investigated a research paper of “Consumer Confusion in The Chinese Personal Computer Market”. The survey forms were distributed to 222 student samples. Even though the questionnaires were administered in Bahasa Indonesia, 22 samples cannot be used. Data analysis was used SPSS version 17.
Findings – This paper examines the student samples in D.I. Yogyakarta in three ranges: consumer confusion attributes each product category, consumers’ important source of information and what factor affecting choice of information. This study find that the student samples in D.I Yogyakarta indicated even in low involvement purchase, consumers may experience confusion, consumers feel that similarity confusion is the main problem in their buying decision. This study also finds that male respondents tend to be more struggles with all aspects of consumer confusion rather than female respondents.
Research Implications – This study faces some limitations such as the samples are students and did not represent all students who studies in D.I. Yogyakarta, because the samples were only from ten universities in D.I. Yogyakarta. Some suggestions were listed to support further research.
1.1Background
Nowadays companies are very excited to differentiate their products by offering consumers with various types of products in one product category. Companies believe that by offering many choices to the market, they can have an advantage to compete with their competitors. However, is it really true that this is an advantage for companies and also consumers? For example like toothpaste, in Carrefour or other supermarkets it can be seen that there are lots of brands of toothpaste, for instance Pepsodent, Ciptadent, Close Up, and so on. To be more specific, all of these brands offer various types and benefits for every single type of products such as expert protection, sensitive care, whitening, fresh mint, and gum protection. No wonder that consumers today feel confused about which choice to make.
Some people might say it is good to have many options while others get confused with so many options available. For instance, what if they do not have any problems with their teeth, which one they have to choose: toothpaste with whitening formula, toothpaste with sensitive expert formula or toothpaste with gum protector. Usually companies will not offer all-in-one benefits in one single product, having many options are not always a good things to have, mostly it will make consumers confused.
Consumer confusion itself happens when there is a lot of information and choices available in the market. Kasper et al. (2010) stated that too little information may lead to wrong decisions. However, too much information may also cause problems. According to Mitchell et al. (2005), these are similarity confusion, overload confusion and ambiguity confusion. Walsh et al. (2007) stated that it was a massive number of choices, a surge of marketing communications, decreasing inter-brand differences, increasing complexity of information and its sources. It is no wonder that some consumers find information processing for some tasks are confusing.
When consumers want to buy a new electronic device, car or even a house, consumers tend to search lots of information by looking it on the internet, asking relatives or salesman to get the best advice or suggestion. Consumers search for alternative brands in purpose to reduce their confusion in purchase decision, this phenomenon happens because it is related with high-involvement product.
Boyd et al. (2008) defined high-involvement as one of the consumer decision making types. It happens when a purchase involves goods or services that are psychologically important for buyers and also carry social and psychological risks. It involves a lot of money and therefore financial risk, for example house, car, laptop or any other electronic devices that consumer feels it is important and have to spend lot of money to get it. On the other hand, for a product like toothpaste, shampoo and liquid soap it can be classified as convenience product or to be more specific these types of products are staple products.
Staple product is a type of product that regularly purchase by consumers, considering this type of product was purchase regularly by the consumers, it can be presumed that consumers are less likely to seek for information before making a purchase decision, and the risk to buy the product is very low, so in another word this type of product is a low-involvement product. Boyd et al. (2008) stated that since low-involvement products are not very important to consumers, decisions to buy product are made within the store, either impulsively on the basis of brand familiarity, or as a result of comparisons of the brand on the shelf.
low since it is a staple product that they used or consumed regularly, when consumers bought staple products they tend to use experience or intergenerational influence rather than search a lot of information before making a purchase decision.
By looking on the previous studies, it can be seen that most of them were focused on consumer confusion related with high-involvement product and services. For example, Leek and Kun (2000) chose UK phone market, Thai phone market (2006), and Chinese personal computer market (2006) as their subject of interest. Meanwhile, in services sector, Drummond (2004) focused on consumer confusion especially in higher education sector, and other researchers that focused on life, health and travel insurance. Only some of the researchers that focused on low involvement products such as foods or beverages product, for example Casini et al. (2008) focused on the British wine market.
By taking a consideration that most of the previous researches were talking about high-involvement products, this study will focus on low high-involvement products that the consumers consumed or used in daily basis. Since it was not only high-involvement products that offered various types of products, low-involvement products also provide so many choices that sometimes consumers did not realize that it made them confused when consumers have to make a purchase decisions.
This study aims to find out the existence of consumer confusion in low-involvement products context and to figure it out whether consumers use different strategies to cope with their confusion. Even though in fact consumers tend to be more confused with high-involvement products, there might be a chance that consumers also shared same confusion in low-involvement purchase decisions.
1.2Problem Formulation
Based on the background stated above, this study examines the subject matters of consumer confusion in low-involvement products among university students in D.I. Yogyakarta. The problems of the study can be formulated as follows:
1. What factors cause consumer confusion proneness in the context of low-involvement purchases?
2. How do consumers cope with confusion in the context of low-involvement purchases? 3. Does consumer confusion in the low-involvement purchase differ between male and
female consumers?
Based on the problems mentioned above, the formulation of the problem is what are the dimensions of confusion and confusion reduction strategies of consumers in D. I. Yogyakarta?
1.3Research Objectives
Based on the problem formulation mentioned above, the research objectives that will be done as follow:
1. To examine what dimension of confusion that present in low-involvement products 2. To identify what kind of coping strategies that useful to reducing their level of confusion. 3. To examine whether consumer confusion in the low-involvement context is different
2.1Defining Consumer Confusion
Consumer confusion existed in the market as the result of huge waves of choice and information. Walsh et al. (2007) defined consumer confusion as a huge number of choice, a surge of marketing communications, decreasing inter-brand differences, increasing complexity of information and its sources which increase search costs, it is no wonder that some consumers find information processing for some tasks are confusing. It is not only huge amount of choices that could make consumers confuse, the sources of information could influence consumer confusion.
Italian researchers, Casini et al. (2008) believed that consumers are exposed to an increasing amount of information, traditional mass-media channels, word-of-mouth and promotion strategies tend to stress consumer confusion. Previously, Mitchell et al. (2005) stated that consumers are provided with ever-increasing amounts of information from more products sold through more channels and promoted in more ways, the idea of confusion is becoming increasingly important and has been reported as a problem in many markets such as telecommunications (Turnbull et al. 2000), veal products (West et al., 2002), wine market (Casini et al., 2008) and personal computer market (Leek and Kun, 2006). Mitchell et al. (2004) stated that consumer confusion derived from three main sources:
1. Over-choice of products
They defined over-choice confusion as a lack of understanding caused by the consumers being confronted with too much information or even not enough information and huge number of brands or products that available on the market.
2. Similarity of products
Brand similarity confusion is a lack of understanding and potential alteration of a consumers’ choice or an incorrect brand or products evaluation due to consumers perceived its similarity one to another.
3. Unclarity confusion
They defined unclarity confusion as a lack of understanding during which consumers are forced to re-evaluate and revise current beliefs which may arise from a number of factors such as technological complexity, ambiguous information, conflicting information and incorrect interpretation.
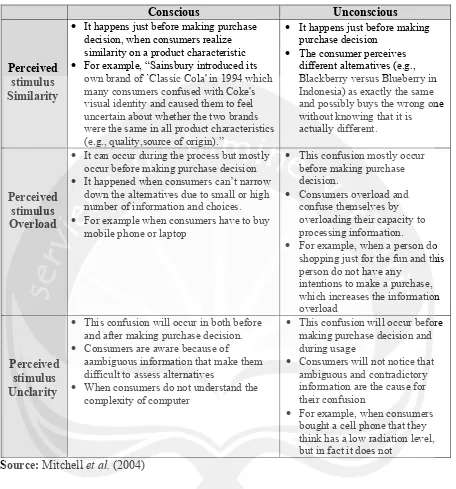
Table 2.1 Conscious and Unconscious Consumer Confusion
Conscious Unconscious
Perceived stimulus Similarity
• It happens just before making purchase decision, when consumers realize similarity on a product characteristic
• For example, “Sainsbury introduced its own brand of `Classic Cola' in 1994 which many consumers confused with Coke's visual identity and caused them to feel uncertain about whether the two brands were the same in all product characteristics (e.g., quality,source of origin).”
• It happens just before making purchase decision
• The consumer perceives different alternatives (e.g., Blackberry versus Blueberry in Indonesia) as exactly the same and possibly buys the wrong one without knowing that it is actually different.
Perceived stimulus Overload
• It can occur during the process but mostly occur before making purchase decision
• It happened when consumers can’t narrow down the alternatives due to small or high number of information and choices.
• For example when consumers have to buy mobile phone or laptop
• This confusion mostly occur before making purchase decision.
• Consumers overload and confuse themselves by overloading their capacity to processing information.
• For example, when a person do shopping just for the fun and this person do not have any
intentions to make a purchase, which increases the information overload
Perceived stimulus Unclarity
• This confusion will occur in both before and after making purchase decision.
• Consumers are aware because of
aambiguous information that make them difficult to assess alternatives
• When consumers do not understand the complexity of computer
• This confusion will occur before making purchase decision and during usage
• Consumers will not notice that ambiguous and contradictory information are the cause for their confusion
• For example, when consumers bought a cell phone that they think has a low radiation level, but in fact it does not
Source: Mitchell et al. (2004)
Table 2.1 discusses about the different between conscious and unconscious consumer confusion in terms of similarity, overload and unclarity confusion. It shows that most of the confusion occurs before consumers made a purchase decision. The way how consumers organize their stimulus or information is very important in here. It seems that when consumers already narrowed down the alternatives that met their criteria, they might not face any types of confusion.
2.2Consumer Confusion and Product Involvement Relationship
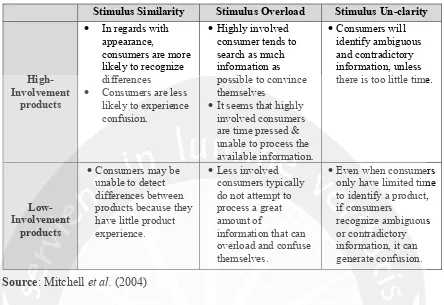
Table 2.2 Consumer Confusions’ Relationship to Involvement
Stimulus Similarity Stimulus Overload Stimulus Un-clarity
High-Involvement
products
• In regards with appearance,
consumers are more likely to recognize differences
• Consumers are less likely to experience confusion.
•Highly involved consumer tends to search as much information as possible to convince themselves
•It seems that highly involved consumers are time pressed & unable to process the available information.
•Consumers will identify ambiguous and contradictory information, unless there is too little time.
Low-Involvement
products
•Consumers may be unable to detect differences between products because they have little product experience.
•Less involved consumers typically do not attempt to process a great amount of
information that can overload and confuse themselves.
•Even when consumers only have limited time to identify a product, if consumers
recognize ambiguous or contradictory information, it can generate confusion.
In high-involvement context, consumers will put greater effort to look for information and alternative products considering the monetary risk they will face. However, according to Mitchell et al. (2004) greater effort is only likely to reduce the incidence of confusion if two conditions hold, namely, 1) that the information is available and comprehensible, and 2) that the consumer has the processing ability to analyze the information. If either of these two conditions are not met, consumers could easily become more confused as they increase the purchase evaluation effort.
On the other hand consumers in low-involvement context will put less effort to look for information and alternatives, especially for daily products, experience, brand familiarity and brand loyalty might be important factors in this case. According to Radder and Huang (2008) especially in low-involvement situations, familiarity has a greater effect on the quality perception of a brand than its physical characteristics.
Next table will show us the differences between high-involvement consumer behavior and low-involvement consumer behavior.
Table 2.3 High-involvement vs. Low-involvement Consumer Behavior No. High-involvement consumer behavior Low-involvement consumer behavior
1. Consumers are information processors. Consumers learn information at random 2. Consumers are information seekers. Consumers are information gathers.
3. Consumers represent an active audience of advertising.
Consumers represent a passive audience of advertising.
4. Consumers evaluate brands before buying. Consumers buy first. If they do evaluate brands, it is done after the purchase.
5. Consumers seek to maximize expected satisfaction. They compare brands to see
[image:6.595.85.537.645.769.2]which provides the most benefits related to their needs and buy based on a multi-attribute comparison of brands.
least likely to give them problems and buy based on a few attributes. Familiarity is the key.
6.
Personality and lifestyle characteristics are related to consumer behavior because the product is closely tied to the person’s self- identity and belief system.
Personality and lifestyle characteristics are not related to consumer behavior because the product is not closely tied to the person’s self-identity and belief system.
7.
Reference groups influence consumer behavior because of the importance of the products to group norms and values.
Reference groups exert little influence on consumer behavior because products are not strongly related to their norms and values. Source: Boyd et al. (2008)
2.3ConfusionReduction Strategies
Coping strategies according to Kasper et al. (2010) refer to the strategies consumers use to avoid the negative effects of confusion. At the core of this concept is the fundamental assumption that consumers are actively responsive to forces that confusion upon them. When confusion reaches an unacceptable level consumers will employ various strategies to reduce or eliminate it. Mitchell and Papavassiliou (1999) proposed a number of generic strategies:
1. Postpone or abandon the purchase. If the level of confusion is too great consumers may
postpone the purchase or abandon it altogether.
2. Clarification of goals. Clarification of goals may lead to a reduction in the consumers’
level of confusion. This is achieved when the consumer narrows down the options available by setting one or more criteria which have to be satisfied.
3. Involve family and friends. Consumers may involve their family or friends to either share
or actually make the purchase decision.
4. Seek additional information. One of the most common strategies for reducing confusion
is for the consumer to seek additional information.
3.1Research Context
Focus on high-involvement products when studying about consumer confusion seems to be dominant on previous research. since people are affected by low involvement product purchases more often and on a wider scale than that of high involvement products, it could be argued that the affects of consumer confusion in such a category would be a reoccurring issue, and therefore worth acknowledging (Alarabi and Gronblad, 2012). Boyd et al. (2006) stated that it is clearly indicate that consumers show different reaction towards decision making process and may be influenced by different psychological, social, and situational factors, depending on their level of involvement with the product or service they are buying.
From the Table 2.3 high-involvement versus low involvement consumer behavior, it can be seen that there are significant differences between this two types of involvement. As seen in low-involvement consumer behavior’s part, consumers are information gathers and learn information randomly, from these first two criteria it can be assumed or predicted what type of confusion might arise.
3.2Population, Sample and Sampling Method
sampling, sampling is drawing conclusion about large groups of consumers by studying small sample of the total population. In other words, a segment of the population selected for research to represent the population as a whole can be called as a sample.
In this research the population is the university student in Yogyakarta that being used to gather the data needed for this research. The sample is university students in D.I. Yogyakarta. The data collection of this paper is from a distribution of questionnaire that the author distributed person by person. At the draft of the research, targeted amount expected of questionnaire distribution is more than 150 samples. Author expecting greater number of respondents will be participated to fill in the questionnaire in purpose to get various samples and a better validity.
The questionnaires were distributed to students at 10 universities in D. I. Yogyakarta. The universities are Universitas Atma Jaya Yogyakarta, Universitas Pembangunan Nasional “Veteran” Yogyakarta, Universitas Gadjah Mada, Universitas Negeri Yogyakarta, Universitas Islam Indonesia, Sekolah Tinggi Ilmu Ekonomi “YKPN”, AA “YKPN”, Institut Seni Indonesia, Universitas Kristen Duta Wacana, and AMPTA. The student samples were approached at the university’s cafeteria and public areas like in front of their classes or in main hall. A token award (a pen) was given to participants who were completed the questionnaires.
3.3Research Method
This study employed a survey method using self-administered questionnaires. This type of questionnaire can be distributed through online or person by person, self-administered questionnaires were used because of its efficiency in collecting data so that the author will know precisely the whole image of the data sample. Besides that, questionnaires can be given or mailed to the respondent personally.
The questionnaire distribution was used convenience sampling which is asked a person that can be seen and met easily to fill the questionnaire, if the participants seem confused with the question listed on the questionnaire, the meaning of the question will be explained directly at that time. Due to the methodology used it is not representative of the general population.
On the form’s first page there is also written the purpose of the study then the description of consumer confusion and low-involvement context. Furthermore, the survey questions are divided into four segments, such as: (1) demographics, (2) general purchase of brand owned or used (3) dimensions of confusion and (4) source of information.
Because the research topic is not so popular among university student which is consumer confusion in low-involvement context, some efforts are needed to gather bigger number of respondents such as explaining to the respondents about the main context of this research and giving the participants a token award (a pen) as their willingness to fill in the questionnaires.
4.1Response Rate
Table 4.4 The Respondents’ Perception of Unclarity, Similarity and Overchoice Confusion (b)
Table 4.1 Response Rate Result
Total questionnaires distributed 222 questionnaires Total of returned questionnaires 222 questionnaires Total of questionnaires being used 200 questionnaires
Response Rate = 200/222 x 100% = 90.09%
4.2Respondents’ Perceptions Toward Confusion
For the first part of the main survey, respondents were asked to state their perception toward three types of confusion (unclarity, similarity and overchoice confusion). There were seven questions for unclarity confusion, three questions for similarity confusion and only one question for over choice confusion.
For unclarity confusion, the average mean ratings for each product categories were 2.94 for liquid soap, 2.98 for toothpaste and 2.98 for shampoo. Meanwhile, the p-values indicated that these means were not significantly different from the cut–off rate of 3.00. If the p-value was >0.05 it means that there were no significant differences between the mean and the cut-off rate 3.00. If the p-value is ≤0.05 it means that there were significant differences between the mean and the cut-off rate 3.00. The values for each product category in unclarity confusion were 0.117 for liquid soap, 0.267 for toothpaste and 0.223 for shampoo, means that statistically there were no significant differences between the mean and cut-off rate 3.00.
It is apparent from the results that similarity confusion is a significant problem for consumers in Yogyakarta as indicated by the average mean rating for liquid soap (2.53), toothpaste (2.60) and shampoo (2.66). Meanwhile, a one-sample t-test was run to determine whether these means was different from cut-off rate of 3.00. The p-values for each product category in similarity confusion were 0.246 for liquid soap, 0.243 for toothpaste and 0.307 for shampoo. It means that statistically there were no significant differences between these means and the cut-off rate 3.00.The high level of similarity confusion happened because consumers perceived that there are no significant advantage difference amongst the manufacturers and especially for liquid soap product category, consumers thought that it was not a big problem which brands of liquid soap they chose since there was no big difference one to another.
Over choice confusion in toiletries product become a problem among consumers. More than half of the respondents (53.5% and 52.5%) for both liquid soap and shampoo agreed that the number of brands and advantages provided by the different manufacturers are very Dimensions of
Consumer Confusion
Liquid Soap Toothpaste Shampoo
Mean
t-test cut off
rate = 3.00 a)
Sig. Level Mean
t-test cut off rate = 3.00 a)
Sig. Level Mean
t-test cut off rate = 3.00 a)
Sig. Level
Unclarity 2.94 0.588 0.117 High 2.98 -0.045 0.267 High 2.98 -0.270 0.223 High
Similarity 2.53 -10.209 0.246 High 2.60 -9.398 0.243 High 2.66 -7.966 0.307 High
Over-choice 2.62 -5.169 0.000 High 2.78 -2.917 0.004 High 2.66 -4.628 0.000 High
Notes: a. If the mean is ≤ 3.00, the degree of confusion will be considered as high,
confusing. For toothpaste product category, 46% of respondents agreed that there are too many products available in the market. Meanwhile, a one-sample t-test was run to determine whether these means was different from cut-off rate of 3.00. The p-values for each product category in similarity confusion were 0.000 for liquid soap, 0.004 for toothpaste and 0.000 for shampoo. It means that statistically there were statistically significant differences between these means and the cut-off rate 3.00.
4.3Confusions Comparison Between Gender
This study used independent sample t-test analysis to find out the existences of consumer confusion among university students in Yogyakarta and comparing the degree of confusion between female and male samples. SPSS software version 17 was used to perform the analysis.
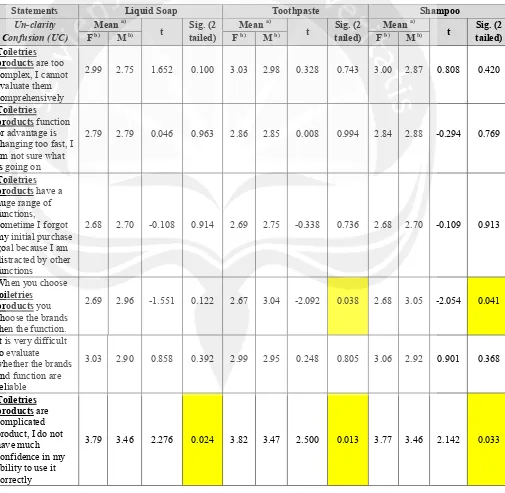
Statements Liquid Soap Toothpaste Shampoo
Un-clarity Confusion (UC)
Mean a)
t Sig. (2 tailed)
Mean a)
t Sig. (2 tailed)
Mean a)
t Sig. (2 tailed) F b) M b) Fb) Mb) F b) M b)
Toiletries products are too complex, I cannot evaluate them comprehensively
2.99 2.75 1.652 0.100 3.03 2.98 0.328 0.743 3.00 2.87 0.808 0.420
Toiletries products function or advantage is changing too fast, I am not sure what is going on
2.79 2.79 0.046 0.963 2.86 2.85 0.008 0.994 2.84 2.88 -0.294 0.769
Toiletries products have a huge range of functions, sometime I forgot my initial purchase goal because I am distracted by other functions
2.68 2.70 -0.108 0.914 2.69 2.75 -0.338 0.736 2.68 2.70 -0.109 0.913
When you choose toiletries
products you choose the brands then the function.
2.69 2.96 -1.551 0.122 2.67 3.04 -2.092 0.038 2.68 3.05 -2.054 0.041
It is very difficult to evaluate whether the brands and function are reliable
3.03 2.90 0.858 0.392 2.99 2.95 0.248 0.805 3.06 2.92 0.901 0.368
Toiletries products are complicated product, I do not have much confidence in my ability to use it correctly
[image:10.595.76.581.279.772.2]3.79 3.46 2.276 0.024 3.82 3.47 2.500 0.013 3.77 3.46 2.142 0.033
The statements on Table 4.5 required the student samples to rate their agreement with every statements stated when they have to buy toiletries products in this case liquid soap, toothpaste and shampoo. The student samples were classified based on gender as shown in Table 4.5. From the Sig. (2 tailed) value it can be concluded that if the value is ≤0.05 it means that there were differences between female and male in terms of confusion level. Meanwhile, if the Sig. (2 tailed) value is >0.05 it means that there were no differences between female and male in terms of confusions’ level.
In terms of unclarity confusion, it can be seen that there were no differences between female and male with Sig. (2 tailed) value for liquid soap (0.445), toothpaste (0.603) and shampoo (0.4400). Meanwhile, from the average mean rating for unclarity confusion it can be seen that male respondents tend to have a little bit higher degree of confusion in terms of liquid soap, their average mean rating were 2.96 for female respondents and 2.92 for male respondents. For shampoo product category male respondents still have a higher degree of unclarity confusion with their average mean rating 2.96 compared with 3.00 for the female There is too much
professional
jargon, I cannot understand it all
2.81 2.89 -0.525 0.600 2.84 2.85 -0.130 0.897 2.78 2.87 -0.611 0.542
Average 2.96 2.92 0.393 0.445 2.98 2.98 0.074 0.603 2.97 2.96 0.111 0.440 Statements Liquid Soap Toothpaste Shampoo
Similarity Confusion (SC)
Mean a)
t Sig. (2 tailed)
Mean a)
t Sig. (2 tailed)
Mean a)
t Sig. (2 tailed) F b) M b) Fb) Mb) F b) M b)
It would not make much difference which brand of toiletries products I chose
3.18 2.77 2.312 0.022 3.32 2.85 2.717 0.007 3.41 2.90 2.839 0.005
There is no significance advantage
difference amongst the manufacturers
3.02 2.65 2.218 0.028 3.20 2.67 3.219 0.002 3.30 2.76 3.146 0.002
Each individual brand has its own image
1.71 1.86 -1.790 0.075 1.73 1.84 -1.316 0.190 1.75 1.87 -1.320 0.188
Average 2.63 2.42 0.913 0.041 2.78 2.45 1.540 0.065 2.82 2.51 2.435 0.065
Overchoice Confusion (OC)
Liquid Soap Toothpaste Shampoo Mean a)
t Sig. (2 tailed)
Mean a)
t Sig. (2 tailed)
Mean a)
t Sig. (2 tailed)
F b) M b) Fb) Mb) F b) Mb)
The number of brands and advantages provided by the different
manufacturers are very confusing
2.74 2.50 1.620 0.105 2.91 2.66 1.644 0.102 2.71 2.60 0.733 0.465
Average 2.74 2.50 1.620 0.105 2.91 2.66 1.644 0.102 2.71 2.60 0.733 0.465
respondents, but in terms of toothpaste product category, both female and male respondents shared exactly the same degree of confusion which is 2.98 in average.
In terms of similarity confusion, it can be seen that there were difference between female and male with Sig. (2 tailed) value for liquid soap (0.041), but for toothpaste (0.066) and shampoo (0.065) there were no significance difference between female and male. Meanwhile, from the average mean rating, male respondents have a higher degree of confusion rather than female respondents, Table 4.4 displays the average mean rating each gender with scale range 1 = strongly agree and 5 = strongly disagree, for liquid soap products the average mean rating for female respondents was 2.63 and for male respondents it was 2.42. The degree of confusion for male respondents was still higher in toothpaste product category with average mean rating 2.45 compared with female respondents which is 2.78. Meanwhile for shampoo product category, male respondents got 2.51 in average and 2.82 in average for female respondents.
Overchoice confusion is the last main source of confusion. With only one statement to measure the degree of consumer confusion it was clearly indicated that male respondents have a higher degree of confusion rather than female respondents. By looking at the average mean rating from each product category it can be seen that in liquid soap product category, male respondents’ average mean rating was 2.50 compared with female respondents which 2.74. For toothpaste product category, male respondents’ average mean rating was 2.66 a little bit higher than female respondents which is 2.91. The result was also similar in shampoo product category, male respondent got 2.60 for their similarity confusion average mean rating and 2.71 for the female respondents. Meanwhile, from the Sig. (2 tailed) value in terms of overchoice confusion, it can be seen that there were no differences between female and male with Sig. (2 tailed) value for liquid soap (0.105), toothpaste (0.102) and shampoo (0.465).
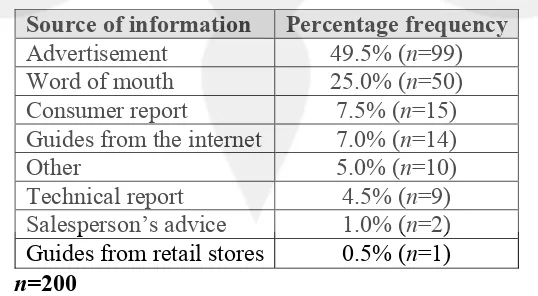
4.4 Source of Information
It can be seen in Table 4.8 that the most popular source of information used by consumers was advertising. For about 49.5% of the respondents or 99 out of 200 respondents stated that advertisement was their main source of information followed by word of mouth with 25% or 50 respondents from 200 respondents in total.
Source of information Percentage frequency
Advertisement 49.5% (n=99)
Word of mouth 25.0% (n=50)
Consumer report 7.5% (n=15)
Guides from the internet 7.0% (n=14)
Other 5.0% (n=10)
Technical report 4.5% (n=9) Salesperson’s advice 1.0% (n=2) Guides from retail stores 0.5% (n=1)
n=200
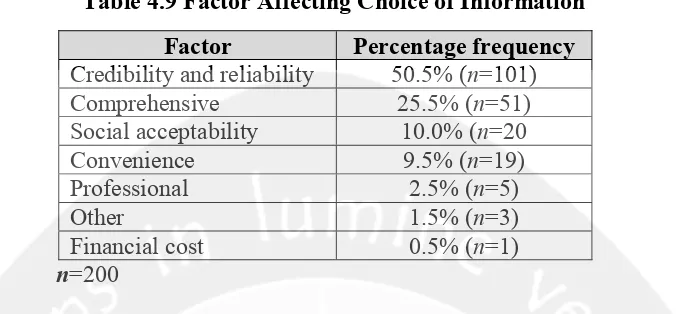
[image:12.595.170.439.559.707.2]Related with the previous discussion about the respondents’ most important source of information, it can be observed in Table 4.9 the factor that affecting choice of information, it can be seen that the majority of the respondents (50.5%) chose their main source of
information because of its credibility and reliability, Leek and Kun (2006) stated that when making a purchase, people want their source of information to be believable and trustworthy.
Factor Percentage frequency Credibility and reliability 50.5% (n=101)
Comprehensive 25.5% (n=51)
Social acceptability 10.0% (n=20
Convenience 9.5% (n=19)
Professional 2.5% (n=5)
Other 1.5% (n=3)
Financial cost 0.5% (n=1)
n=200
The second most important factor when choosing main source of information was due to its comprehensiveness (25.5%). People attracted with source of information that contain useful information that could reduce their confusion or even lack of information about some product categories.
5.1Conclusions
This research found that consumer confusion does not apparent only in a high involvement product purchase even in a low involvement purchase. Consumers may feel confused especially with the similarity of the products. The results of the study of consumer confusion in low-involvement product among university students can be completed as follows:
1. The student samples indicated that unclarity, similarity and overchoice confusion does exist on low-involvement product. It indicated that similarity as the main confusion in this context since there are a lot of brands and advantages available in the market.
2. The student samples indicated that they forgot their initial purchase because they are distracted by other function. It seems that the number of functions offered by manufacturers may become a big problem for consumers instead of advantages since it has the lowest mean rating (the highest degree of confusion) amongst other aspects of unclarity confusion.
3. The student samples indicated that male respondents have a higher degree of confusion rather than female respondents from every dimension of confusion and product categories. It indicates that female respondents have a better experience on these product categories, means that they could cope with confusion better than male.
5.2Research Limitation
The research has numerous flaw concerning about the limitation that happens naturally. Nevertheless, several works were done in this study to minimize the problems. These are the list of limitations that this study encountered:
[image:13.595.137.480.132.289.2]1. The samples are universities students and did not represent all students who studies in Yogyakarta, because the sample were come from 10 universities.
2. The participants’ ages were between 16-30 years old. Different age group might indicate in different results since they have better products experiences.
3. This paper did not ask respondents’ income on the questionnaire, there might be a possibility that income can be a factor that influence purchase decision.
REFERENCES
Alarabi, S., Gronblad, S. (2012). The Effects of Consumer Confusion on Decision Postponement and Brand Loyalty in a Low Involvement Product Category. Uppsala University - Master Thesis. 1-52.
Boyd, H., Walker, O., Mullins, J. (2008). Marketing Management: A Strategic Decision-Making Approach. 6th ed. New York: McGraw-Hill.
Casini, L., Cavicchi, A., Corsi, A. (2008). Trends in the British Wine Market and Consumer Confusion. British Food Journal. 110 (6), 545-558.
Cooper, D., Schindler, P (2011). Business Research Methods. 11th ed. New York: McGraw-Hill.
Drummond, G. (2004). Consumer confusion: Reduction strategies in higher education. The International Journal of Educational Management. 18 (4-5), 317-323.
Greener, S. (2008). Business Research Method. Frederiksberg: Ventus Publishing ApS.
Kasper, H., Bloemer, J., Driessen, P. (2010). Coping With confusion: The Case of the Dutch Mobile Phone Market. Managing Service Quality. 20 (2), 140-160.
Kotler, P., Armstrong, G. (2010). Principles of Marketing. 13th ed. New Jersey: Pearson Education.
Leek, S., Turnbull, P., Ying, G. (2000). Customer Confusion: The Mobile Phone Market. Journal of Marketing Management. 16, 143-163.
Leek, S., Kun, D. (2006). Consumer Confusion in The Chinese Personal Computer Market. Journal of Product & Brand Management. 15 (3), 184-193.
Leek, S., Chansawatkit, S. (2006). Customer Confusion in The Thai Mobile Phone Market. Journal of Consumer Behavior. 5 (6), 518-532.
Mitchell, V., Papavassiliou, V. (1999). Marketing Causes and Implications of Consumer Confusion. Journal of Product & Brand Management. 8 (4), 319-339.
Mitchell, V., Walsh, G., Yamin, M. (2004). Reviewing and Redefining The Concept of Consumer Confusion. 3, 1-54.
Mitchell, V., Walsh, G., Yamin, M. (2005). Towards a Conceptual Model of Consumer Confusion. Advances in Consumer Research. 32, 143-150.
Radder, L., Huang, W. (2008). High-Involvement and Low-Involvement Products A Comparison of Brand Awareness Among Students At A South African University. Journal of Fashion Marketing and Management. 12 (2), 232-243.
Sekaran, U., Bougie, R. (2009). Research Methods for Business. 5th ed. Wiley.
Sproles, G., Kendall, E. (1986). Shorter Papers: A Methodology for Profiling Consumers' Decision-Making Styles. The Journal of Consumer Affairs. 20 (2), 267-278.
Sunyoto, D. (2011). Praktik SPSS untuk Kasus. Yogyakarta: Nuha Medika.
Walsh, G., Thurau, T.H., Mitchell, V. (2007). Consumer Confusion Proneness: Scale Development, Validation, and Application. Journal of Marketing Management. 23 (7-8), 697-721.