NIGHTTIME D-REGION IONOSPHERIC CHARACTERISTIC FROM TWEEK ATMOSPHERIC OBSERVED IN THE MID LATITUDE REGION.
WAN SALWANI BINTI WAN HARUN
This Report Is Submitted in Partial Fulfillment of Requirements for the Bachelor Degree of Electronic Engineering (Telecommunication Electronic)
Faculty of Electronic and Computer Engineering Universiti Teknikal Malaysia Melaka
UNIVERSTI TEKNIKAL MALAYSIA MELAKA
FAKULTI KEJURUTERAAN ELEKTRONIK DAN KEJURUTERAAN KOMPUTER
BORANG PENGESAHAN STATUS LAPORAN
PROJEK SARJANA MUDA II
Tajuk Projek :
NIGHTTIME D-REGION IONOSPHERIC
CHARACTERISTIC FROM TWEEK ATMOSPHERIC OBSERVED IN THE MID LATITUDE REGION Sesi
Pengajian : 1 2 / 1 3
Saya WAN SALWANI BINTI WAN HARUN
mengaku membenarkan Laporan Projek Sarjana Muda ini disimpan di Perpustakaan dengan syarat-syarat kegunaan seperti berikut:
1. Laporan adalah hakmilik Universiti Teknikal Malaysia Melaka.
2. Perpustakaan dibenarkan membuat salinan untuk tujuan pengajian sahaja.
3. Perpustakaan dibenarkan membuat salinan laporan ini sebagai bahan pertukaran antara institusi
pengajian tinggi.
4. Sila tandakan ( √ ) :
SULIT*
*(Mengandungi maklumat yang berdarjah keselamatan atau kepentingan Malaysia seperti yang termaktub di dalam AKTA RAHSIA RASMI 1972)
TERHAD** **(Mengandungi maklumat terhad yang telah ditentukan oleh organisasi/badan di mana penyelidikan dijalankan)
TIDAK TERHAD
Disahkan oleh:
__________________________ ___________________________________
(TANDATANGAN PENULIS) (COP DAN TANDATANGAN PENYELIA)
“I hereby declare that this report is the result of my own work except for quotes as
cited in the reference”
Signature : ………
Author : WAN SALWANI BINTI WAN HARUN
“I hereby declare that I have read this report and in my opinion this report is
sufficient in terms of the scope and quality for the award of Bachelor of Electronic Engineering (Telecommunication) With Honours”
Signature : ………..
Supervisor’s Name : PN. NORBAYAH BINTI YUSOP
ACKNOWLEDGMENT
Alhamdulillah, thanks to Allah S.W.T my Final Year Project (FYP) is completed. I hereby would like to take this opportunity to thank all persons who has involved generously in helping me and assisting me while I was completing the Final Year Project (FYP) which is a compulsory to all Universiti Teknikal Malaysia Melaka (UTeM) students in order to complete our degree.
I would express my deepest gratitude and thanks to my project supervisor, Mrs Norbayah Binti Yusop for her undivided support morally and physically, assistance, guidance, tolerance which proved to be invaluable as completion my Final Year Project (FYP).
ABSTRACT
Tweek atmospheric is an electromagnetic pulse originating from the return stroke of lightning. The signal is propagate by multiply reflection from boundaries of
the natural waveguide formed by the Earth’s surface and the lower boundary of the
ii
ABSTRAK
TABLE OF CONTENT
CHAPTER TITLE PAGE
DECLARATION
ACKNOWLEDGMENT
ABSTRACT i
ABSTRAK ii
TABLE OF CONTENT iii-vi
LIST OF TABLE vii
LIST OF FIGURE viii-x
LIST OF ABBREVIATION x-xi
I INTRODUCTION
1.1 BACKGROUND 1
1.2 PROBLEM STATEMENT 3
1.3 SIGNIFICANCE OF STUDY 3
1.4 OBJECTIVES OF STUDY 4
1.5 SCOPE OF STUDY 4
1.6 CHAPTER ORGANIZATION 5
II LITERATURE REVIEW
iv
2.2 LIGHTNING 7
2.2.1 Types of Lightning Discharge 9 and Lightning Terminology
2.3 THUNDERSTORM 11
2.4 THE IONOSPHERE 12
2.4.1 Layer Of Ionosphere 14 2.4.1.1 D-Region 15 2.4.1.2 E- Region 16
2.4.1.3 F- Region 16
2.5 ELF/VLF EMISSION 17
2.5.1 Radio Atmospheric 19 2.5.1.1 Tweek Atmospheric 20
2.5.1.2 Whistler 21
2.5.1.3 Chorus 22
2.5.1.4 Hiss 23
2.6 MID LATITUDE REGION 24
2.7 SUMMARY 26
III METHODOLOGY
3.1 INTRODUCTION 27
3.2 DATA SOURCE 28
3.2.1 Data Processing Using MATLAB 28 3.2.2 Measurements of Tweek Using 29
Getdata Graph Digitizer
3.3 METHOD 31
3.4 ESTIMATION OF THE D-REGION 32 PARAMETERS
INTERFACE (GUI)
3.5.1 How Graphical User Interface 34 Work
3.5.2 Simulation Using GUI in MATLAB 35
3.6 SUMMARY 38
IV RESULT AND SIMULATION
4.1 INTRODUCTION 39
4.2 ELF/VLF DATA COLLECTION 40 4.3 ANALYSIS OF TWEEK ATMOSPHERIC 41
AT 4 FEBRUARY 2011
4.4 COMPARISON WITH ANOTHER STATION 45
4.4 SUMMARY 46
V CONCLUSION & FUTURE WORK
5.1 Conclusion 47
5.2 Recommendation 49
REFERENCES 50-52
APPENDICES 53-61
A Proses to collect data from VLF STANFORD GROUP
vi
LIST OF TABLES
NO TITLE PAGE
4.1 Characteristic of tweek atmospheric of time, mode number, 41 cut-off frequency (fcm), electron density (ne), reflection
height (h) and propagation distance (d)
viii
LIST OF FIGURES
NO TITLE PAGE
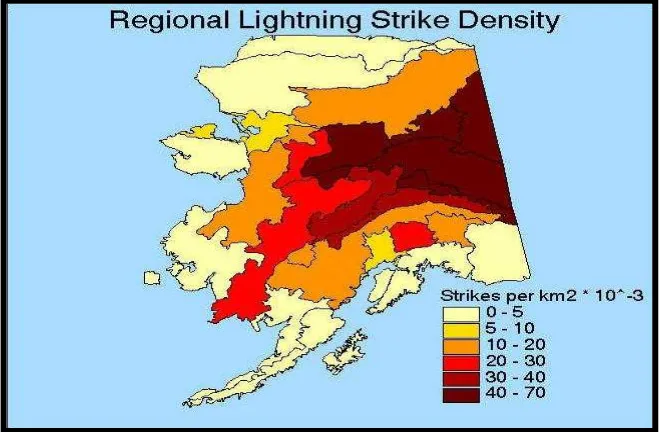
2.1 Region of lightning in Juneau, Alaska (that is lightning strikes 7
per km² (10ˉ³) in the state Alaska)
2.2 Process of lightning (diagram shows the discharge occurs 8 between clouds and the ground lightning CG lightning and
intra cloud IC lightning)
2.3 Type of lightning (Four types can be viewed as effectively 9 transporting cloud charge to the ground and usually termed
cloud to ground discharge referred to as CG).
2.4 Schematic representation of current versus height for three 11 modes of charge transfer to ground in negative lightning
subsequent strokes dart leader return stroke sequence, continuing current and M component
2.5 Layer of Atmosphere 13
2.6 Layer of Ionosphere 14
2.7 ELF/VLF propagation 18
2.8 Tweek atmospheric propagation in EIWG (shape of sferic 21 tweeks vary by ionosphere)
2.9 Spectrogram of tweek atmospheric (this is summation of modes 21 and many cutoff frequencies visible)
Escapes atmosphere propagates to magnetic conjugate point)
2.11 Spectrogram of electromagnetic chorus (The chorus can 23 be seen between 1000 Hz and 3000 Hz sandwiched between
components of sferics and often associated with high geomagnetic and solar activity.
2.12 Spectrogram of electromagnetic hiss (The hiss can be seen 24 between 500 Hz and 4000 Hz sandwiched between components
of sferics and frequency range limited by Earth ionosphere waveguide)
2.13 Meteorologically Significant Latitude Zones 26 3.1 N/S and E/W spectrogram of tweek recorded at 10:35 UT 29
on 09-Feb-2011
3.2 Simulation using GetData Graph Digitizer 30
3.3 Point to capture mode 30
3.4 Flow chart to determine tweek atmospheric 31
3.5 Main page 35
3.6 Analysis of tweek atmospheric 36
3.7 Collection of data two month 36
3.8 Analysis of tweek atmospheric number of mode 37
3.9 Mode Number 37
4.1 N/S and E/W spectrogram of tweek recorded at 05:00 UT 41 on 04-Feb-2011
x
LIST OF ABBREVIATION
WWLLN: World Wide Lightning Location Network QTM: Quasi-transverse magnetic
QTE: Quasi-transverse electric
QTEM: Quasi-transverse electromagnetic TM: Tranverse magnetic
GPS: Global Position System ELF:Extremely low frequency VLF:Very low frequency GUI:Graphical User Interface UTC:Universal time centre IC: Intra cloud
CG: Cloud to ground C:Speed of light f:Frequency
1
CHAPTER I
INTRODUCTION
1.1 BACKGROUND
Lightning usually occurs in conjunction with thunderstorms and is the result of the accumulation of a large electric charge in cumulonimbus clouds. However, stratocumulus and other cloud types can potentially cause lightning such as snowstorms, volcanic emissions or dust storms [1]. When the negative charge in a cloud becomes great enough, it seeks an easy path to the positively charged ground below. The current looks for a good conductor of electricity or a tall structure anchored to the ground such as a tree or a tall building. The negative charge sends out a feeler called a stepped leader that is a series of invisible steps of negative charges. When the stepped leader approaches the ground, positive streamer reaches up for it. A return stroke runs from the ground to the clouds in a spectacular flash.
discharge are called as radio atmospheric or “sferics”. These waves propagate by the process of multiple reflections through the boundaries of the waveguide formed between the ground and the lower region of the ionosphere [3]. This waveguide mode propagation causes an appreciable dispersion near the cutoff frequency of
EIWG around 1.8kHz. This dispersed sferics is known as “tweek atmospheric” [4].
Tweek atmospheric is an electromagnetic pulse originating from the return stroke of lightning. The signal is propagate by multiply reflection from boundaries
of the natural waveguide formed by the Earth’s surface and the lower boundary of
the ionosphere layer with small plasma density (1-100 cmˉ³) [5]. As these waves show dispersion near cutoff, thereby it accurately analyzing first order mode cutoff frequency. The correlation between sferics and the lower ionosphere makes them a useful tool for ionospheric D-region remote sensing.
This study present the nighttime D-region ionosphere characteristic of tweek observed at USA mid latitude ground station of Juneau (58°23’00’’N,
134°11’00’’W). The electromagnetic propagation model is used in order to study the nighttime variation of tweek in this region. Tweek also have been utilized to estimate the nighttime D-region ionosphere reflection height, equivalent density and the distance travel by the signal in EIWG.
3
1.2 PROBLEM STATEMENT
The characteristics of D-region ionosphere using tweek atmospheric have been investigate by a number of authors (Ohtsu, 1960,Yano et al ,1989,1991, Hyakawaet al, 1994,1995, Sukhorukov, 1996, Farenez et al 2007, Reznikov et al 1993, Ohya et al, 2003) state that the altitude of the D-region ionosphere is too low for satellite measurements of electron density and too high for balloon measurements. Therefore, a make the rocket has been used but the timing of flights restricts rocket experiments. Grounded based active experiments using ionosondes and incoherent scatter radars in the HF-VFF range can be conducted at any time, but these method cannot received ionospheric enchoes due to the low electron densities about <10³ el/cm³ in the D-region ionosphere.
The measurement of the D-Region is facing a difficult problem from the point of height typically about 60km during the daytime and increase to about 95km during the nighttime. Previous measurement, they are using radar to measure an electron density of D-region but the facility to build is quite expensive and it is require high cost of regular operations for active radio measurement. Therefore, it is important to have a measurement that is lower in cost and capable to the signal to propagate in very wider area.
1.3 SIGNIFICANCE OF STUDY
The significance of this project is these signal can penetrate into seawater that has led to their use over the past several decades for communication with submerged submarines at long distances. Besides that, it also can be used for worldwide communications since the signals are guided between the Earth and the lower ionosphere and can send the signals around the planet. Then, Lightning geolocation is a lightning detection network capable of locating lightning flashes on a global scale with an accuracy usually associated with dense medium-range networks.
thereby, inferring communications outages. For instance, we can monitor ionospheric communication outages from gamma ray bursts from outer space. In addition, significance of tweek atmospheric also to use for satellite protection it is ELF/VLF waves from lightning has been shown to be a key driver of the removal of these trapped particles by propagating as a `whistler' wave through the magnetosphere and the Stanford ELF/VLF. Lastly, it also used for Subterranean mapping ELF/VLF waves may in fact be the most reliable means of subterranean mapping or detecting underground structures.
1.4 OBJECTIVES OF STUDY
The main goal of this project is to study characteristic of D-region ionosphere at mid latitude region of Juneau. This project goal is supported by the following objectives:
1. To estimate the nighttime D-region Ionospheric reflection height (h), equivalent electron density (ne) at reflection height and propagation distance (d) propagated by the tweeks in the EIWG.
2. To compare the characteristic of tweek between different stations in low and mid latitude region.
3. To develop Graphical User Interface (GUI) in MATLAB.
1.5 SCOPE OF STUDY
5
nighttime because of lower attenuation. Lastly, results will be interpreted using Graphical User Interface (GUI) in MATLAB.
1.6 CHAPTER ORGANIZATION
This report is organized into five chapters. All the summary of each chapter are describe as following.
Chapter 1: This chapter will give an overview about the project include the project background, problem statement, significant of study, objectives and scope of project. This chapter will explain briefly about the background of this project.
Chapter 2: This chapter is described about the previous studies, researches and readings process that have been carried out. To supported and understand the literature review of the project.
Chapter 3: This chapter discusses about the methods of investigations, methodology, analysis process and focuses on the designing the system through the methods selection from Chapter 2. This chapter also explains about the method used to analyze the result and provides a technique used to develop Graphical User Interface (GUI) in MATLAB
Chapter 4: This chapter is about result and discussion. This section will explain about the finding of this project and analysis of result.
CHAPTER II
LITERATURE REVIEW
2.1 INTRODUCTION
This chapter is described about the previous studies, research and readings process that have been carried out. It also describes the lightning activity occur in Juneau, Alaska. Thunderstorm and lightning are rare in Southeast Alaska when compared with the Alaska Interior and most of the lower 48. It usually observed along the Outer Coast as strong cold fronts move in form the Gulf of Alaska. Interestingly these storms can occur during the winter month as well as during summer. On some occasions, thunderstorms can develop or spread over the Inner Channel of a Panhandle. The last time this occurred was in June of 2000 when an outbreak of scattered thunderstorms moved through the Juneau area.
7
[image:24.595.155.485.134.350.2]February and early March. The most active thunderstorm area in Alaska based on cloud to ground lightning strikes is the White Mountains north of Fairbanks.
Figure 2.1: Region of lightning in Juneau, Alaska (that is lightning strikes per km²
(10ˉ³) in the state Alaska)
source [8]