Cluster analysis of typhoid cases in Kota Bharu, Kelantan, Malaysia
Nazarudin Saian1, Shamsul Azhar Shah1, Shaharudin Idrus2, Wan Mansor Hamzah3
Abstrak
Demam typhoid masih merupakan masalah kesehatan masyarakat yang utama sedunia, demikian juga di Malaysia. Penelitian ini dilakukan untuk mengidentiikasi spatial epidemiology dari demam typhoid di Daerah Kota Bharu, dan digunakan sebagai langkah awal untuk mengembangkan analisa lebih lanjut pada negara secara keseluruhan. Karakteristik utama dari pola epidemiologi yang diminati adalah apakah kasus typhoid terjadi dalam kelompok, ataukah mereka tersebar hingga semua area. Kami juga ingin mengetahui pada jarak berapa mereka terkelompok. Semua kasus yang terbukti typhoid yang dilaporkan oleh Departemen Kesehatan Daerah Kota Bharu dari tahun 2001 sampai Juni 2005 diambil sebagai sampel. Berdasarkan alamat tempat tinggal penderita, lokasi rumah dilacak dan sebagai titik koordinat dalam penggunaan alat GPS. Analisis Statistik Spatial digunakan untuk mengetahui penyebaran kasus tifoid apakah berkelompok, acak, atau menyebar. Analisis statistik spatial menggunakan program CrimeStat III untuk mengetahui apakah kasus typhoid terjadi dalam kelompok dan kemudian untuk mengetahui pada jarak berapa kasus tersebut terkelompok. Dari 736 kasus dalam penelitian ini menunjukkan adanya pengelompokan yang signiikan pada kasus yang terjadi pada tahun 2001, 2002, 2003 dan 2005. Pengelompokan typhoid juga terjadi pada jarak hingga 6 km.Penelitian ini menunjukkan bahwa kasus typhoid terjadi pada kelompok dan metode ini dapat diterapkan untuk menggambarkan epidemiologi spatial untuk area yang khusus. (Med J Indones 2008; 17: 175-82)
Abstract
Typhoid fever is still a major public health problem globally as well as in Malaysia. This study was done to identify the spatial epidemiology of typhoid fever in the Kota Bharu District of Malaysia as a irst step to developing more advanced analysis of the whole country. The main characteristic of the epidemiological pattern that interested us was whether typhoid cases occurred in clusters or whether they were evenly distributed throughout the area. We also wanted to know at what spatial distances they were clustered. All conirmed typhoid cases that were reported to the Kota Bharu District Health Department from the year 2001 to June of 2005 were taken as the samples. From the home address of the cases, the location of the house was traced and a coordinate was taken using handheld GPS devices. Spatial statistical analysis was done to determine the distribution of typhoid cases, whether clustered, random or dispersed. The spatial statistical analysis was done using CrimeStat III software to determine whether typhoid cases occur in clusters, and later on to determine at what distances it clustered. From 736 cases involved in the study there was signiicant clustering for cases occurring in the years 2001, 2002, 2003 and 2005. There was no signiicant clustering in year 2004. Typhoid clustering also occurred strongly for distances up to 6 km. This study shows that typhoid cases occur in clusters, and this method could be applicable to describe spatial epidemiology for a speciic area. (Med J Indones 2008; 17: 175-82)
Keywords: typhoid, clustering, spatial epidemiology, GIS
Typhoid fever is still a major public health problem globally.1,2 In the year 2000, cases of typhoid were estimated to be more than 21 million and caused 216 510 deaths.3 Typhoid fever is still endemic in Malaysia and periodically it gives rise to outbreaks. There was a
1 Department of Community Health, Faculty of Medicine, Universiti Kebangsaan Malaysia, Kuala Lumpur, Malaysia 2 Institute for Environmental and Development, Universiti
Kebangsaan Malaysia, Kuala Lumpur, Malaysia
3 Disease Control Division, Ministry of Health, Malaysia
range of 695 to 850 reported cases a year from 1997 to 2001.4 Incidence of typhoid fever in Malaysia is around 10.9 per 100 000 population per year but in Kelantan it can reach up to 50 per 100,000.5 In the year 2005, one major outbreak occurred in Kelantan, especially in the Kota Bharu district, that caught the attention of the mass media and the public.
is a food and water-borne bacillus. Infection results from ingestion of food and water that is contaminated with the bacteria. Contamination is achieved by fecal materials of either a typhoid patient or of a healthy, asymptomatic carrier.
Typhoid fever is transmitted via the fecal oral route, that is from the faeces of the patient or carrier to the mouth of the susceptible person by the ingestion of contaminated of food or water or by dirty hands. Foods may become vehicles of typhoid transmission in the following ways: the use of fresh “night soil” as fertilizer for vegetables; the use of contaminated water in cold drinks and in the preparation of foods such as fruits and vegetables; or ready to eat foods contaminated by storage in contaminated containers or by sprinkling with contaminated water. In Malaysia typhoid is still endemic5 but the outbreak usually occurs in one part of the country, such as the state of Kelantan located in the northern part of Peninsular Malaysia. This study will try to understand the spatial pattern of typhoid cases in that state by choosing one of the administrative districts as a sample. Because of the nature of spatial data the geographical information system (GIS) was utilised in this study. The objective of this study was to identify the spatial epidemiology of typhoid fever in the district of Kota Bharu from the year 2001 to 2005. The main characteristic of the epidemiological pattern that we were interested in was whether typhoid cases occurred in clusters or were evenly distributed throughout the area. We also wanted to know at what spatial distances they were clustered.
METHODS
Study area
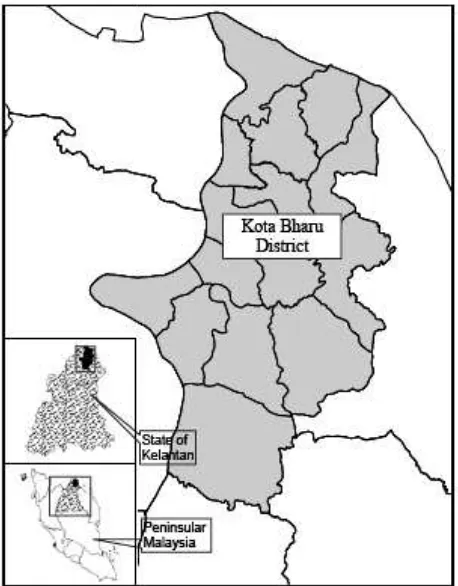
This study was done in the district of Kota Bharu, one of 10 administrative districts in state of Kelantan that is situated in the north eastern part of Peninsular Malaysia. The district of Kota Bharu was then divided into 15 sub districts with total population of 398, 835.7 The 15 sub districts are Kota Bharu, Panji, Lundang, Kemumin, Kota, Badang, Limbat, Sering, Pendek, Banggu, Pangkal Kalong, Kadok, Peringat, Salor and Beta. The total area of the district is 399.881 km square. In terms of racial distribution, the majority of the population in Kelantan are Malays, comprising 92.6% of total population, compared to 5.35% Chinese and 0.33% Indian. Kelantan was chosen because typhoid cases occur almost throughout the year and it has the
highest incidence of typhoid cases in Malaysia. During the year 2005 outbreak, the district of Kota Bharu had the highest number of cases.8
Figure 1. Map showing the study area
Study design and data collection
All conirmed typhoid cases that were reported to the Kota Bharu District Health Department from the year 2001 to June 2005 were taken as the samples. From the home address of the cases, the location of the house was traced and a coordinate was taken using handheld GPS devices. The coordinate format that was used in the study was Rectiied Skew Orthomorphic (RSO) format because that was the format of the base map available.
Data analysis
statistical analysis, the analysis was done using CrimeStat III software9 and later displayed in ArcView® 9.1 software. There were three phases of the analysis. Initially the general tendency of occurrence of cases was analysed using average near neighbourhood method for each year. General clustering would detect the overall tendency of typhoid cases as random, clustered or dispersed. Then analysis was done to determine at what spatial distance the typhoid clusters occurred, using Ripley’s K function analysis. In the third phase, the hot spot area was identiied using the nearest neighbour hierarchical spatial clustering method.
Nearest neighbourhood analysis
The Nearest neighbourhood method will calculate the ratio between the observed average distance of the cases to the nearest neighbour and the expected average distance of that case if all the cases are distributed randomly. The ratio is called the Nearest Neighbourhood Index. If the ratio is less than 1 then the observed distribution is considered clustered. If the ratio is larger than 1 then the observed distribution is dispersed. If the ratio is equal to 1 then the observed distribution is random.
Ripley’s K-function Analysis
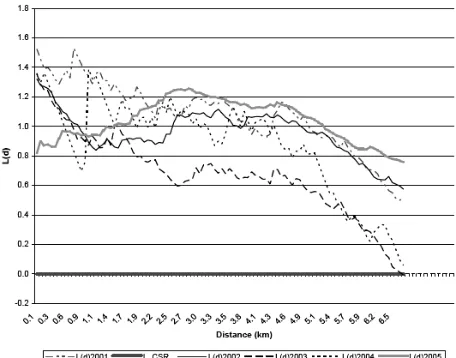
The nearest neighbour index is an analysis for irst order spatial randomness. For Ripley’s K function it is called a ‘super-order’ nearest neighbour statistic because it provides a test of randomness for every distance from the smallest up to some speciied limit area.10 It is designed to measure local clustering, compared to NNI that measures general clustering. Hence it can used to analyse at what spatial distance the distribution of cases clustered. It is also can be used to compare the observed distribution to other distributions, such as which distributions were more clustered than others. In this study, the K function was calculated using CrimeStat III software. For easier interpretation the K value was transformed using the CrimeStat III software into L(d) function and plotted as a graph.
To determine the signiicant level of the function, the L(ds) function was compared to a conidence limit for random distribution created using Monte Carlo simulations. When the observed L(ds) exceeds the upper conidence limit that was calculated, it indicates a signiicant clustering.9
Nearest neighbour hierarchical spatial clustering method
The ‘hot spot’ method in cluster analysis is a method that identiies groups of incidents or cases that are clustered together. For hot spot analysis the method used in this study was the nearest neighbour hierarchical spatial clustering method in CrimeStat III. It uses the distance between each case and its nearest neighbour and identiies which of the cases is spatially close. It identiies clusters that were put together on the basis of certain criteria. One of the criteria was a threshold distance; that is, a distance that identiies if any case is close enough to its neighbour to become a cluster. The threshold distance can be determined randomly by adjusting the probability level for selecting any two points (a pair) on the basis of a chance in t distribution. For example, if the cases were randomly distributed, data and p value was taken as <0.05 level (in t distribution), then only about 5% of the pairs would be closer than the threshold distance. Only points that are closer to one or more other points than the threshold distance are selected for clustering. Other criteria would be a minimum number of points that are close enough to be included as a cluster. If any of the cases (represented as a point) satisfy both criteria, they would be included as a cluster at the irst level or a irst order cluster. This test is called hierarchical because it seeks the next hierarchy of cluster by clustering the irst order cluster that is close enough to become the next level of cluster.
RESULTS
General indings
Spatial statistical analysis
General clustering
The nearest neighbourhood index was used to determine the general distribution of cases, either clustered or dispersed. There were signiicant indings for the years 2001, 2002, 2003 and 2005. Since the nearest neighbourhood index was signiicantly below one, the distribution of typhoid cases in Kota Bharu District was clustered.
Table 1. Nearest neighbourhood index for each year
Year r ratio z value p value
2001 0.602 10.131 <0.01
2002 0.283 29.6835 <0.01
2003 0.479 15.081 <0.01
2004 0.882 1.86389 0.062
2005 0.319 42.4215 <0.01
Ripley’s K function
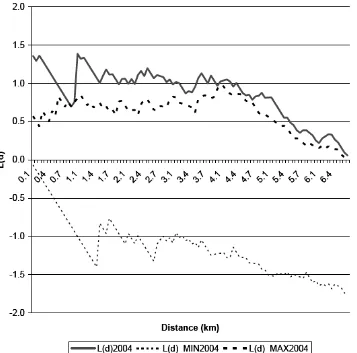
Figure 2 shows that typhoid clustering occurs strongly for distances up to 6 km, after which the L(d) pattern starts to go down, nearing the L_CSR line. Although for the year 2004 no general clustering was found by using the nearest neighbourhood index, signiicant indings for clustering was present when using K function analysis. However, the signiicance was only up to 1 km radius only, because at that spatial distance it crosses over the conidence limit of random distribution according to Monte Carlo simulation.
Where L(d)_MIN and L(d)_MAX was a curve for the conidence limit for random distribution.
Hence from this study, we found out that typhoid tends to occur in clusters and the distance at which they cluster is within 6 km.
Hot Spot clustering
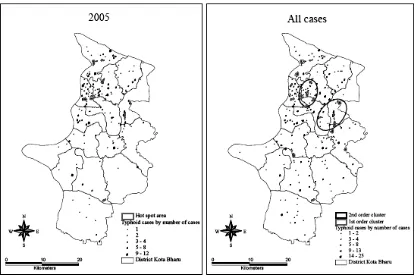
The ‘Nearest neighbour hierarchical spatial clustering’ method for each year was used to detect hot spot areas. From this study, clusters (hot spot areas) have been identiied in 2002, 2003 and 2005. There were 2 hot spot areas found in 2002, one in 2003 and 8 in 2005 (Figure 4 and Figure 5). When all the cases were combined and the analysis applied, seventeen 1st order clusters and two 2nd order clusters were found (Figure 5). These indings imply that typhoid cases usually occurred in clusters especially during the outbreak.
Figure 4. Hot spot clusters for year 2002 and 2003
DISCUSSION
Generally only 736 cases (86.1%) had coordinates and were involved in the analysis using geo-referenced data. The main reason of failure to trace addresses was incompleteness of the addresses given by the notiication list. Another possible reason would be that some areas were remote and dificult to access by road. This problem could be eliminated if GIS had been used as a tool in the case investigation, when all the cases would have been given a speciic coordinate. A patient’s house has been used as a reference because typhoid cases are usually transmitted from the chronic carrier and a majority of the transmissions usually occur at home. Most of the exposures also occur at home because that is where people spend most of their time. This does not mean that people cannot get infected outside their houses, but this reference has to be made because for more precise and detailed investigation more details and precise data has to be available and that detailed information was not available for this study.
In this study it was shown that typhoid cases usually occur in clusters. This was expected because with infectious diseases, each case that occurs usually occurs near other cases because the causative agent would be present in the surrounding area. This fact is especially important for typhoid cases because the majority of them are transmitted by contamination of food or drinking water by a chronic carrier. Hence identiication of a disease cluster is important because all cases in the cluster might be related to the same carrier, and a more detailed investigation could be done to identify the sources. One important aspect of spatial clustering is at what distance a cluster occurs and where it happens. This is important because during investigation of typhoid cases, especially during the outbreak, resources have to be used optimally and identiication of where and at what distance it usually occurs can be helpful. From analysis of the K function in this study we found out that typhoid cases clustered strongly up to a distance of 6 km. This inding was important because the investigation of typhoid cases could be concentrated within a 6 km radius of any case, either for active case detection or for carrier detection study. Even identifying the location of a hot spot area could make the investigation and study of typhoid cases more eficient.
The technique of cluster detection was successfully used previously mainly in crime analysis, as shown
by Block and Block10 and Craglia et al.11 But since the occurrence of infectious disease is also dependent on the spatial factor, this technique can be used to study the spatial pattern of diseases, whether infectious or non infectious. This technique has been used, for example, to study local clustering of breast, lung and colorectal cancer in New York.12 For infectious diseases, cluster analysis has been done, for example, by Odoi et al13 and Brooker et al.14 For an infectious disease outbreak the clustering analysis has been used by Lai et al15 during the SARS outbreak in Hong Kong. Hence this cluster analysis is not a new approach to infectious diseases. This study provides more evidence and examples for this type of analysis to help in understanding the distribution of diseases. Even for typhoid, the spatial pattern analysis has been done by Hinman et al16 to study the pattern of typhoid distribution in Washington, DC. Hinman et al16 concluded from the research that clustering occurred at multiple spatial scales and refuted the original study that concluded that typhoid was evenly distributed. Hinman et al16 also said that cluster analysis of the disease provides new insight into the pattern of typhoid outbreaks. As shown in this study, the signiicant clustering occurs in year 2001 to 2005 except in year 2004. The inding was not signiicant in 2004 most likely due to the limitation of the analysis used in this study. For each of the analysis method there will be some limitation that will depend on the method of calculation used in each analysis. For the nearest neighbourhood index, the form and boundaries of the area analysed could affect the result. If the studied area is long and narrow, the expected distance would be smaller and this could make the result more likely to become a cluster. The nearest neighbourhood index is also inluenced by cases located in the same place and very close to each other. If many cases were like that, the mean distance would become smaller and could affect the result. This limitation was removed under K function analysis because it counted using all the distance relevant in the study area, thus limiting the inluence of cases that occur in the same place.
In conclusion, spatial statistical analysis shows that typhoid cases occur in clusters, especially during the outbreak in 2005. The method used in this study was useful in identifying the cluster of typhoid cases and also in determining at what spatial distance the cluster occurs. It could also be used to identify the hot spot area, the area where most likely the clusters had occurred.
Acknowledgement
This research received funding from the National University of Malaysia Post Graduate Research Grant. The author would like to thank the Kelantan State Health Department for permission and providing data to carry out this study.
REFERENCES
Pang T, Levine MM, Ivanof B, Wain J, Finlay B. Typhoid 1.
fever – important issues still remain. Trend in Microbiology.
1998;64:131-3.
House D, Bishop A, Parry C, et al. Typhoid fever: 2.
pathogenesis and disease. Current opinion in infectious
disease. 2001;14:573-8.
Crump JA. Luby SP. Mintz ED. The global burden of typhoid 3.
fever. Bulletin World Health Organization. 2004;82:346-53. Ministry of Health Malaysia. Speciic health indicator. 4.
2005. Available from URL: www.moh.gov.my [Cited 2005 January 17]
Yap YF. Puthucheary SD. Typhoid fever in children-a 5.
retrospective study of 54 cases from Malaysia. Singapore Med J. 1998;6:260-2.
Parkhill J, Dougan G, James D. Complete genome sequence 6.
of a multiple drug resistant Salmonella enterica serovar
Typhi CT18. Nature. 2001;413:848-52.
Statistic Department. Census 2000 Result. 2000. Kuala 7.
Lumpur: Malaysia.
Kelantan State Health Department. Typhoid Outbreak 8.
Report. Kelantan. The Department. 2006..
Levine N. CrimeStat III: A Spatial statistics program for 9.
the analysis of crime incident locations. 2004.[Computer Program]
Block R, Block CR.Space, place and crime: Hot spot areas 10.
and hot places of liquor-related crime. In: Eck J, Weisburd D, editors. Crime and place New York: Criminal Justice Press; 1995;145-83.
Craglia M, Haining R, Wiles P. A comparative evaluation of 11.
approaches to urban crime pattern analysis. Urban Studies. 2000;37:711-29.
Jacuez G, Greiling DA. Local clustering in breast, lung and 12.
colorectal cancer in Long Island, New York. International J Health Geographics. 2003;2:3. [Cited 2005 January 15]. Available from http://www.ij-healthgeographics. com/ content/2/1/3
Odoi A, Martin SW, Michel P, et al. Investigation of 13.
clusters of giardiasis using GIS and a spatial scan statistics. International J Health Geographics. 2004;3:11. [Cited 2005 January 15]. Available from http://www.ij-healthgeographics.com/content/3/1/11.
Brooker S, Clarke S, Njagi JK, et al. Spatial clustering of 14.
malaria and associated risk factors during an epidemic in a highland area of western Kenya. Trop Med International Health. 2004; 9: 757–66.
Lai PC, Wong CM. Hedley AJ, et al. Understanding the 15.
spatial clustering of severe acute respiratory syndrome (SARS) in Hong Kong. Env Health Perspect. 2004; 112:1550-6.
Hinman S, Blackburn JK, Curtis A. Spatial and temporal 16.


