A
pharmacokinetic and pharmacodynamic study with
a single
implant containing
3-ketodesogestrel (Implanon@)
Biran Affandi1, Suharti K. Suherman2,
Tjeerd Korver3,
T.B. Paul Geurts3,
H.J.T.
Coelingh
Bennink3,
W. Gadroena
Abstrak
Untuk mengetahui farmakokinetik dan farmakodinamik Implanon@, dilakukan pemasangan Implanon@ pada 15 wanita pasangan usia subut; umur 20 - 35 tahun, haid teratur dan rtdak sedang menyusukan. Darah vena diambil sebelum dan sesudah implan dipasang sesuai jadwal. Kadar serum etonogestrel (j-ketodesogestrel) 6 minggu setelah pennsangan: 709 pg/ml dan turun menjadi 388 pg/ml pada bulan keenam. Selanjutnya secara perlahan turun, menjadi 169 pg/ml pada tahun kelima. Kadar P4 selalu di batpah 16 nmol/I. Penurunan kadar Ez terjadi pada 12 bulan pertama. Setelah
itu
kndar Ez kembali mendel<ati kadar sebelum pernsangan. Bahlcan kadang-kadang lebih tinggi. Terdapat vartasi intra dan antar subyek. Padall/2
tahun pertama lcadar SHBG di bawah kadar sebelwn pemasangcm. Selnnjutnya meningknt mendel<ati kadar sebelwn pemasangan. Tidak ditemukan kehamilan. Setelah pencabutan, di-laporkan terjadi kehamilan pada 2 subyek. Kembalinya kesuburan berdasarkan kembalinya haid dan kembalinya kadar progesteronfase luteal, terjadi pada 7 dariI
subyek, 3 bulan setelah Implanon@ dicabut.Abstract
With the objective to investigate the pharmacokinetic and pharmacodynamic profile of a single implant containing 3-ketodesoges-trel (Implnnon@), 15 healthy women of fertile aged betvveen 20 and 35, with regular cycles, and not breastfeeding were recruitted. Blood sample were drawn before and after implant inserted according 1o schedule. Serum concentration of 3 keto-desogestrelfor the
first
six weeks after implant insertion was 709 pg/ml and had decreased to 388 pg/mlat
six months. Thereafter concentration further decreased slowly with time ffifihyear mean 169 pg/ml, range 141 - 204 pg/ml, n=7). Maximum P concentrations remained below 16 nmol/l in the whole treatment periodfor
the majority of subjects. In four subjects maximum P concentrations exceeding 16 nmol/I thefirst
six weeks. Reduced E2 concentrations were obsertted durtng thefirst
12 months. Thereafter mean concentrations were close to, and sometimes ex-ceeding, those observed before insertion. A large inter-subject and inlra-subject varintion was obsewed. During thefirst
11/2 year mean and median SHBG concentrations were below screening values. Thereaftea SHBG concentrations were close to the screening values. No pregnancies occured during teatmenL No subjects discontinued due to bleeding irregularities or amenorrhoea. Overall reference periods (RPs), the prevalence of a amenorrhoea ranged women 0 (for 9 out of 20 reference pertods) and 33.37o. No amenorrhoea occurred from RP 14 onwards. For infrequent bleeding the range was between 20.07o and 73.3Vo, for number of bleeding-spotting days RP ranged from 16.5to
31.7. The mean nurnber of bleeding-spotting episodes rangedfrom 1.9 to 3.7. Two post-treatment pregnancies were reported. Retum offertilty, judgedfrom return of menses or retum of luteal phase progesterone levels, could be confirmed to occur within 3 months afier removal of the implant in seven out of eight available subjects.Keywords: Implnnon@, implant contraceptive, phamacokinetic, pharmacodynamic.
Folkman
and Long
in
1964 published their findings
that silastic tubes could serve as a reservoir
for the
prolonged administration
of
a drug. Two
years later,
Dziuk
and
Cook found that the
in
vitro
release
of
t Klinik Raden Saleh, Department of Obstetrics and Gynecology Faculty of Medicine, University of Indonesia/
Dr
Cipto Mangunkusurno National Hospital, Jakarta, Indonesia.2Department of Pharmacology, Faculty of Medicine, University of Indonesia, Jalarta, Indonesia
3Clinical Development Department and Medical Services Department, NV Organon Oss, The Netherland 4NV Organon Indonesia
steroids from silastic capsules
was practically
con-stant and independent
of
the drug concentration
in-side the tube.l'2
Based
on the above studies,
implantable
contracep-tives have been
developing.
In 1983 Norplant@
be-came the first and
only available implantable
contra-ceptive
to
be
introduced in
family
planning
pro-gram.3'4By
March
1997 there were more than
3million women in the world
used Norplant@
as theircontraceptive method.
More than 757o of them were
Indonesia women.
devel-16
Affandi etal
opment
of
synthetic
polymers, it
has becomepossible
to develop hormonal delivery
systems
with long
du-ration
of
action and continuous
release
of
the
drug.
Advantages
of
the long-term contraceptive
implants
arelack of
concern
for
compliance
andprompt return
of
fertility
after removal.
Furthermore, the parenteral
route
of
administration results
in
a lower
metabolic
burden on the
liver
than
with
oral
contraceptives.3,4Studies
indicated
that
implantable
contraceptive
with
3-ketodesogestrel
is
a promising method
for
further
investigation.s-8
NV
Organon
(Oss,The Netherlands)
hasdeveloped
asingle-rod
implant
(Implanon@).
The
rod is
made of
an ethylene
vinyl
acetate
copolymer
(EVA)
with
acore
containing approximately
68
mg
of
Org
3-ke-todesogestrel
or
desogestrel
(ENG).
The
initial
release
rate
of
the implant
is
approxi-mately
67 ltglday which slowly
decreasesover
time.
The
constant release
profile
results
in
suffrciently
high
plasma
ENG concentrations (>90 pgiml)
to
in-hibit
ovulation
for
at least three
years.ENG
is
a
progestin, structurally derived
from
19-nortestoterone;
it
is the
biologically
active metabolite
of
desogestrel
(DSG). DSG is the progestin
compo-nent
of
a
number
of
widely
used
oral
contraceptives
with
a
well
established efhcacy and safety profile.
The
characteristics
of
the implant's
EVA
membrane,
combined with
the
high specific progestin activity
of
ENG, allow
the useof
asingle-rod
systemwith
alow
and almost zero-order
release.
As
a
consequence of
these
proporties, dose-related side-effects are
mini-mised.
However, known typical
disadvantage
of
pro-gestin-only
methods is
disruption of
the
normal
men-strual
cycle, including
amenorrhoea,
With
the
objective
to
investigate
the
pharmacody-namic and pharmacokinetic
of
a single-rod implant
(Implanon@),
a
phase
tr
study was
conducted
atKlinik
Raden Saleh, Department
of
Obstetrics
and Gynecology,University of
Indonesia/Dr. CiptoMangun-kuSumo
National Hospital,
Jakarta, Indonesia
be-tween June
1989
through
May
1995.
The study
wasapproved
by
the
ethical
committee.
MATERIAL AND
METHODS
Implant
Implanon@
is
a
single-rod implant
with
alength of
4
cm
and adiameter
of
2mm
containing approximately
Med
J
Indones68
mg of
ENG.
The rod is
madeof
EVA with
anENG
core surrounded
by
anEVAmembrane.
The
initial
re-leaserate
of ENG from
Implanon@
is approximately
67
trtglday.Implanon@
is delivered in the
needle
of
asterile, disposable,
specially
designed inserter.
Implanon@
was
individually
packed
in
almunium
sa-chet, manufactured
by
NV
Organon,
Oss,Holland.
Design
of
the
study
A
total
of
15
healthy women were recruited.
Inclu-sion criteria were healthy women
of
proven
fertility
(child
and/or abortion),
willing to
give written
in-formed
concent,
willing
to rely on the
one
rod
-
im-plant
method
for
contraception
with additional
useof
condoms,
willing
to return to the
clinic for
regularly
scheduledvisits
and be accessiblefor follow-up,
hav-ing regular
menstrual cycles between
24-35,
age 20-35 at acceptance, andnor
currently
pregnant or breast
feeding.
Exclusion criteria were
subjects
are
not
eligible,
within two
weeks after an abortion, before the
first
menses
after
delivery
before the
first
spontaneousmenstrual
bleeding after discontinuation
of
oral
con-traceptives,
andwithin six
months after the last
injec-tion
of
contraceptive steroids. Subjects should not
have
ahistory of, pelvic inflammatory
disease(PIDy
Salpingitis since last
pregnancy,
ectopic
pregnancy,
any
malignant
disease,
persistent abnormal genital
bleeding. Abnormal menstrual
cycle
(persistent
ir-regular
inter
menstrual bleeding
or
amenorrhoea),
breast discharge,thrombophlebitis, thromboembolism,
or
severecardiovascular problems, mental
illness,
de-pression
or
epilepsy, severe and/or frequent
head-aches,and diabetes
mellitus.
There
should
be
no
current
clinical
evidence of,
blood
pressure
greater than 140 systolic
or
90
dia-stolic,
jaundice,
PlD/Salpingitis,
breast
discharge,
mental illness, manifest anaemia
(<10
ghaemoglobin
tHbl/100
rnl
blood),
severe
hirsutism,
pregnancy,
positive urinary
glucose,
pap
smear grade
III
or
above,thrombophlebitis,
and useof
enzyme inducers
or inhibitors.
Screening
assessmentstarted
(seeTable
1).
After
a
subject was considered
eligible,
the
Implanon@was inserted
within five
daysof the
onset
of the
menses.Tbble
1.
Screening assessmentsTimeinweeks
-4
-3
(relative to
implantation)
or earlierChecklist selection
criteria
.
Gynecological history taking, general, physical and pelvic examination, Pap smear, Hb
Provide diary card
Blood sampling :
.82
rP
r
ENGr
SHBG1
one blood sample/analysisper
week2
nvo blood samples/analyses per week-
no analysisProcedure
for
insertion
Insertion
of
the
implant
was
performed
between
thefirst
and
the the
fifth
day
of
the subject's
menstrual
flow.
Implanon@ wasinserted
onthe inside
of
theup-per (non-dominant) arm, 6
to
8 cm
above
the elbow
in
the groove
between the biceps and
triceps
(sulcus
bicipitalis medialis). The
area
of
insertion
was
thor-oughly
cleansed
with
a antiseptic
prior to
insertion.
Using
alocal
anaesthetic, I7o
lidocune,
the
insertion
areawas
anaesthetisedjust below the skin along
theinsertion 'canal'.
An
anaesthetic spray
could
also
beused
to
anaesthetisethe
skin.
The
inserter was entered through the
anaesthetised'canal'to
the
full
length
ofthe
needle.The
sealofthe
inserter
was
broken by
pressing the
plunger
support.
The
plunger
was then tumed 90
or
180
degrees.While
the
plunger
was
fixed
against
the arm,
the
in-sefter was
slowly pulled out
of
the arm with
the
plunger tightly held
against
the
arm.
A
pressureban-dage
with
sterile
gauze
was
applied
to
minimize
bruising. The subject was
told to
keep the
bandageclean and
dry for four
days.Procedure
for
removal
The
implant
was
located by palpation. The
subject's
arn
was
washed
and
antiseptic applied.
A
small
amount
of
local
anaesthetic (l%o
lidocaine) was
ap-plied
under the
implant.
After
machine a
2 mm
inci-sion, the
implant
was
gently
pushed
toward the
inci-sion
until
type tip
was
visible.
The
implant
was then
grasped
with
forceps and removed.
If
the
implant
could not
be pushed
into
the
incision,
closed forceps
were
inserted
into incision
in
order
to
gently
dissect
the tissuesaround
theimplant. While
thetissues were
being
dissected,
the
implant was
pushed
toward
the
incision.
After
removal
of
the implant, the
incensewas closed
and bandaged.The
implant
wasto remain
in situ for 24,36,
48
or
60months,
depending
on the willingness
of
the
volun-teerto continue the
study.During
the
whole
study
pe-riod
occurrence
ofadverse
experiences
aswell
as useof
concomitant medication was reported.
If
preg-nancy was
suspected atany
time in the
study,
apreg-nancy
test was performed.
In
addition,
the
subject
collected
dataon her bleeding pattern
in
adiary
card.At
regular
time intervals the
subjects
returned to
the
clinic to
exchange
the diary
card.Subjects returned
twice weekly to
the
clinic
for
hor-mone determinations
during
certain
time intervals:
in
thefirst
year
of
treatment
from
weeks
1to
6,24 to
29 and 48to
53,in
the
second aswell
asin
the
third
year
from
weeks 20
to
25
and46 to 51,
and
in
the
fourth
andfifth
year
from
weeks
II
To14,24 to
27,37 to
40
and50
to
53.
In
theseperiods
circulating
progsterone
(P)
andestradiol
(E2) were determined
twice weekly,
whereasENG
and
SHBG
were measured once every
two
weeks.However, during the
fourth
andfifth
treat-ment year
ENG
was
measured
once
a
week while
SHBG
measurement were
not
done
(seeTable 2).
Additionally, during
the
fifth
year
of
treatment
blood
biochemistry was investigated
alkalic
phosphatase,alanine amino
transferase
(ALAT),
aspartate
amino
atranferase
(ASAT),
urea, creatinine, triglycerides,
total
cholesterol,
andhigh density lipoprotein
(HDL)
cholesterol and
low
density lipoprotein
(HDL)
cho-lesterol and
low
density lipoprotein
(LDL)
choles-terol,
fasting
blood
sugar
and post-prandial blood
sugar.Upon implant removal at
any
time
ageneral
medical
and
pelvic examination,
as
well
as
a cervical
smearwas made.
ENG
was
measuredjust prior to removal
and24,48
and 96hours after removal. Post-treatment
thereturn
of
menses wasinvestigated.
Blood
sampleswere drawn for E2
and
Panalysis.
For three
months
-2
aaaa
')
')
',
., [image:3.595.71.314.88.429.2]1-l-18
Affandi etal
Thble
2.
Assessment during treatmentMed
J Indones
First year Second year
Third
year Fourth yearFifth
yearTime in weeks
Assessment no.
Status at implantation site
General examinaton* Physical + pelvic exam.
Pap smear
E2, P, ENG, SHBG**
(period in weeks)
Blood biochemistry
1 13263952
132639
23456789
52
t3
26 39
52l0 1l t2
13
1413 26 39
5215
t6 t7
1813 26 39
52t9
20 21
22 aaaaa
aaa
aa
aa
(1-6)
(24-2s) aa(48-53)
(20-2s)(11-14) (37-40) (11-14)
(37-40)(46-51) (20-25) (46-51) (24-27) (50-53)
(24.27\
(50-s3)*
Including blood pressure, body weight, Hb**
Regularly assessed overa
6-week period (treatment yearl-3)
or
a-4 period (year 4-5), SHBG was not measured inthe
fourth
andfifth year
Week numbers (each treatment year starts with week 1) are givenin
brackets.Note:
During assessment2
the implant was to be inserted. Concomitant medication, AEs, pregnancy testif
suspected, and bleeding data were to be collected/reported throughoutpost-treatment
the
subject was requested
to
use
adi-ary card.
If
a pregnancy occulred during this
post-treatment
period,
it
was to
befollowed for
pregnancy
outcome
andpaediatric evaluation. During
the
whole
study
period
subjects
were
advised
to
use
additional
non-hormonal protection
if ENG
concentrations were
below I2O pglml.
At
extended treatment year
4,
sub-jects were strongly
recommendedto
take
anotherform
of non-hormonal
contraceptive,
preferably
IUD.
The measurement
of
E2,
Pwere performed
in
Jakarta
following
common protocols and
reagents
provided
by
theWHO
Matched ReagentProgramme.e'IO
While
the measurement of
ENG
andSHBG
were carried
out
in
Jakarta and Oss according
to previously
described
radioimmunoassay
procedure. I I -3REST]TTS
AND
DISCUSSION
Profile
of
the
subjects
A
total
of
15 women were recruited
into
the
study.The physical details of all
subjects are shown
in
Ta-ble
3.Age
ranged
from27 to
34
yearswith
anoverall
meanvalue
of
29.7+
2.3
yearc.Quetelet
(body
mass)index
ranged
from
16
to26with
and
overall
mean
of
19.7+
2.9 kghn2.
All
subjects had
been
pregnant
more
than
oncebefore.
All
subjects had used
somekind of
contraception
before; pelvic and physical
examina-tions did not
demonstrate
any abnormalities.
All
cer-vical
smearresults at screening were either Pap
classI or II.
The
meanduration
of
menstrual
bleeding
was5.8
+
1.0 days.Thble
3.
Profile of the subjects (N=15)Characteristic
Mean +
SDAge (years)
Height (cm) Weight (kg)
29.7 r54.1 46.7
2.3 3.6 6.3 2.9
1.0
+ + + + + Quetelet Index
(kg/m2)
19.7 Duration of menstrual bleeding(days)
5.8Pharmacodynamics
Progesteron
(P)
Screening
15 Weekl-6
15Week24-29
15Week
48-53
15Wæk72-71
15 Week98-104
15 Week124-129
15 Week150-155
15 Week167-170
10 Week180-183
l0 Week193-196
l0Week2b-209
l0Week279-222
7Week232-235
7Week245-248
7 Week 258-261 7Thble
4.
Frequency table of maximum progesterone perassess-ment
Assessment
Number of
subjects
Number of subjectsN
with concentrations with concentrations<10 10-<30 >30
>16nmoVl nmoVl
nmoUl
nmoUlAccording
to
Landgren
et
a1,14progesterone
levels
>16
nmoUl,
sustainedfor
atleast
5days, zre
compat-ible with
owlation.
This only
applies
the
second
andthird
subjects and,
who
had
more than
one
measure-ment >16
nmol/I. For the
second subject
the
pattern
would be compatible
with
an ovulation having
oc-curred
by Day 8-11 before implantation;
in
the
sec-ond
sequence
of
evaluated progesterone levels
the
levels were lower
and suggestive
of
a
luteinized
en-raptured
follicle
also
in
view
of
the
low
E2
levels
during
the
same
period.
All
subsequent
measure-ments showed
suppressedprogesterone.
For
the
third
subject progesterone values
>16
nmoVl were
ob-served at the
first
measurement
of
the
week
180-183 assessment andgain
during
the week 232-235
assess-ment.
In
both
casesit
cannot
be
established whether
the
elevated levels were maintained
sufficiently long,
because
of
the intervals between
subsequent
meas-urement.
But,
becauseall
other measurements, i.e. up
to
and
including
the
last
treatment
assessment
of
weeks 258-261, showed
suppressedprogesterone
lev-els and because the
observed values were much
lower
than
the
screening
peak value
of
62.0
nmol/I,
it
is
likely
that
some luteinisation rather than ovulation
occurred
in this
subject.
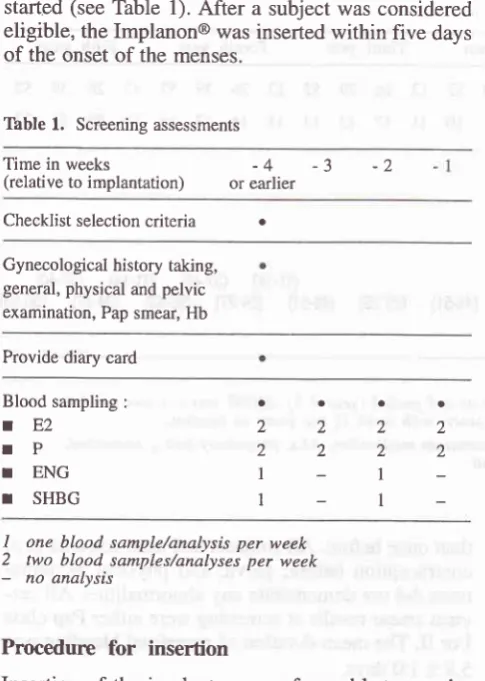
17F
-
Estradiol
(Ez)
In
Table
5,the most
important
statistics
in relation to
E2, concentrations are presented.
Summary
statistics
of within-subject
mean,minimum,
median
andmaxi-mum
E2concentrations
zlregiven per
assessmentpe-riod.
In
Figure
1,the
means (depicted
by
stars
andjoined
by
dashedlines),
median
(oined by lines),
interquar-tile
and P05-P95 ranges
of
within-subject mean
Ezconcentration
aregraphically
displayed.
A
substantial decrease
in
the
mean.
SD and
median
of
the
within-subject
mean E2concentrations was
ob-served
during the
first
six
weeks after insertion.
At
six
and 12 months moderately reduced values
were
still
observed, but thereafter values were close
to
andafter
two
years exceeding
the
screening
value. This
suggests
that
the majority
of
subjects
had
reduced
meanEz
concentrations
during the
initial
one
to two
years,
which
thereafter
increasedto
values close
to or
even exceeding screening values. Inspection
of
theindividual
mean
E2
concentrations confirmed this
overall
pattern and showed also a
large intra-subject
variation.
2 11 15 15 l4
t5 l5
15 l0 9 10 9 7 6 7 '7
I
2 12
2
I
l3
2
I
Progesterone levels >16
nmoVl
were occasionally
ob-served:
o
During
the
first six
weeks after
insertion,
oneSub-ject
once
displayed
a
value
of
30.2
nmoVl
(bounded
by 0.6 and 8.0 nmoVl
measured
at
start
and end
of
the
same
week, respectively).
Shemaintained
progesterone
levels
>30 nmol from
4
days
before insertion
until
day
11
after
insertion.
Ihe
same subjects also had
progesterone values
>16
nmol/l
(but <30 nmol/l)
from
Day
2I to
day42.
o
During
the72-77
weeks
assessment, a secondsub-ject
displayee
aprogestrone value
of 128.8
nmoUl
at study
Day
537; the values measured
atthe starl
and the end
of
the
same
week were 0.9 and
0.8nmoUl, respectively.
o
During
the
week
180-183
assessment,
the
first
measurement
of
athird
subject revealed
aproges-terone value
of
16.8
nmoVl, which was followed
by
1.2
nmoVl
4
days
later. The
same subject
dis-played during the week 232-235
assessmentpro-gesterone values
of
22.9
(Day
1653)
and
16.6nmol.il
(Day
1656). These
two
values were
pre-ceded
by
2.5 nmoVl
(Day
1650) and
followed by
Affandi et
al
Tâble
5.
Summary tableof
l7p-EstradiolMed
J
IndonesAssessment
Mean
N
l7p-Estradiol (pmoVl)Mean SD
MedianMinimum 17B-Estradiol (pmoUl)
Mean SD
MedianMedian 17p-Estradiol (pmoVl)
Mean SD
MedianMaximum 17B-Estradiol (pmol/l)
Mean SD
MedianScreening
Week1-6
Week24 - 29 Week 48 - 53Week72 - 7'l Week 98
-
104Week 124
-
129Week 150
-
155 Week 167-
170Week 180
-
183 Week 193-
196Week 206 - 209
Week2l9 - 222 Week232 - 235 Week245 - 248 Week 258 - 261 Post-removal 614 175 280 403 617 to20 695 1272 905 1428 1493 1767 1767 1058 1309 1349 441 76.1 49.5 66.0 78.6 80.6 107.3 80.9 96.4 124.2 123.9 r23.3 118.9 159.3 79.1 80.0 9l.5 t29.7 15 15 15
l5
r5 15 t5 r5 t0 10 t0 r0 7 7 7 7 9308.6
167.7130.1
146.0192.2
108.6202.8
83.6280.9
177.9409.2 24s.4
341.1
205.6503.7
265.2436.1
253.8576.5
203.8614.2
319.5603.9
323.1613.4
238.2499.7
292.9561.6
378.1515.3
251.6255.9
69.937
278.136
1M.668
175.077
167.577
198.1100
276.786
228.992
333.5121
283.995
434.71r9
438.4t29
400.6t73
388.937
397.657
367.5't4
354.r145
218.1181.8
239110.0
6987.9
13165.6
t71118.7
189126.2 261
110.8 196
184.9
298169.2
265214.9
3893r8.1
351331.1
301175.3 360
257.t
249324.8
2792M5
33283.8
220722.3
456.2321.4
356.1434.5
364.9413.3
218.4795.7
630.01t39.4
855.7949.0 755.8
t31',t.3
870.91035.3
739.61490.4
407.01410.1
730.51693.3
760.41491.0
609.811',79.1
599.31437.9
831.21323.6
710.7496:1
281.0276 85 140 208 255 374 268 497 443 595 650 564 694 346 476 633 253 70.1 67.9
4t.t
46.6 47.4 49.3 39.4 64.4 75.9 92.1 60.7 47.3 81.759.
I
6l.5 58.7 64.3 1400 1300 1200 1't00o
1000H
o,
{J
900o
r,
g
800 +JÉ
7ooI
ca
800c\
Fl
5006 c)
à
400300
200
100
0
I P S EFËFRNH*FE
Ë â Ë BàBEBé$gàE
6!FNNNNNs s g
ggsgsggssF
o@oo -E'Nrô
fiiËË
[image:6.595.83.585.104.715.2]Study
period
Tbble
6.
Summary table of SHBGMean SHBG (nmoL/l) relative change from baseline SHBG* Assessment
SD
Screening Week
l-6
Week24-29 Week 48-53 Week72-77 Week 98-104 Week 124-129 Week 150-155
15
15
l5
15
15
15
l5
15
61 39 50 46 53 66 57 65 77.5
45.3 56.6 54.4 58.2 74.1 66.6 70.1
36.6 16.2 20.3 18.4 21.6 31.6 25.5 20.0
-38.9 -23.8 -25.6
-2t.6
-2.1 -r0.9
-4.6
15.2 15.9 19.7 16.3
18.
I
22.4 19.0
-39 -18 -24 -20 -6 -10
a
+ Vo change of within subject mean SHBG
from
baseline (i.e. last screening value)Sex
hormone
binding
globulin
(SHBG)
Summary
statistics
of
within-subject
mean, and
rela-tive
change
from
baseline
of
SHBG concentrations
per
assessmentperiod
arepresented in Table 6. With
respect
to
relative
change
from
baseline, the
latest
screening
value
is
used as baseline value. Judging
from
the
mean and median relative
changes
from
baseline,
SHBG
was
suppressed
during the initial
lll2
yearsof treatment. Thereafter,
SHBG
concentra-tions were also to the screening values.
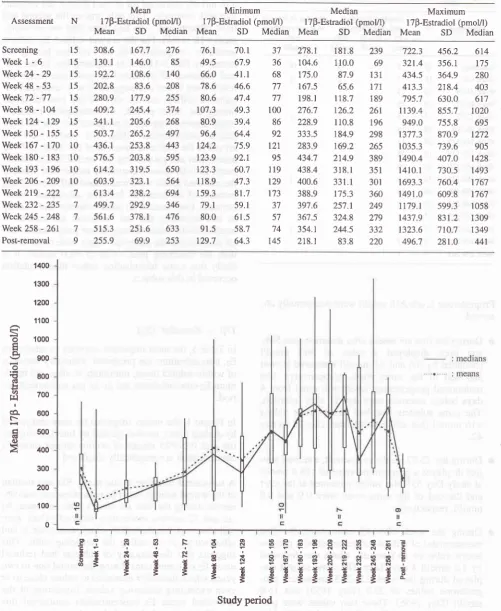
Pharmacokinetics
During the first
three treatment years,
per
subject
threeENG determinations
(biweekly during
6weeks)
: medians : means 1100
a
â.
ÉË
Ê.o
z
II]
9 E E F 8 & ERSESNEE6
E
* * * il
$
EÉEE$$$$$
È
s
s
s
s
E EEEiiiË!s
[image:7.595.98.547.408.717.2]Treafinent period
22
Affandi et alwere performed
in
each
monitoring period. During
treatment
yearsfour
andfive, four
determinations per
period (weekly during
4
weeks) were performed
in
each subject.
In
Figure
2
the
mean (depicted
by
stars),
median
(joined by lines), interquartile
and P05-P95 range
of
on-treatment within-subject mean
ENG
concentra-tions
aredisplayed.
During
the
first
six
weeks
after implant insertion
thewithin-subject
mean
ENG concentration
was
on
av-eruge
709.3
pe/ml
(SD 194.5 pglml,
n=15).
Maxi-mum
serum concentrations were attained
between
Day 6 and29
andon
average onDay
15. Thesemaxi-mum
concentrations ranged
from
373
pglml
to
1837pglml. As six
months, the mean
concentrations
haddeclined
to
on
average387.8
pùml
(SD
104.1pglml,
n=15).
From
the months 6
assessmentonwards,
aver-age mean
ENG concentrations
slowly
declined to
316.1 (SD 79.2),256.7 (SD 47.3), 235.4
(SD
41.9),222.2
(SD 36.7)
and 169.1(SD 24.8)
p{ml
at thelast
assessment
periods
of
year
1
(n=15),
2
(n=15),
3 [image:8.595.344.582.142.390.2](n=15), 4 (n=10), 5 (n=7),
respectively.
Table 7 provides frequencies
of
the number of
sub-Med
J
Indonesjects with
meanENG
concentrations
<
90
pglml,
90-<
120pg/ml
and
>
120
peml.
Table
7.
Frequency table of mean ENG per assessmentNumber of subjects with concentrations
Assessment
<
90
90 - <120pg/ml
pglml>
pglml120Weekl-6
Week24 - 29
Week 48 - 53
Week12 - 77
Week 98
-
104Week 124
-
729Week 150
-
155Week 167
-
170Week 180
-
183Week 193
-
196 Week 206 - 209 Week2l9 - 222Week232 - 235 Week245 - 248
Week 258 - 261
l5
l5
1515
15 t5 t5
l0
10 10 10 6 7 7 715 15
l5
l5
15 15 15
10 10 10
l0
6 6 6 7None
of
the subjects had mean ENG concentrations<
90pg/ml during the entire treatment period.
*
èn
À
9
zooz
f'l
ec?
If-€c.E
aPN@ sNo ooôtËË
Post-removal period
s
N o
Ë
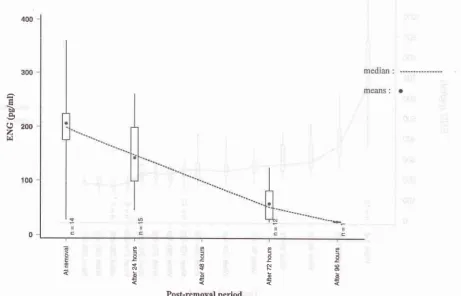
[image:8.595.106.568.425.721.2]After
implant removal
ENG
concentrations rapidly
decreased as can
be observed
from Figure
3,display-ing
box-plots
of
ENG concentration
assessedeither
just
prior
to or
just
after removal and after
24,72
and/or
96
hours.
[image:9.595.74.560.76.719.2]Vaginal bleeding
patterns
Figure 4 illustrated the vaginal bleeding
patterns
ac-cording to WHOls.
The
mean numbers
of bleeding/gpotting days
were
ranged
between
17.5days
in
reference
period
XI
and31.7 days
in
reference
period XD(.
The
mean numbers
of
bleeding/spotting
episodeswere ranged between 1.9 in
reference
period
XI
to
3.7
in
reference
period
XD(.
Some amenorrhoea were
found in
reference
period
2through to
reference
period
13.Contraceptive-efficacy
During treatment no
pregnancies
occurred. None
of
the subjects
usedcondoms
or
other
additional
contra-ceptives during the
first
three
treatment
years.
After
three years other
additional
contraceptives were
usedby
some subjects
from month
39 onwards.
No
infor-mation on condom
useis available for this
period.
Return
of
fertility
There
were
10 subjectsparlicipated in
thefourth
year
of
the study
and
there were only 7
of
them finished
the
fifth
year.After
having
the implant removed they were
evalu-ated
for
return
of fertility
within
three-months after
implant
removal.
The results
are asfollows:
o
2
subjects were pregnant
o
5 subjectsreported
their
menseshaving
returned
to
the
normal pre-trial
pattems
o
3
subjects
did not
have
their
menses
returned to
normal:
r
2
subjects
had luteal
phase progesteron levels
(P= 44.9 nmoVl and48.2 nmoVl
r
1subject
with
P=
1.2nmol,/l
CONCLUSIONS
This
study,along
with
other
studies,5,7'86"-ot
stratesthat
ENG
contraceptions
in
Implanon@
were
sufh-cient to inhibit ovulation
and
normal luteal function.
Signs
of luteinization
were
rarely
observed.
E2
levels
showed large
intra
subject
andinter
subject
variation,
which indicates that ovarian function was not
fully
suppressed.
There
was
no
pregnancy occured
during
5 6 7 I
I
10
't'l90-day
referenceperiod number
Bleeding
patterns
with
Implanon
[image:9.595.73.556.441.710.2]lAmenorrhoea trlnlrequent
IFrequent
24
Affandi etal
the
implant
use.As
with
other
progestin only
contra-ceptives, the
bleeding
patterns
were signified
by
dis-ruption
with
amenorrhoea,
bleeding
and spotting.
Acknowledgements
The study was conducted
as
part
of
Implanon@
Re-search and
Development
Program,
sponsored andco-ordinated
by
NV Organon, Oss,
the
Netherlands.
Thanks are due
to Dr.
Stevenson
from N.V.
Organon
Holland
for
Good
Clinical
Practice
Monitoring, to
Drs.
Wardoyo Gadroen, Bandar
Manik
and
Susilo
from
Organon Indonesia
for
study monitoring, to
Dra.
Rosminah
from
Klinik
Raden Saleh
for
patients
coordination,
to
Drs.
AGM
Theeuwes
and RMV
Stoleman
from
SOG
NV
Organon, Drs.
JoedoPrihar-tono and Sujadi
for
statistical analysis
and
to
Sofia
Yoebhaar
for typing the
manuscript.
REFERENCES
1.
AffandiB.
Clinical, pharmacological and epidemiological studies on a levonorgestrel implant contraception. PhD the-sis, University of Indonesia, Jakarta, 19872.
Coutinho E: Clinical experience with implant contraception.Contraception 197 8, 18: 411-27
3.
Affandi B, Santoso SSI, Djajadilaga et al. Five yearexperi-ence with Norplant@. Contraception 1987 , 36: 417 -28
4.
Ladipo O, CounthinhoM.
Contraceptive implants. Currentopinion in Obstetrics and Gynecology 1994,6: 564-9
5.
Davies GC, Feng LX, Newton JR, Beek AV,Coelingh-Ben-nink HJT. Release characteristics, ovarian activity and
men-strual bleeding pattern with a single contraceptive implant
re-leasing 3-ketodesogestrel. Contraception 1993, 47 : 251 -61
Med
J
Indones6. Geelene
JAA,
van der Wardt JCT, VoortmanG,
MoosenGCT, Eenink MJD. Release kinetics
of
3-ketodesogestrelfrom contraceptive implants (Implanon@) in dogs in
compari-son with in vitro data. Contraception 1993, 47:215-26
7. Diaz S, Pavez M, Moo-Young AJ, Bardin CW, Croxatto HB.
Clinical
trial with
3-ketodesogestrel subdermal implants.Contraception 1991, 44: 393-408
8. Olsson SE, Odlind V, Johansson E. Clinical results with
sub-cutaneous implants containing 3-ketodesogestrel.
Contracep-tion 1990, 42: l-11
9. Edqvist LE, Johansson EDB: Radioimmunoassay of oestrone
and oestradiol in human and bovine peripheral plasma. Acta
Endocrin (Copenh) 1972, 7 1: 7 16-30
10. Thorneycroft
IH,
Stone SC: Radioimmunoassayof
serumprogesterone in women receiving oral contraceptive steroids.
Contraception 197 2, 5: 129-46
11. Bergink EW, Hamburger
AD,
de Jager E, van der Vies J.:Binding of a contraceptive progestogen0192969 and its
me-tabolites to receptor proteins and human sex hormone
bind-ing globulin. J Steroid Biochem 1981, 14: 175-83
12.
Vctor
A, Weiner E, Johansson EDB: Sex hormone bindingglobulin: The carrier protein for d-norgestrel. J Clin Endocrin
Metab 1976, 43:244-7
13. Cullberg G, Lindstedt G, Lundberg PA, Steffensen
K
:Cen-tral and peripheral effects of desogestrel 15-60 pg daily for
21 days
in
healthy female volunteers. Acta Obstet GynecolScand Suppl 1982,
lll:21-8
14. Landgren B-M, Unden A-L, Diczfalusy E. Hormonal profile
of the cycle
in
68 normally menstruating women. ActaEn-domecrinal 1980, 94: 89-98
15. Balsey FM, Farley TMM. The analysis of menstrual bleeding