The application of correction factors on serum retinol of Indonesia school children
Drupadi Dillon,1,2 Min K. Htet,1,3 Faraja P. Chiwile1
1SEAMEO-TROPMED, RCCN-UI
2Department of Nutrition, Faculty of Medicine, University of Indonesia, Jakarta, Indonesia 3Ministry of Health, Myanmar
Abstrak
Tujuan: Defi siensi vitamin A pada anak masih merupakan masalah gizi masyarakat di Indonesia. Pengukuran kadar retinol serum/plasma merupakan cara terbaik untuk menentukan status vitamin A. Berbagai penelitian menunjukkan bahwa infeksi menurunkan kadar retinol serum, sehingga dapat salah mendiagnosa status vitamin A, dan dapat mempengaruhi kebijakan penanggulangan masalah defi siensi vitamin A di masyarakat. Penelitian ini bertujuan memperlihatkan pentingnya menerapkan faktor koreksi berdasarkan status infeksi pada kadar retinol serum, sebagai petanda status vitamin A.
Metode: Survei yang melibatkan 54 anak sekolah sehat dilaksanakan di Nusa Tenggara Timur. Pengukuran tinggi, berat badan, kadar retinol, CRP dan AGP serum dilakukan. Berdasarkan kadar CRP dan AGP serum, subyek penelitian dibagi dalam empat kelompok: tanpa infeksi, masa inkubasi, penyembuhan awal dan penyembuhan akhir. Faktor koreksi didapatkan dengan membagi kadar retinol serum dari kelompok subyek tanpa infeksi dengan masing-masing tiga kelompok lainnya. Faktor koreksi tersebut kemudian digunakan untuk mendapatkan kadar retinol serum yang tidak dipengaruhi oleh adanya infeksi.
Hasil: Prevalensi subyek yang pendek dan berat kurang adalah 43% dan 22%, dan tidak ada subyek yang kurus. Sebelum dan setelah kadar retinol serum dihitung dengan faktor koreksi, prevalensi defi siensi vitamin A menurun dari 20.4% menjadi 18.5%, sehingga defi siensi vitamin A yang tanpa faktor koreksi merupakan masalah gizi masyarakat yang berat, menjadi masalah gizi menengah setelah faktor koreksi diterapkan. Perubahan tingkat masalah gizi ini dapat merupakan faktor penentu rencana kebijakan penanggulangan masalah gizi tersebut.
Kesimpulan: Menerapkan faktor koreksi berdasarkan keadaan infeksi menurunkan besaran masalah defi siensi vitamin A. Hal ini dapat mempengaruhi kebijakan perencanaan program gizi masyarakat. (Med J Indones 2010; 19:258-63)
Abstract
Aim: Vitamin A defi ciency among children is still a public health problem in Indonesia. Serum/plasma retinol concentration is the best indicator in assessing vitamin A status. However, there is growing concern that infection/ infl ammation lowers serum retinol concentration, thus creating potential misinterpretation of vitamin A status, which could affect policy makers in planning suitable nutrition programs targeted at community. The aim of this study was to highlight the importance of applying correction factors, to better interpret serum retinol as a nutritional status biomarker.
Methods: A cross sectional study involving 54 apparently healthy school children was conducted in East Nusa Tenggara. Height, body weight, concentrations of serum retinol, CRP and AGP were assessed. Based on concentrations of serum CRP and AGP, four infl ammation groups were determined, namely reference, incubation, early convalescence and late convalescence groups. Correction factor was obtained by dividing serum retinol concentration of reference group by that of the other three groups. Correction factors were then used to correct serum retinol concentration without any infl uence of infection/infl ammation.
Results: The prevalence of stunting and underweight were 43% and 22% respectively, but there was no wasting among the school children. Applying correction factor lowered the prevalence of vitamin A defi ciency from 20.4% to 18.5%; thus changing vitamin A defi ciency from a severe public health problem to a moderate public health problem.
Conclusion: Correcting serum retinol concentration for the infl uence of infection reduced the apparent severity of vitamin A defi ciency. This could affect policy for planning nutrition programs designed for communities. (Med J Indones 2010; 19:258-63)
Key words: correction factor, infection, school children, serum retinol
Vitamin A defi ciency/VAD especially among children continues to be a public health problem in Indonesia.1 The best indicator to diagnose VAD is the a measurement of serum/plasma retinol using High Performance Liquid Chromatography (HPLC).2 However, in the presence of infections or subclinical infl ammations, serum retinol tends to be lower as a consequence of body’s reaction to acute phase response, and which may not represent the true body status. This potential over-estimation of VAD could infl uence any decision by policy makers to plan suitable nutrition programs targeted at community.
Studies have shown the potential magnitude of mis-classifi cation of vitamin A status due to infection.3-9 In addition, a meta-analysis of 11 studies showed that serum retinol was on the average reduced between 12-31% in different infl ammatory groups, and provided correction factors to use, where local data was unsuitable for that purpose.10 The usefulness of correction factors is considered in this report, as it may give implications for the programme management points of view.
The aim of this study was to highlight the importance of applying correction factors to better interpret serum retinol as a nutritional status biomarker.
METHODS
The study was part of a cross sectional study, involving 364 apparently healthy public elementary school children during June 25th to 9th July 2001 in Alor district, East Nusa Tenggara Province Indonesia. The school was attended by children belonged to low income households. This study covered 54 out of the 364 school children, through a selection using simple random sampling. Informed-consents were obtained from school children’s parents after explaining the study objective to them. Demographic characteristics of the children were obtained using structured questionnaire. Nutritional status was determined by anthropometric measurements: weight was measured with minimum clothing to the nearest 0.1 Kg using platform SECA 770 (Hamburg, Germany), while heights with microtoise to the nearest 0.1 centimeter. Z scores of three different growth indices were determined,11 and WHO AnthroPlus package was used to determine nutritional status. Stunting, underweight, or wasting was determined when HAZ-score, WAZ-HAZ-score, or WHZ-score was < -2SD.12 We used WHO13 criteria to categorize prevalence data in accordance to its public health signifi cance: prevalence of stunting ≥ 40% considered as very high prevalent,
and prevalence of underweight 20-29% considered as high prevalent.
An experienced laboratory technician collected non-fasting venous blood of the school children to assess the concentrations of serum retinol, C-reactive protein/ CRP and α-1 acid glycoprotein/AGP. Serum retinol concentration was measured by HPLC (Waters 515, Milford, MA 071757, USA), while serum CRP and AGP concentrations were measured by ELISA method.14 We used cut-off values of < 0.7μmol/L serum retinol concentration to indicate VAD2, ≥ 1.05 μmol/L serum retinol concentration to indicate adequate vitamin A store/ AVAS.2 We used WHO1 criteria to categorize prevalence data in accordance to its public health signifi cance: VAD prevalence ≥ 20% and ≥10 - <20% considered as severe and moderate public health importance, respectively.
Concentrations of serum CRP >5mg/L and serum AGP >1.0g/L indicate infection/infl ammatory status.10 Based on serum CRP and AGP values, school children were categorized into a reference and three infl ammation groups10: no infection/reference group if serum CRP ≤ 5mg/L and serum AGP ≤ 1.0 g/L; sub-clinical infl ammation/incubation group if serum CRP > 5mg/L and serum AGP ≤ 1.0 g/L; early convalescence group if serum CRP > 5mg/L and serum AGP > 1.0 g/L; late convalescence group if serum CRP ≤ 5mg/L while serum AGP > 1.0 g/L.
Local or internal correction factor of each group was obtained by dividing the median serum retinol concentration of the reference group over the median serum retinol concentration of each infl ammation status group. In addition, we adopted the correction factors of 1.15, 1.31 and 1.12 respectively, for the three infl ammation status groups from the meta-analysis10, to calculate their median serum retinol. We then computed the proportion of VAD using original-uncorrected, internally-corrected and meta-analyses-corrected data.
Ethical approval
The study protocol was reviewed and approved by the Ethical Committee of the Faculty of Medicine, University of Indonesia.
Statistical analysis
retinol was used to calculate the internal correction factors of each infl ammation status group.
We compared the results of serum retinol concentration using Anova, amongst the original-uncorrected, internally-corrected and meta-analyses-internally-corrected data. Kruskal Wallis test was used to compare differences of serum retinol concentrations, proportion of VAD and AVAS amongst reference and infl ammation groups.
RESULTS
The study area is an endemic malaria area, where in general, people suffer from recurrent malaria infections. However, malaria, diarrhea and common cold were not in season during the months of June and July, when data was collected. There were more girls (59%) than boys (41%) as subjects. Table 1 shows some characteristics of the school children. The age of the school children ranged from 6-10 years. There was a tendency that girls were older than boys. Stunting was very highly prevalent, higher than national data; while underweight was highly prevalent. No indication that vitamin A status was correlated with stunting or underweight.
Almost two-third of the school children was free from infection/infl ammation. There was a tendency that more boys were categorized within incubation period, while more girls reached AVAS and were categorized within early convalescence period. None of the school children were wasted.
Mean serum retinol concentration was 0.88 μmol/L (SEM 0.03 μmol/L with 95% CI: 0.81;0.95 μmol/L) and median of 0.87μmol/L. Serum retinol concentration did not differ between boys and girls. There were no correlations between concentrations of serum retinol and serum CRP or AGP, nor with age.
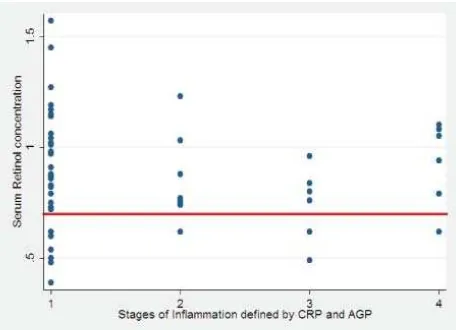
Figure 1 shows that most school children were in the non-infection stage (1), while 39% fell into the infl ammation stages: 15% in the incubation period, 11% in the early convalescence, and 13% in the late convalescence period. The fi gure also indicates that in stage 3, where serum CRP concentration >5mg/L and serum AGP concentration >1.0 g/L, one-third (33%) of the school children had serum retinol concentration <0.7μmol/L, while in the other stages, the proportion of school children with serum retinol concentration <0.7μmol/L was only about half, ranged 14-18%.
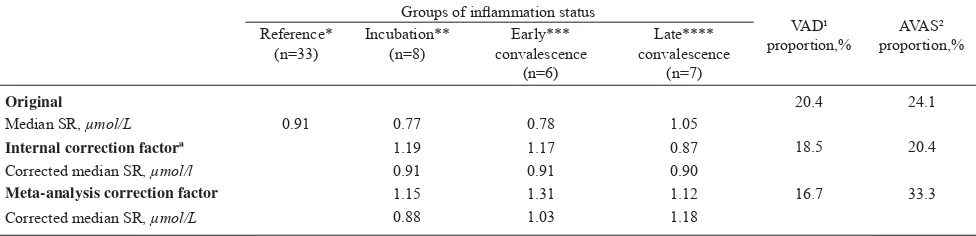
Table 2 shows the results of median serum retinol computations after adjustment using internal and meta-analysis correction factors. The median of serum retinol concentrations was higher after internal and meta-analysis correction compared to uncorrected values. Neither serum retinol concentration nor the prevalence of vitamin A status was different amongst the original-uncorrected, internally-corrected and meta-analysis-corrected data. Characteristics Girls
(n = 32) Boys (n = 22)
Total (n = 54)
Age, yª 8.4 ± 1.4 7.8 ± 1.4 8.2 ± 1.4
Stunting¹, % 44 43 43
Underweight², % 22 23 22 Proportion of vitamin A defi ciency ³, % 19 18 20 Proportion of adequate vitamin A store4, % 28 18 24
Proportion of reference group*, % 63 59 61 Proportion of incubation group**, % 9 22 15 Proportion of early convalescence group***, % 16 5 11
Proportion of late convalescence group****, % 12 14 13
Table 1. Characteristics of school children by sex
Figure 1. Distribution of serum retinol concentration of school children by infl ammation status
1= no infection (serum CRP ≤5mg/L and AGP ≤1.0 g/L); 2= incubation period (serum CRP >5mg/L and AGP ≤1.0 g/L); 3= early convalescence period (serum CRP >5mg/L and AGP >1.0 g/L); 4= late convalescence period (serum CRP ≤5mg/L and AGP >1.0 g/L) Note: Red line indicates serum retinol concentration of 0.7μmol/L . ª Mean ± SD
¹ HAZ-score<-2SD; ² WAZ-score<-2SD; ³ Serum retinol concentration <0.7μmol/L;
4Serum retinol concentration ≥1.05 μmol/;
DISCUSSION
This study was part of a cross-sectional study involving 364 school children, but due to budget availability, we could only measure 54 blood samples. Based on serum concentrations of CRP and AGP, majority (61%) of the children fell into the reference group category, as they were free from infection or infl ammation. This means a considerable proportion of the school children did not suffer from any infections or infl ammatory conditions during the survey, as only 15% of the school children was in the incubation group. In our study, recruiting school children as sample during school hours, actually unintentionally already excluded those who did not come to school, most probably due to illness. If this were the case, it could have decreased the proportion of children in the reference group category. In addition, 39% of these apparently healthy school children were either in incubation, early convalescence or late convalescence stages. Therefore, it is also worth to note that the survey was done during dry season, during which, malaria attack, common cold and diarrhea are usually less prevalent.
In this study, we could not fi nd any association between HAZ, WAZ or WHZ and serum retinol concentration. A study on children with fever showed an increased excretion of retinol in the urine.15 During illness, the immune system makes all efforts to fi ght against infection/infl ammation, and needs enough supply of nutrients – thus increasing requirements of all nutrients, as is vitamin A. As recurrent infections cost most nutrients of the body to handle infection, in children undergoing growth process especially, recurrent infections may cease growth. In this area of endemic malaria, recurrent
malaria attacks should have caused a big health burden to the school children – thus the association between HAZ, WAZ or WHZ and serum retinol concentration was expected to exist.
Similar to the third NHANES5 result, our data shows that serum retinol concentration did not differ between girls and boys, as the age range of our subjects was between 6-10 years. Serum retinol concentration between male and female in the third NHANES increased with age during the fi rst two decades of life, similarly in both males and females, and only started to differ during the third to sixth decades of life.
The third NHANES5 observed that mean serum retinol was low at <10 years of age, but increasing with age. However, our data showed serum retinol concentration did not increase with age – similar to other study result among 480 adolescent girls aged 10-17 years in Jakarta.16 Unlike vitamin A status, unpublished data of elementary school children in Jakarta showed that anemia prevalence was higher among fi rst-third grade compared to their older counterpart of fourth-sixth graders as hemoglobin concentration increased with age.
We did not observe any association between concentrations of serum retinol and CRP nor AGP. Positive acute phase protein such as CRP increases within 6 hours of infection and reaches its maximum concentration within 24-48 hours.17,18 Concentration of AGP is slow to rise and achieves maximum level in 2-5 days after infection.17 The concentration of CRP falls rapidly with the disappearenc of stimulus, whereas AGP remains elevated for a longer period.19 Serum AGP is released in a slower rate compared to CRP7, therefore, AGP is more
Groups of infl ammation status
VAD¹
Internal correction factorª 1.19 1.17 0.87 18.5 20.4
Corrected median SR, μmol/l 0.91 0.91 0.90
Meta-analysis correction factor 1.15 1.31 1.12 16.7 33.3
Corrected median SR, μmol/L 0.88 1.03 1.18
Table 2. Serum retinol values and proportion of vitamin A status of school children after computation with internal-correction and meta-analysis correction factors
SR=serum retinol concentration; ª Median SR of reference group divided by median SR of respective infl ammation status group. * Serum CRP ≤5mg/L and serum AGP ≤1.0 g/L; ** Serum CRP >5mg/L and serum AGP ≤1.0 g/L;
*** Serum CRP >5mg/L and serum AGP >1.0 g/L; **** Serum CRP ≤5mg/L and serum AGP >1.0 g/L;
related to the changes of serum retinol concentration during infection/infl ammation. This only indicates that sequential monitoring of the different nature of CRP or AGP in conjunction with serum retinol is a necessary process to provide informations about the extent to which serum retinol is decreased during different stages of infl ammation, as well as the possibility to correct serum retinol to exclude the infl uence of infl ammation. Unlike in the meta-analysis study,10 however, we observed no differences of serum retinol concentrations amongst the uncorrected, internally-corrected and meta-analysis-corrected data.
We observed similar results of VAD prevalence as the meta-analysis study.10 The prevalence of VAD did not differ amongst the original-uncorrected, internally-corrected and meta-analysis-internally-corrected data. However, the 20.4% VAD prevalence of uncorrected data (Table 2) was considered as severe public health problem.1 Whilst the VAD prevalence after internal correction or meta-analysis correction was only 18.5% and 16.7%, respectively - less than 20% prevalence, thus classifi ed as moderate public health problem.1 Policy makers plan different programs in relation to the severity of the problem. Recent global estimate for VAD by WHO based on night blindness or biochemical assessment reported that prevalence of VAD was present in a moderate to severe degree in preschool children in 45 and 122 countries among 193 WHO member states. The majority of the survey included in this estimate did not consider indicators of infection. However, the infl uence of infection on the assessment of vitamin A status is acknowledged, and recommendations are made to include markers of infl ammation for future studies.1 This study illustrates the situation in which the serum retinol assessment was infl uenced by infl ammation in 39% of samples collected, which could have implications for the strategic decision making and program implementation.
AVAS is a condition in which a person has an adequate vitamin A storage.2 To our knowledge, this is the
fi rst report which observes the AVAS. This report shows a range of 39-50% when combining VAD and AVAS prevalence, which means more than half of school children were in a marginal status of vitamin A with serum retinol concentration between 0.7-1.05 μmol/L. There is a transient decrease in serum retinol concentration during infection, proportionally to the severity of the infection, probably due to metabolic requirement.19 A study on children with fever showed an increased excretion of retinol in the urine, indicating an increase of retinol metabolism during infection. The school children in this
study lived in an endemic malaria area. As the majority of the school children did not have adequate storage of vitamin A, local health authority should consider giving vitamin A supplements to school children, in addition to the existing vitamin A supplementation program aimed at the under fi ve children.
The school children belonged to low income families, but the high proportion of stunting in this study calls for more intensive study to investigate the cause of stunting as chronic under nutrition problem: insuffi cient dietary intake, recurrent infections, or other socio-cultural behavior of the community. A health program planning would then be based on the cause related to the serious problem of stunting in this area.
Despite having a small sample size, nevertheless, our data gives an indication to support the growing concerns that interpreting nutritional indicators in the presence of infection/infl ammation, especially in an area with a burden of infectious diseases, will lead to an overestimation of VAD.
A study with bigger sample size is required to provide more reliable information on the important results obtained in this study.
Acknowledgments
We thank the Government of Indonesia and GTZ-SEAMEO Nutrition Project Indonesia for the funding, and Department of Parasitology, Faculty of Medicine, University of Indonesia, for their cooperation during the study.
REFERENCES
1. World Health Organization. Global prevalence of vitamin A defi ciency in populations at risk 1995-2005: WHO glo-bal database on vitamin A defi ciency, 2009. (cited 2010 April 10). Available from: http://whq libdoc.who.int/ publi-cations/2009/9789241598019_eng.pdf
2. Sommer A, Davidson FR. Assessment and control of vitamin A defi ciency: the annecy accords. J Nutr 2002; 132:2845S-50S.
3. Thurnham DI, Mburu AS, Mwaniki DL, De Wagt A. Micronutrients in childhood and the infl uence of subclinical infl ammation. Proc Nutr Soc 2005;64:502-9.
4. Paracha PI, Jamil A, Northrop-Clewes CA, Thurnham DI. Interpretation of vitamin A status in apparently healthy Pakistani children by using markers of subclinical infection. Am J Clin Nutr 2000; 72:1164-9.
vitamin A status in the third National Health and Nutrition Examination Survey. Am J Clin Nutr 2000; 72:1170-8. 6. Shankar AH, Genton B, Semba RA. Effect of supplementation
of vitamin A on morbidity due to Plasmodium falciparum in young children in Papua New Guinea: a randomised trial. Lancet 1999; 354:201-9.
7. Filteau SM et al. Vitamin A supplementation, morbidity, serum acute-phase proteins in young Ghanaian childrens. Am J Clin Nutr 1995; 62:434-8.
8. Tomkins A. Assessing micronutrient status in the presence of infl ammtion. J Nutr 2003; 1649S - 55S.
9. Wieringa FT, Dijkhuizen MA, West CE, Northrop-Clewes CA, Muhilal. Estimation of the Effect of the Acute Phase Response on Indicators of Micronutrient Status in Indonesian Infants. J. Nutr. 2002; 132:3061-6.
10. Thurnham DI, McCabe GP, Northrop-Clewes CA, Nestel P. Effects of subclinical infection on plasma retinol concentrations and assessment of prevalence of vitamin A defi ciency: meta-analysis. Lancet 2003; 362:2052-8. 11. Fahmida U, Dillon DHS. Handbook of Nutritional
Assessment. UI Press 2007.
12. World Health Organization. Growth Reference data for 5-19 years. AnthroPlus. (cited 2010 April 10). Available from: http://www.who.int/growthref/en/
13. World Health Organization. Nutrition Landscape Information System. WHO 2010. (cited 2010 October 10) Available from: www.who.int/nutrition/nlis_ interpretation _guide.pdf
14. Erhardt JG, Estes JE, Pfeiffer CM, Biesalski HK, Craft NE. Combined measurement of Ferritin, Soluble Transferrin Receptor, Retinol Binding Protein and C-Reactive Protein by Inexpensive, Sensitive, and Simple Sandwich Enzyme-Link Immunosorbent Assay Technique. J.Nutr 2004; 134(11):3127-32.
15. Stephensen CB, Alvare JO, Kohatsu J, Hardmeier R, Kennedy Jr JI, Gammon Jr RB. Vitamin A is excreted in the urine during acute infection.. Am J Clin Nutr 1994; 60:388-92.
16. Dillon DHS. Nutritional health of Indonesian adolescent girls: the role of ribofl avin and vitamin A on iron status. PhD thesis. 2005.Wageningeen University Cruickshank AM, Hansell DT, Burns HJG, Shenkin A. Effect of nutritional status on acute-phase protein response to elective surgery. Br J Surg 1989;76(2):165-8.
17. Fleck, A and Myers M. Diagnostic and prognostic signifi cance of the acute phase proteins. In: Gordon AH, Koj A, eds. The Acute Phase Response to Injury and Infection, Amsterdam: Elsevier, 1985: p.249-71.
18. Calvin J, et al. The relative merits of acute -phase response. Am Clin Biochem, 1988. 25: p.60-6.