Proceedings of
the 34
th
Asian Conference on
Remote Sensing 2013
Bali – Indonesia, October 20 -24, 2013
Indonesian Remote Sensing Society
and
Editorial Boards:
Gatot H. Pramono
Dadan Ramdani
Baba Barus
Reiza M. Ariansyah
Reviewers:
Baba Barus (IPB)
Gatot H. Pramono (BIG)
Fahmi Amhar (BIG),
A. Anugrahadi (Univ Trisakti)
Albertus Deliar (ITB)
M. Rokhis Khomarudin (LAPAN)
Wikanti A (LAPAN)
Projo Danoedoro (UGM)
Mulyanto Darmawan( BIG)
Muhammad Evri (BPPT)
Yudi Setiawan (IPB)
Chusnul Trijudianto (LAPAN)
Dadan Ramdani (BIG)
Proceedings of the 34
thAsian Conference on Remote Sensing 2013
ISBN: 978-602-9439-33-5
Indonesian Remote Sensing Society
Masyarakat Ahli Penginderaan Jarak Jauh [MAPIN] Jl. Raya Jakarta – Bogor Km 46 Cibinong, Indonesia Phone: +62-(0)-812-110-3127
LAND USE CHANGE DETECTION USING SATELLITE IMAGERY AND ESTIMATION OF BUILDING AND LAND PROPERTY TAX:
CASE STUDY OF BEKASI CITY, INDONESIA
Widiatmaka1*, Wiwin Ambarwulan2, Suwarli3 1
Department of Soil Sciences, Faculty of Agriculture, Bogor Agricultural University, Jalan Meranti, Kampus IPB Darmaga, Bogor, INDONESIA, [email protected]; [email protected]
2
Geospatial Information Agency, Jalan Raya Jakarta-Bogor KM 46, Cibinong, INDONESIA, [email protected]
3
Regional Planning Board, Bekasi City, INDONESIA, [email protected]
*Corresponding author: [email protected], [email protected]
ABSTRACT
Needs of built land continue to increase along with population growth, regional development and growth, as well as development of transportation and infrastructure. Bekasi City, a city in adjacent to the capital of the country, has a rapid built land growth. This study aims to map built land in Bekasi City for the year 2010 and changes of land cover and land use during the 20-year analysis (1989-2000-2005-2010). The results of land use interpretation of 2010 are then used to estimate the potency of building and land property tax revenue. The study was conducted using Landsat TM of 1989, 2000 and 2005, as well as the image of ALOS-AVNIR 2010. The results showed that the use of land as residential land in Bekasi City increased very rapidly in the period of 1989-2010. In that period, there are an increase in residential land use and building area of 13,755.90 ha, this represent 65.4% of the area of Bekasi City, or at a rate of 6.54% per year. This rate is higher than the population growth rate which was 4.14% in the period of 1997-2007. Total residential land and building area of Bekasi City in 2010 was 14,879.85 ha, this represent 70.69% of the total area of Bekasi City. Realization of revenue receipts from formal building and land property tax is still lower than its potency. Theoretically it is possible to increase the government income from building and land property tax, with increasing intensity and admission efforts. The results obtained indicate the need for quality improvement in tax data base, especially the data base of land and building area, the need for more detailed calculations using a more detailed imagery for deriving revenue potency, and the need for georeferenced tax data base, in order to develop the future GIS-based monitoring tax. The results of this research can also be used as a historical analysis of built land area as a function of the development of the city.
Keywords: Landsat, ALOS-AVNIR, residential land, tax revenue
INTRODUCTION
High population growth and rapid development in recent years has resulted in high dynamic changes of land use in most of the city. Cities have changed from small, isolated population centers to large, interconnected economic, physical, and environmental features (Acevedo, 2013). The city of Bekasi is one of the city with high dynamic change due to its position in peripheric capital city. Due to its rapid development (Suwarli, 2011), it is necessary to plan the future development of the city which consider the allocation of land use reflecting the existing condition, so that consideration of future development can be done with more care.
Limited land for development and high competition in land utilization resulting in the conversion of urban land use to become settlements and other suburbs use. As a result, suburban areas or industrial estates grow, there are disorganization and un-integrated zones each other. This condition indicate that may be, not all of land use was located above land that is suitable and feasible (Hardjowigeno & Widiatmaka, 2007). In this context, this research would like to study trend of change in built land use.
Furthermore, the map of built land will be used to calculate the potential tax to be gained. Taxes are an important component of local revenues for development financing. In modern times, land property is a highly priced property. It is most valued and attracts very high commercial ratings. This
Proceedings of ACRS 2013
is a result of urbanization, industrialization and the development of sophisticated agriculture in both private and public sector of the economy (Youngu et al., 2011). Optimization of tax revenue needs to
be done, by planning and estimating the potency of region appropriately, so that government budgeting can be planned.
One alternative strategy that can be applied in the estimation of potential tax revenue is through the use of remote sensing technology, that its currency development has been very rapid. Detailed calculations can be carried out using high-resolution imagery (Tiwari, 2013). One of the problem of the use of high-resolution imagery is relatively expensive. The use of satellite imagery with medium spatial resolution such as Landsat 7 ETM+, SPOT, ASTER or ALOS can be a workable alternative to cheaper cost, though of course with lower in its detail. With this technology, the up to date data of tax object is expected can be obtained by a relatively quick, easy and not too far from realization.
Use of satellite imagery for data collection of property taxes in housing sector concern with information extraction process to determine land cover types in accordance with the data of land use. One of image information extraction method is using satellite image classification process (Peter, 1988; Sabins Jr, 1987; Rajan, 1991; Ambarwulan et al., 2010).
The purpose of this study was to map built land in Bekasi for the year of 2010 and changes of land use during the 20-year analysis (1991-2000-2005-2010). Land cover in year of 2010 was then used to estimate the revenue from building and land property taxes.
MATERIAL AND METHODS
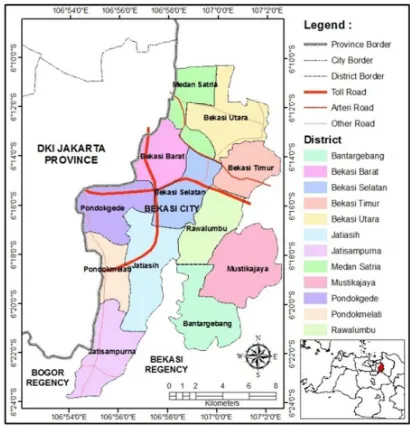
The research wasconductedin Bekasi City, West Java Province, Indonesia, whichliesbetween 106º55'Eand6º7'-6º15' S. The total area ofBekasiCityis210.49km². The city was divided into 12 districts (Figure 1).
Figure 1. Bekasi City and it’s districts
The image used for detection of land use and land cover change is Landsat satellite image of 1989, 2000, 2005 and ALOS PRISM/AVNIR2 of 2010. Administrative maps was obtained from Regional Planning Board of Bekasi City. Interpretation of land cover using Landsat and ALOS/AVNIR-2 was done on-screen and subsequently, fieldchecks was conductedto validate the results ofimage interpretation. Landsatimagery used isLandsatTM, Path122, Row64, recordingon March 5, 1989, 14 September 2000, andJuly 10, 2005, whileALOS/AVNIR-2 is the image recorded on September 2010. ALOS/AVNIR-2 (Advanced Land Observing Satellite/Advanced Visible and Near InfraredRadiometertype2) is the image habitually usedtoobserveland,in particulartogenerate maps of land cover and land use in monitoring changes in the environment, and have a spatial resolution of10m(JAXA, 2007). Spatial analysisofland cover datauseArc-View 3.3 programand
Proceedings of ACRS 2013
itsimageanalystextensions.
Against the image of ALOS/AVNIR 2010, the interpretation of land and building settlements was made. The calculation of the potency of building and land property tax revenue was then done by using interpretation result. For the calculation of the tax, there are two value of tax, namely Selling Price Subject to Tax (SPST) of land and SPST of building. Taxable Selling Price (TSP) used for calculation, according to actual regulation is 20% (for the value of building <Rp. 1,000,000,000.-) or 40% (for the value of building > Rp. 1,000,000,000.-) of the SPST. Single tax rate applied in Bekasi City is 0.5%. Selling Price Not Taxable(SPNT) was set for Bekasi City, at the time of the study was Rp. 8,000,000.-. The real data used for confrontation between image area and tax realization is the tax database of Bekasi City.
The area of land properties and building resulting from the image interpretation was confronted with the real area of land properties land and building taxes from each district to get a value of conversion rate from image data. For this purpose, the image data was confronted with real data tax of Bekasi City. Tax properties was calculated using three assumptions: (i) the low assumption, using a lower minimum value of building and land property tax of Bekasi City, (b) medium assumption, using the average values, and (c) high assumption, using the highest tax revenue data. Results of these calculations are used as input for the Government of Bekasi City to estimate the target of future tax revenue.
RESULTS AND DISCUSSION
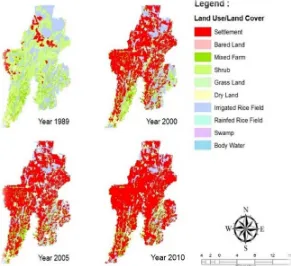
The land use of Bekasi City resulting from image interpretation is presented in Figure 2. Such results of satellite imagery analysis was added with information from terestrial survey and cross-examination of thematic maps available. They give the facts of land use and land cover change during the period of 1989 - 2010 in Bekasi City, as presented in Table 1.
Figure 2. Land cover and land use map of Bekasi City in the period of 1989 – 2010
Pattern of Land Use and Land Cover
The land cover of Bekasi City in 1989 is dominated by shrubs, with an area of 8,976.02 ha (42.64%). This land cover spread from west to southern part of Bekasi City. The other land cover which is also quite extensive is irrigated fields, reaching an area of 3,981.70 ha (18.92%). This land
Proceedings of ACRS 2013
cover spread in the east and south part of Bekasi City. Land use of settlement has an area of 1,157.77 ha (5.50%).
In 2000, land cover in Bekasi City is dominated by settlements, with an area of 10,894.64 ha (51.76%), they are scattered throughout the city. Other land cover which was also dominant in 2000 was irrigated rice field, with an area of 2,099.72 ha (9.98%) spreading in east and south part of the city. In 2005, land cover is dominated by settlements, with an area of 12,884.19 ha (61.21%) and are scattered throughout the city. Furthermore, other land cover which was also dominant in 2005 was dry land farm with an area of 2,292.89 ha (10.89%), locally spread in east to south part of the city. In 2009, land cover in Bekasi City is dominated by settlements, with an area of 14,879.85 ha (70.69%), which are scattered throughout the city. Furthermore, other land cover which was also dominant were dry land farm, with an area of 2,141.70 ha (10.17%), locally spread in east and south part of the city.
Table 1. Land cover of Bekasi City resulting from image analysis
No Land Cover
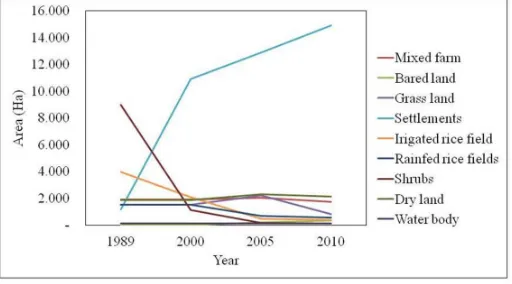
Result of analysis showed that Bekasi City have been developed and undergo a fairly rapid urban growth. Dynamics of land use and land cover changes is significant, especially in increasing the area of settlements, while the other type of land cover were reduced. In 1989, the settlements area looks just concentrated in the north part of the city, along the route. Then in 2000, it appeared an increase of the extent of land cover, which visually spread evenly throughout the city. In the subsequent period of imagery observation, in the period of 2000-2005 there was an increase of residential land cover area very rapidly compared with other observational period. Thus it can be proven empirically that during this period, there has been a rapid growth in the development of the region Jabodetabek (Jakarta – Bogor – Depok – Tangerang – Bekasi) in general, and in particular Bekasi City. This is in line with the various changes that occur in this country, where there has been a process of reform in 1998, followed by social and political change, which then also affects in the speed of regional development. The speed of residential groerh decrease in the period of 2005-2010. The increasing residential land cover directly affects the extent of non-residential land cover in this region gradually. The development of land cover in the long period (1989 - 2010) is presented in Figure 3.
Figure 3. Graph of land use and land cover change of Bekasi City in the period of 1989 – 2010
Proceedings of ACRS 2013
From that figure, it can be seen that in general, there are an increase in the extent of settlement while vegetated area (non-residential) decreased. In 1989 and 2009, it is reflected a rapid growth of residential and built area within 20 years, from 1,157.77 ha in 1989 to 14,879.85 ha in 2010. Otherwise, there are significant decrease of irrigated ricefields, from 3,981.70 ha in 1989 to 394.15 ha in 2009. Change of vegetated land cover to settlement in the period of 1989 - 2009 is presented in Table 2.
Similarly with paddy field, decreasing of land cover area occurs also for shrubs, from 8,976.02 ha in 1989 to 128.28 ha in 2009. Barre land increase, from 1.82 ha in 1989 to 315.55 ha. In Bekasi City, barre land is usually left for years by the housing developers and the land is prepared for construction. Matrix area of land cover change from 1989 to 2009 are presented in Table 3.
Table 2. Change of vegetated land cover to settlement in Bekasi City in the period of 1989 - 2010
No Land Cover 4 Irigated ricefield 1,881.97 439.88 34.29 5 Rainfed rice fields - 582.51 32.39 6 Shrub 7,854.33 953.92 29.30 7 Dry land farm 0.02 - 386.77
8 Water body - - 0.73
Total 9,736.87 1,989.55 2,029.48
Table 3. Matrix of land use and land cover change in Bekasi City during 1989 to 2010
Land Cover 2010
MF = Mixed farm; LT = Barre land; GL = Grass land; ST = Settlement; IR = Irrigated ricefield; RR = Rainfed ricefield; SB = Shrubs; DL = Dry Land; WB = Water body
Building and Land Property Tax
Building and Land Property (BLP) Tax is one of a kind in the Indonesian tax imposed on land and/or buildings. In this research, BLP revenue potency is calculated based on the Selling Price Subject to Tax (SPST), it is a function of the area and the value of the tax object. In this study, estimation of potential tax calculation is done using ALOS AVNIR imagery of 2010.
Based on the tax database of 2011, the number of taxpayers in Bekasi City are amounted to 566,914 people. The amount of tax paid in 2011 was Rp. 140,807,445,962, -, spread over 12 districts in the Bekasi City. Of the 12 districts, district of South Bekasi give the biggest tax contribution, amounting to Rp. 17,211,156,808.- with the number of taxpayers 45,547 people. Districts with the least taxpayers are district of Pondok Melati, with taxpayers of 32,080 people, with the total tax revenue which is also smallest, amounting to Rp. 8,010,706,939.-. Based on tax database of Bekasi City, it is known that the area of land subject to tax is amounted to 217,073,342 m2, while the area of the building subject to tax is 26,688,643 m2.
Based on ALOS image analysis, the area of land subject to tax in Bekasi City was 210,490,000. Thus, there is a difference between the tax data base of Bekasi City with the data resulting from image interpretation. This is because certain tax object was relatively small, which were not detected in the
Proceedings of ACRS 2013
image analysis. For that reason, we make a sampling in some districts to determine the number of alleged conversion of image analysis results against the actual area on government’s tax data base. Sampling in 12 districts, resulting in a conversion rate value of 0.821 of a broad Bekasi administration. Similarly, for building, the conversion rate of 0.614 was obtained from delineated settlement area.
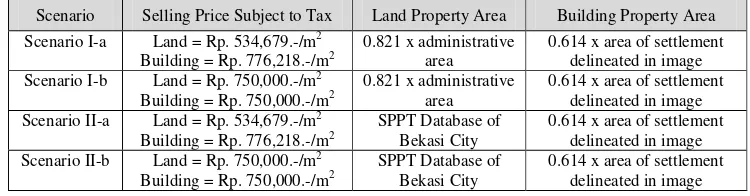
From these values, the scenario were prepared for the calculation of building and land property tax (Table 4). In the scenario I-a, the calculation use the SPST with minimum value, amounting to Rp.534,679. -/m2 for land and Rp 776,218. -/m2 for building, these values are based on the average price of the tax data base of Bekasi City Government. On the assumption I-b, a moderate value were used, i.e. Rp. 750,000,-/m2 for land and Rp 750.000, -/m2 for building, which are based on the tax database of Bekasi City. In both scenarios, the area of land and buildings was acquired from image delineation, converted with terrestrial survey. In the second scenario (II-a and II-b), the amount of land and building taxes are same as used the scenarios I-a and I-b, but the area of land subject to tax is calculated based on a real tax data base of Bekasi City. Detailed scenario calculations are presented in Table 4.
Calculation results of each scenario, by directly combining land tax and building tax, compared with the real revenue from property taxes in 2011 are presented in Table 5. From this table, it is shown that in fact, for the government of Bekasi City, there is still the potency for increasing revenue from tax. Even with the most minimal scenario, the potency for increasing revenue reached 33.12%. This fact suggests that in the future, the intensification of tax collection is still very possible.
Table 4. Scenario and calculations base of land and building tax of Bekasi City
Scenario Selling Price Subject to Tax Land Property Area Building Property Area Scenario I-a Land = Rp. 534,679.-/m2
Building = Rp. 776,218.-/m2
0.821 x administrative area
0.614 x area of settlement delineated in image Scenario I-b Land = Rp. 750,000.-/m2
Building = Rp. 750,000.-/m2
0.821 x administrative area
0.614 x area of settlement delineated in image Scenario II-a Land = Rp. 534,679.-/m2
Building = Rp. 776,218.-/m2
SPPT Database of Bekasi City
0.614 x area of settlement delineated in image Scenario II-b Land = Rp. 750,000.-/m2
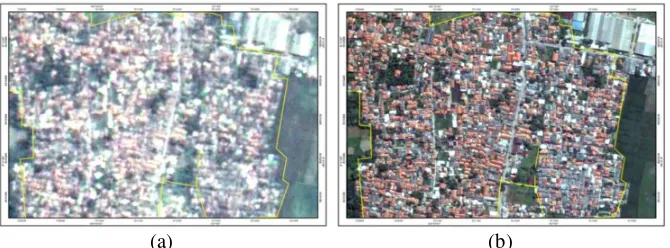
(a) (b)
Figure 4. Difference of delineation of land and building area from different image resolution: a. ALOS-AVNIR, and b. IKONOS
CONCLUSION
Residential land use of Bekasi City increased very rapidly in the period (1989-2010). In the period 1989 - 2010, an increase in residential land use and building area atteint 13,755.90 ha, represent 65.4% of the area of Bekasi City, or at a rate of 6.54% per year. This rate is higher than the population growth rate of 4.14%, according to the statistical data of 1997-2007 (BPS, 2008). According to image calculation, total residential land and building area of Bekasi City in 2010 was 14,879.85 ha, this was 70.69% of the total area of Bekasi City.
Results of property tax calculation using imagery shows that the revenue receipts of PBB is still lower than its potency as calculated from the image. According to the worst scenario of estimation, the increase of revenue for local government of Bekasi City can atteint 33% from actual revenue, while according to optimist scenario, the increase can atteint 93%.
Theoretically it is possible to increase the income of the built and land property tax with increasing intensity and admission efforts. The results obtained indicate the need for quality improvement in tax data base, especially the data base of land and building area, the need for more detailed calculations using a more detailed imagery for deriving revenue potency, and the need for georeferenced tax data base, in order to develop the future GIS-based monitoring tax. The results of this research can also be used as a historical analysis of built land area as a function of the development of the city.
ACKNOWLEDGEMENT
The authors would like to acknowledge the Local Government of Bekasi City, especially to Office of Regional Revenue, Bekasi City for financing the research.
REFERENCES
Ambarwulan W., Mannaerts C.M., van der Woerd H.J., Salama M.S., 2010, MERIS data for monitoring Tropical coastal waters: a case study of Berau estuary, East Kalimantan, Indonesia, Geocarto International (25) 525-541.
Avicedo W., 2013, Analyzing Land Use Change In Urban Environments, The U.S. Geological Survey's (USGS), Urban Dynamics Research (UDR), [http://www.usgs.gov/]
[BPS] Badan Pusat Statistik, 2008, Bekasi Dalam Angka 2010, Badan Pusat Statistik, Jakarta.
Hardjowigeno S., Widiatmaka, 2007, Evaluasi Lahan dan Perencanaan Tataguna Lahan, Gadjahmada University Press, 349 pp.
[JAXA] The Japan Aerospace Exploration Agency, 2013, About ALOS, [http://www.eorc.jaxa.jp/ALOS/en/index.htm]
Rajan M.S., 1991, Remote Sensing and Geographic Information System for Natural Ressources Management, Asian Development Bank, 202 pp.
Peter F.D., 1988, Land Information Management,Oxford, New York, Oxford University Press.
Sabins Jr F.F., 1987, Remote Sensing, Principles and Interpretation, W.H. Freeman and Co, New York, Second Edition, 449 pp.
Suwarli, 2011, Dynamic of land use change and green open space allocation based on environmental regional budgeting, Dissertation, Bogor Agricultural University (in Indonesian).
Proceedings of ACRS 2013
Tiwari U.N., 2012, Property Tax Management System Using Geospatial Technology, Kanpur Municipal Corporation (KMC), [http://kmc.up.nic.in/PDF_Files/others].
Youngu T.T, Sule J.O, Bichi M.A. and Abdulazeez I., 2011, Development of A Geospatial Information System of Land Property Tax Revenue For Area “2” Abuja, International Journal of Advanced Engineering Sciences and Technologies, (7) :1, 023 – 035.
Proceedings of ACRS 2013