!" # $ % "
& & & $
' ##
,- ./0! ,(/! !$ , / . 1 2 3
4 . / " $ , ./%/ 5./
./-'!6 -'!'! . 5, .( !$
% " 3
"" " 2 " $ % 7
" " " "
8( 59 $ 3 "
8 " " 9 "
" " "
" " - " : : ; 5 5 '
- $ ( " ! < $
% " = "
" " $ %
" " " $ 4
" " 8 * >9 "
" 8 #* 9 "
" 8 *#9$ % " "
" " " - " 8 ??+9
2 "" " $ . " 3
>)@ "
" & $ ! > @
7 "
" $
,- ./0! ,(/! !$ . / : . ;
" ( ; $ - ./%/ 5./
./-'!6 -'!'! . 5, .( !
% A "
A ; $ 6
"
A $ 1 "
8 9 A
"
; " : : ;
5 5 ' - $ ,
A $ 5
$ . "
" " $
A 8 $* >9
8 $#* 9 " 8 $ *#9$
B 8 9 = "
A ; " 8 $??+9
A $ :
A >)@
$ A > @
A A A
" $
" & - "
" " $ %
" 7"
" " & A " $ : "
" " &
" " " " $
" & " " " &
$ /
" "
A $
5 " " " 2
" " " 3 "
" $
5 " " "
" $ % " " "
" " 2 "
" " " " " "
" " 2 " "
!""# $%& % '& ( )* + ' * *$ *, - &'.#
#$ "
"
$ F " " " "
" " " "
$ F " . " ,
$ "
. 6 5" " % "
/ " 6 : 5
/ " % , / . 1 2 3
4 . / "
5 - ( )# * +#
5 : 6 5" " % "
/ " 6
. .
- $ $ A A A -1. 5 65
5 F 75
1
: F - ( 5"
- $ $ A A A -1. : $ - $ $ ; .$ 65
- 1& - (
/
& " ( .
$
& - $ $ A A A
" 7 5 65 - $ . H A &
& " " " $ %
6 %7 /6 : = 6 6
" $ $ . ; 5 : ,
/ : % " 8:H;7 % 9 "
:H;7 % = 6 . 6 $ ; 6 $ 6 $ - 6
6 : - 3 - 6 $
" ( - 7: , = 6 $
- ; 6 $ % "
F . " 5 6 8 9
" = 6 H H A 6 5
6 ; $
" 6 %7 /6 : " *= F
/ " ' I . " 6 6 %7 /6 :
$
6 " & "
6 6 5
= J - " "
6 1 '
' # * $
% " " F 1 : %
- , / : # ?$
: ( 5" *$
6 5" "
% " / " 6
. " , * " ##$
K, / . 1 2 3 4 .
$ * .$
$ .)
> 3 8 , 6 !7 $
A 4 3 8 , 6 !7 )
# 6 !7 1 ,B * , B ! .
% 3 6 !7 1 , ++1 .
$ /
) , !7
" , /
- + ! 5 ! 0
. ? ! + D , * ,
6 !7 %
/ ? ! > $
0 , > $
$
, 3
-# + 3 ! %)
# 3 > ,
%-# %-# " 2 $
# % 6D 2 D $
# $ D ,
9 : $)
# ) D ,
9 : $)
# - ? ! > > , ,
D; 4 5 + , *1 /
D; > , + , *1 /#
D;# + , *1 /)
D;% + , *1
/-D;$ 3 > , /.
1
Chapter I
Introduction
1.1 Background
After tsunami hazard predominantly damaged Nanggaroe Aceh Darussalam (NAD) Province in December 2004 and Earthquake in The Special Region of Yogyakarta in 2006, those cases increase the awareness impact of natural hazard for many stakeholders. Natural hazard have wide terms, but common case have been caused by geological hazards. Geological hazards are dangerous situation caused by geological processes (Noor, 2006). The kinds of geological hazards are landslide, mountain eruption, earthquake, flooding, erosion, salination, and drought (Noor, 2006).
Geological hazard caught avoided by hazard mitigation. The concept of hazard mitigation is decreasing risk from geological hazard with impacts on property damage and death toll (Noor, 2006). Spatial planning must consider about hazard mitigation, because it consists of land use arrangement; such as allocation of settlement area, industrial area, conservation area, etc. Analyzing land allocation in spatial planning based on geological hazard has objective to prevent from natural hazard damaging.
Spatial Planning Act No. 26 /2007 describes about how to hazard tackling with determine hazard vulnerability area. In article 42 verse 1: implementation and of spatial planning have been done to decrease hazard risk, which consist of applying spatial planning regulation, safety standard, and apply sanction for scofflaw.
2
stability of area from impact of geological hazard. Types of geological information are: structure and physical properties of rock, slope, earthquake intensity, and existing fault line. All those factors have close relation with stability of area, or describe underground condition. On the surface, existing land use, characteristic demographic of population and economic are the most factors affected in vulnerability from earthquake hazard.
Combination between susceptibility from (geological) hazard cause by earthquake and vulnerability is defined as a risk (Figure 1.1). Risk means the expected number of lives lost, persons injured, damage to property and disruption of economic activity due to a particular natural phenomenon, and consequently the product of specific risk and elements at risk (UNDRO, 1979) (Fournier, 1986) in Kjatsu, (2005). Risk assessments in urban area have benefit to help and clarify decision making for disaster management and the development of mitigation strategies (Khatsu, . (2005).
Figure 1.1 Risk concept; Function Hazard and Vulnerability
Two ways analysis have been done; first is hazard analysis, which measured from geological information (rock structure, slope, earthquake intensity, geological structure, and existing fault line), and second is vulnerability analysis which measured and compared all criteria’s (physical, demographic, and social), and produced rank of priority distribution vulnerability area.
or goals (Turban, 1995).
). SDSS can be defined as an interactive, compu support a user or group of users in achieving ision making while solving a semi structured spatial ki, 1999).
of Research Problem
dly hazard in 20th millennium (UN, 2010), because it come and what level of strength. BNPB (2007) that earthquake and secondary impact of earthquake; 120.000 death victims, and more than 600.000 hous
Those facts describe at least 90% total from othe landslide, and etc.
umber of death victim caused by natural hazard (BNPB, 2
4
Figure 1.3 Number of housing damage caused by natural hazard (BNPB, 2007).
Level of urbanization in Indonesia is still increasing; at least 119 inhabitants per square kilometer is the population density in Indonesia, and particularly in Jawa and Bali islands were 996 inhabitants per square kilometer (BNPB, 2007). The Population growth followed by the increase of built up areas, can increase vulnerability and risk level from natural hazard. As tool for development control, spatial/urban planning has strategic position in mitigation concept to avoid natural hazard.
One of the mitigation concepts to avoid high loss caused by earthquake is to develop spatial planning based on natural hazard potential and vulnerability factors. In facts, not all cities in Indonesia prepare spatial planning based on natural hazard potential and vulnerability factors. Existing locations in Indonesia are surrounded by tectonic and volcanic activities, which should be the priority review for urban planning.
5
structure, the level of damage reached more than 21000 houses damaged, and 15000 were totally destroyed. Those situations require arrangement based on earthquake hazard and vulnerability which aims to reduce lost in the future.
1.3 Aim of Research
This study has a purpose to define and describe about risk, which function of hazard and vulnerability area related to support urban planning process. Until now, there is not any clear term of risk, hazard, and vulnerability area noted in determine in spatial context. In this case, to determine risk has two combinations between hazard and vulnerability area.
1.4 Objective of Research
Objectives of this study are:
1. To determine hazard area based on geological information by using GIS spatial analysis.
2. To determine vulnerability area based on physical, demographic and social factors using multiCcriteria analysis.
3. To determine level of risk area by combining hazard map and vulnerability map.
1.5 Research Questions
1. How to determine hazard, vulnerability, and risk area map based on geological information by using GIS spatial analysis?
2. Which location is potentially susceptible from earthquake hazard?
3. Which location is vulnerable when earthquake occurs? Vulnerability was observed from physical, demographic, and social factors.
4. How big is the risk probability degree in all area based on earthquake hazard, and related to the spatial planning guide.
1.6 General Research Methodology
6
of methodology deals with review hazard and vulnerability literature particularly determined the criteria. The criteria should represent in spatial format data which will be used for spatial modeling.
The second part of methodology deals with multiCcriteria analysis, which use pairwise comparison method (PCM) to assign criterion weighted. The third part of methodology deals with modeling with spatial analysis using GIS capability, which criteria weighted resulted from multiCcriteria analysis is used to simulate in spatial analysis with weighted overlay method.
Figure 1.4 Schematic diagram of research methodology
1.7 Scope of Research
This research is focusing how to determine hazard, vulnerability, and risk area with simulation in GIS. GIS spatial analysis is used to simulate for hazard map model which represent geological information combination. The vulnerability map used was physical, demographic, and social aspects.
A. Hazard Analysis
7
of Mineral and Energy Resources. The geological information is classified into 5 (five) information:
1. Rock Structure and Physical Characteristic. 2. Geomorphology (Slope and Relief).
3. Existing fault line. 4. Earthquake Intensity.
B. Vulnerability Analysis
Vulnerability analysis consist of 3 (three) factors; physical, demographic (demographic of population), and social.
1. Physical Factor
Representative of physical aspects in urban risk analysis can be divided in three categories: density of built up area, number of structure, and type of structure.
2. Demographic Factor
The main factor of demographic vulnerability is described in characteristic demographic population that represents some data; 1) Total population, and 2) Density distribution, and 3) Population growth rates. Those criteria will transform into spatial data, which is subCdistrict administrative as a boundary unit.
3. Social Factor
Representative of physical aspects in urban risk analysis could be differentiated in three categories; 1) low income distribution, 2) Gender, and 3) Age structure (elderly and children).
C. Risk Analysis
Risk is the function of hazard and vulnerability, it means that the combination between hazard map and vulnerability map will produce risk map. Risk is multiplication between hazard and vulnerability function, which can be expressed in the following mathematical form:
8
1.8 Location of Research
The research location was in the Bantul Regency, Yogyakarta Province. The coordinate geographic position was in latitude 07°44'04" S C 08°00'27" S, and longitude between 110°12'34" E C 110°31'08 E. The climate was influenced by sea in south (Indian Ocean), and the majority of land used for settlement and agriculture. Topographic conditions were steep in the west side, and flat in rest area such as coastal area.
Figure 1.5 Location of Research
9
1.9 Research Output
The main output this study is;
1) Hazard area map based on geological information (ground stability), which is susceptible from earthquake.
2) Vulnerability area map based on multiCcriteria analysis.
3) Risk map, which is the combination between hazard map and vulnerability map. Risk map is used to assess the spatial planning map that already exists.
1.10 Limitation of Study
This research is focus on hazard, vulnerability, and risk area from impact of earthquake hazard. Some limitation based on early investigated explain the limitation of this study are;
1. In the world, vulnerability concept is multiCinterpretation; it wasn’t consensus to exactly define the meaning of vulnerability. That fact cause vulnerability analysis cannot use single solution problem, or as problems which possess multipleCsolutions and contain uncertainty about the concepts, rules, and principles involved to reach these solutions (Rashed and Weeks, 2003)
(Cutter, L.S., Boruff, J. B., and Shirley, L. W., 2003). So, in this research tried to generate the criteria related with hazard (earthquake) vulnerability, especially to determine the criteria. Widely examination of relevant literature was used to select the criteria.
2. Some of spatial data are not in the same basic scale or source, and it can decrease spatial accuracy. For example geological map has a scale of 1:100000 while administrative map has a scale of 1:25000.
10
Chapter II
Hazard Analysis: Ground Stability Analysis in
Urban Area
2.1 Introduction
Earthquakes are considered as natural hazards, which become the main interest of environment experts. Impacts of earthquakes are producing environment physical damage until cause of death. Refers to BNPB (2007), the impact of earthquake caused at least 120.000 death victims among 2002 to 2006. That impact also brought economic loss and regional development incline. Experiences in Aceh tsunami (2004), Yogyakarta earthquake (2006), and the newest occurrence in Padang (2009) made experts to reach solution to minimize the impacts of earthquake.
The effort to avoid impact of earthquake hazard uses mitigation approach, which can be depend as an activity to avoid impact of natural hazard or manmade hazard for public and nation (Sutikno, (2006)). Mitigation is divided into two important parts, structural and nonCstructural. Structural mitigation is done by structural approach such as land suitability, building resistance, type of material structure, and etc. Non structural mitigation is done by “soft structure” such as dissemination, education, training, institution development, etc. Both of concepts should parallel in those implementations.
11
Spatial planning process must be supported by geological information to identify where location susceptible from earthquake hazard. By using geographic information system (GIS) can manage and utilization of (earthquake) hazard information (DGME, 2004). Spatial analysis capability in GIS is possible to produce hazard map, which is become important part in land use planning process.
2.2 Objective of Research
The objective of earthquake hazard in this research to determine hazard area based on geological information by using GIS spatial analysis. Geological information consist of 4 (four) main factors which influence to ground stability; rock structure, slope, earthquake intensity, and fault way.
2.3 Literature Review
2.3.1 Definition of Hazard
Hazard is potentially damaging physical event, phenomenon, or human activity that may cause the loss of life or injury, property damage, social and economic disruption, or environmental degradation (ISDR, 2007). Following the ISDR term, hazard can include latent conditions that may represent future threats and have different origins: natural (geological, hydroCmeteorological and biological) or induced by human processes (environmental degradation and technological hazards). Hazard can be single, sequential or combined in their origin and effects. Each hazard is characterized by its location, intensity, frequency and probability (ISDR, 2007).
2.3.2 Geological Hazard
12
kinds of geological hazards are landslide, mountain eruption, earthquake, flooding, erosion, salination, and drought (Noor, 2006).
The types of geological hazard which have often been occurring are cause by four factors; soil movement, mountain eruption, debris avalanches, and earthquake (Noor, 2006). That kind of geological hazard is the main hazard which cause more property damage and death toll. In this research study, the focus is in geological hazard caused by earthquake.
2.3.3 Earthquake
Earthquake is a shaking and trembling of the crust of the earth, caused by collision between ground plates, active fault from volcanic activity, and detritus of rock (BNPB, 2007). An earthquake is a sudden, rapid shaking of the earth caused by the breaking and shifting of rock beneath the earth's surface (Earthquake, 2007). Earthquake is an energy released phenomenon that cause dislocation in the inside part of earth with instant change.
Refer to USGS (2008), term of earthquake is the vibration, sometimes violent, of the earth's surface that follows a release of energy in the earth's crust. This energy can be generated by a sudden dislocation of segments of the crust, by a volcanic eruption, or event by manmade explosions.
The main causes of earthquakes (BNPB, 2007) can be classified as follows: 1. Tectonic activity caused by ground plate displacement.
2. Fault activity in earth surface.
3. Local geomorphologic displacement, for example soil detritus. 4. Volcanic activity.
13
Figure 2.1 Illustration earthquake caused by tectonic activity (Bakornas PB,
2007).
Earthquakes can occur at any time without warning. An earthquake sequence happen in the place where earthquakes occurred in the past and it will happen again (Earthquake, 2007).
2.3.4 Impacts of Earthquake
The impact of earthquake depends on many factors related to ground seismicity and activities on the surface. The factors depend on each other’s and it can strengthen the earthquake. The most earthquake effect is building damage caused by ground shaking and trembling.
Refers to Bell (Bell, 1999), the most serious direct effect of earthquake in terms of building and structures is ground shaking. Researchers prove ground condition is a main factor shaking effect and it cause damaging for building and structures. Although building and structures standing on the firm bedrock, it can still be affected, so the susceptible buildings should not be located near to a fault trace. The most effects caused by earthquake classify into 4 (four) types (Upseis, 2008):
1. Ground Shaking
14
Figure 2.2 Friday earthquake in Anchorage, Alaska (Walker, 1982)
Figure 2.3 The ruins in Bantul, Yogyakarta Province, 2006.
2. Ground Displacement
The second main earthquake hazard is ground displacement (ground movement) along a fault. If a structure (a building, road, etc.) is built across a fault, the ground displacement during an earthquake could seriously damage or rip apart that structure.
3. Flooding
The third main hazard is flooding. An earthquake can rupture (break) dams or levees along a river. The water from the river or the reservoir would then flood the area, damaging buildings and maybe sweeping away or drowning people.
4. Fire
The fourth main earthquake hazard is fire. These fires can be started by broken gas lines and power lines, or tipped over wood or coal stoves. They can be a serious problem, especially if the water lines that feed the fire hydrants are broken, too.
2.3.5 Yogyakarta (and Bantul) Earthquake
15
The epicenter Yogyakarta earthquake located in the west side of Opak fault line, which has geographic coordinate; 8.24º S and 110.43º E (USGS, 2006) in Haifani, . (2008). Alongside that coordinate is the central of damaging, which was through in Merapi alluvial materials formation. That formation are consists of alluvial, tuff, breksi, agglomerate, and lava current (Haifani, 2008).
Figure 2.4 Epicentrum Yogyakarta Earthquakes (UNOSAT, 2006)
The numbers of victims in Yogyakarta earthquake were 4,680 people killed, and 19,897 injured (Table 2.1). The administrative area has a lot a number of death tolls located in Bantul Regency with 4,141 people, that statistic is over than 90 percent all sum of dead people. Almost the dead victims were caused by struck down of building materials.
Table 2.1 Victim Data in Yogyakarta Earthquake
No.
16
Yogyakarta earthquake also caused a lot of destruction of many houses in some area. Bantul has the highest number of damaging houses compared to other areas, at least 96,360 houses were totally damaged (totally loss), and 70,769 heavily damaged (Table 2.2).
Table 2.2 Number of house damage in Yogyakarta Earthquake
No.
Source: Yogyakarta Earthquake Media Center (2006) in Haifani, . (2008).
2.4 Methodology
2.4.1 Method of Research
The method of research mapping earthquake hazard is shown in figure 2.5. First part research method is to review and identify hazard potential factor. Those factors were selected and examined by geological experts, which was explained in manual of spatial planning for mountain eruption vulnerability area, and earthquake vulnerability area. Rock structure, slope (and relief), earthquake intensity, and geological structure are the most affected when earthquake occurs.
17
2.4.2 Review and Identify Earthquake Hazard Criteria
There are many criteria related to earthquake hazard that can determine the level of damage. Most of the researchers believed the closeness to fault way were the most important criteria in earthquake hazard (Bell, 1999, ITC, 2005, BNPB, 2007, Erdik, 2007). Bell (1999) explained although a land had solid firm bed rock wasn’t effect when in the land had or through fault way. Some experiences describe which higher damage area located near or precise in fault way.
Fault Way
Fault way is the vulnerable place when interCplate movement and intraCplate movement occur, which is divided into two categories; horizontal and vertical movements (Gulati, 2005) (Figure 2.6). The movement plate in fault way is the primary threat, which causes ground shaking effect. The bigger intensity in ground shaking cause higher damage for building and infrastructure (Bell, 1999).
(a) Dip Slip Fault (b) Dip Slip Fault (c) Strike Slip Fault
Figure 2.6 Type of slip plate movement at fault (Kadarisman) (Gulati, 2005)
Earthquake Intensity
Second criterion which is important in earthquake hazard is earthquake intensity. Earthquake intensity is the function of magnitude, distance from epicentrum, vibration time, earthquake deep, soil condition, and structure condition (PIRBA). The measurement of earthquake intensity states in mercalli modified intensity (MMI). Earthquake intensity is closely related to another intensity criteria; gravity force (α), and richter scale (Table 2.3). Levels in MMI scale can be described as follows in state earthquakes (Table 2.4).
18
Table 2.3 Earthquake intensity, gravity force, and richter scale
MMI αααα Richter
Table 2.4 Descriptive Scale of Earthquake Intensity in MMI
MMI Descriptive scale of earthquake intensity
I Not felt
II Felt by persons at rest
III Hanging object swings; vibration like passing light trucks IV Vibration like passing of heavy trucks
V Felts outdoors; awake sleepers; unstable objects move VI Felts by all; glassware broken; books of shelves VII Hard to stand; noticed in cars; damages some masonry
VIII Collapses some masonry; moves some frame housing
IX General panic; foundation damage; cracks in ground
X Most structures destroyed; landslides; water thrown XI Rails greatly bent; underground pipes out of service
XII Damage nearly total
Source: FEMA
Slope
19
Table 2.5 Slope classification
No Percent of Slope Information
1. 0 – 7 % Flat
2. 7 – 30% Moderate Steep
3. 20 – 140% Very Steep
4. > 140% Very very steep
Source: Ministry of Public Work, Rep.of Indonesia (2007).
Rock Structure
Strength of rock from earthquake effect depends on physical characteristic; cohesiveness and material configuration. Those factors influence to reduce vibration and ground shaking from earthquake effect, and then secure structure from damage. Rock structure and strength from earthquake effect are classified into 4 classes (Rudi Suhendar, 1998) (Table 2.6).
Table 2.6 Rock type classification from earthquake resistance and Landslide probability
No Classification Rock Type
1. I Andesite, Granite, Diorite, Metamorf, Vulcanic Breccia,
Aglomerate, Sediment Breccia, Conglomerate
2. II Sandstone, AndesiteCBasaltic Tuff, Silt Stone, Arkose,
Greywacke, Limestone
3. III Silt Sand, Mudstone, Marl, FineCGranide Tuff, Shale
4. IV Clay, Mud, Organic Clay, Peat Moss
Source: Ministry of Public Work, Rep.of Indonesia (2007).
Rock classification is divided into 4 (four) classes, class I has the most solid physical structure, and class IV have physical weak or it’s not resistance from ground shaking and slip fault.
2.4.3 Data Preparation and Processing
20
this research were acquired from previous geological and topographic research report. The spatial precision and validation were done by each institution.
Table 2.7 Main data hazard research
No. Information Type of
Data
Scale Source Year of
Published
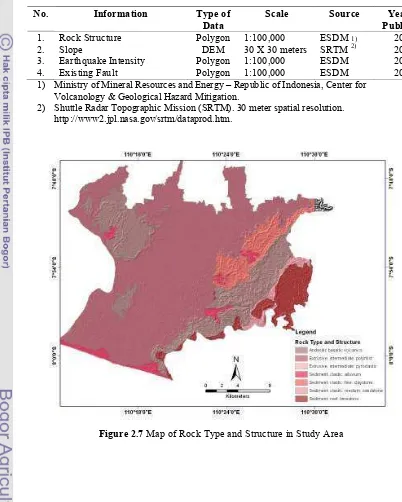
1. Rock Structure Polygon 1:100,000 ESDM 1) 2007
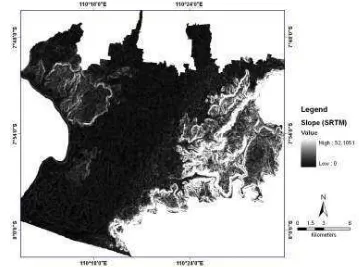
2. Slope DEM 30 X 30 meters SRTM 2) 2007
3. Earthquake Intensity Polygon 1:100,000 ESDM 2007
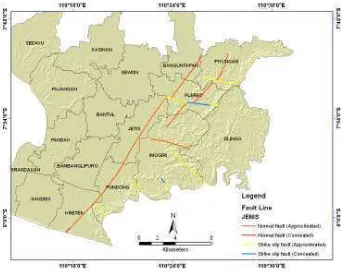
4. Existing Fault Polygon 1:100,000 ESDM 2007
1) Ministry of Mineral Resources and Energy – Republic of Indonesia, Center for Volcanology & Geological Hazard Mitigation.
2) Shuttle Radar Topographic Mission (SRTM). 30 meter spatial resolution. http://www2.jpl.nasa.gov/srtm/dataprod.htm.
21
Figure 2.8 Map of DEM visualization by SRTM in study area
22
Figure 2.10 Map of Fault line in study area
2.4.4 Multi Criteria Analysis
MCDA or could be defined as MCDM (multi criteria decision making) techniques have largely been aspatial (Malczewski, 1999), but they are different in GIS context. Spatial MCDA which is applied in GIS requires both data on criterion values and the geographical locations of alternatives (Malczewski, 1999).
According to Malczewski (1999), the main concept combination between MCDA and GIS is to support the decision maker in achieving greater effectiveness and efficiency. Some technique used to support MCDA in decision making by using decision rules, to choose the best or the most preferred alternatives. There are some decision rules to tackle MCDA/MCDM in this research.
Decision Rules; Weighted Linear Combination
23 compose geological spatial information which has score and weighted value based on reference (Table 2.9). The combination between score and weighted value in geological information determines the level of ground stability. Ministry of Public Work Government of Indonesia (2007) has classified the level of stability into 3 (three) classes which are; not stable, less/moderate stable, and stable. Each class has cumulative score based on the combination between attribute values in geological information (Table 2.8). The equation of hazard analysis related with ground stability shows below:
= ∑ (3)
Where;
Hazard zone based on ground stability, resulted by weighted overlay in GIS
= Total weight rock structure =Total weight slope
= Total weight earthquake intensity = Total weight geological structure
24
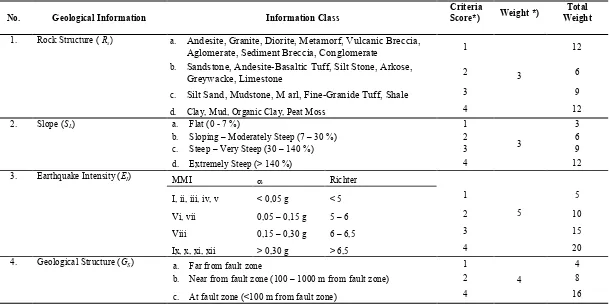
Table 2.8 Weighting Matrix for Area Stability about Ground Stability from Earthquake
No. Geological Information Information Class
Criteria
Score*) Weight *)
Total Weight
1. Rock Structure ( ) a. Andesite, Granite, Diorite, Metamorf, Vulcanic Breccia,
Aglomerate, Sediment Breccia, Conglomerate 1
3
12
b. Sandstone, AndesiteCBasaltic Tuff, Silt Stone, Arkose,
Greywacke, Limestone 2 6
c. Silt Sand, Mudstone, M arl, FineCGranide Tuff, Shale 3 9
d. Clay, Mud, Organic Clay, Peat Moss 4 12
Source: Ministry of Public Work. 2007. Manual Spatial Planning For Mountain Eruption Vulnerability Area, and Earthquake Vulnerability Area.
2
25
Table 2.9 Classification of Weight Value
Weighted Classification
factor with weighted value 3, geological structure is less important than slope factor
in term of the most important information for hazard zone. The capability values
represent the stable conditions from geological hazard. Value equal 1 has means
highest level for the stability related with geological hazard, while on the contrary
with value equal 4, which represents the lowest level for stability (Table 2.10).
Table 2.10 Classification of Capability Value
Weighted Classification
combination. Score rating divided into 3 (three) categories, which are: high stability,
less stability, and low stability (Table 2.11). The total maximum score is 60, and for
minimum score is 15.
Table 2.11 Total Score Classes
Classification of Stability Rating Score
High Stability 15 C 30
Less (Medium) Stability 31 – 45
26 2.4.5 GISFMultiFcriteria Analysis
GIS has long experience in decision making and map design, and it can integrate with
MCDA system to support decision maker’s (Zhao and Garner, 2009). In this
research, GISCMCDA capabilities need to simulate different criteria to make hazard
map. The step in the preparation of spatial modeling after defining criteria; rock map,
slope map, earthquake intensity map, and fault map, it is to define the decision rules
and weighted value for each criterion (Figure 2.11), after that simulated in spatial
analysis by used raster calculator. The result spatial analysis was hazard map.
Figure 2.11 Schematic diagramGIS hazard modeling
2.5 Result and Discussion
This chapter presents the hazard map resulted from reCclassification rock and slope
from DEM (SRTM), earthquake intensity map, and fault path map. Spatial simulation
to produce hazard map use spatial analysis with multi criteria analysis method. The
process in combining all maps with spatial analysis using simply weighted method as
decision rules.
2.5.1 Rock Type and Structure
Almost all area in Bantul is classified in rock type and structure high stability from
earthquake (Table 2.6), but we should care in some spot area. District of Imogiri,
Kretek, Pajangan, Pleret, Sanden, and Srandakan have low stable area and they have
27
potential hazard when earthquake occurs (Table 2.12). Especially for district of Pleret
and Pajangan were categorized as urban areas.
Figure 2.12 Rock Capability Class
Table 2.12 Rock Stability Distribution
28 2.5.2 Slope
Topographical Bantul area has the characteristic as a coastal area in South Java;
inclined flat. Generating from DEM from SRTM with 30 × 30 meters shows almost
all area has 0C7% inclination (Figure 2.13). Steep area in Bantul located in east side
which was abutted with Gunung kidul Regency. Slope in east side of Bantul area
several dominated 7C30% or moderate steep, and only small area covered with slope
more than 30%. Another steep area was located in east side, especially in Pajangan
and Sedayu districts.
Figure 2.13 Map of slope classification in study area
2.5.3 Earthquake Intensity
Bantul is classified into 2 (two) earthquake intensity areas; north side has VCVI MMI
29
Bantul has dangerous potential from earthquake hazard, the effects from earthquake
can collaps, damage, and move the masonry’s frame.
Figure 2.14 Map of earthquake intensity in study area
2.5.4 Distance from the Opak’s Fault
Bantul area has Opak’s fault way longitudinal from south to north, which is a
potential danger in that area. Theoretically, around Opak’s fault is a weaker area than
others area without fault, because if the earthquake occurs, that place will fault in
plate; vertically or horizontally. Surface faulting categorized in primary seismic
hazard (FEMA) which will trigger hazard continuation like ground failure, landslide,
tsunami, and liquefaction.
The distance from fault determines the damage level caused by earthquake; only the
one that close to fault can hit primary the effect of an earthquake. Ministry of Public
Work (2007) has classified them into 4 (four) distance class from fault to describe
the existence of fault; less than 100 meter, between 100C1000 meter, and more than
30
1 to 4, where small value represents close distance with fault way (< 100 meter), and
contrary value (value=4) is restrain from fault way (> 1000 meter). Buffer analysis
area was used to implement the level of hazardous area in fault map.
Figure 2.15 Map of Distances from Fault
2.5.5 Hazard Analysis: Ground Stability Model
The result for simulating hazard map has the range between 20 C 49 score value
(Figure 2.16), which means for the minimum score reached in score 20, and for
maximum score reached in score 49. The visualization in hazard map show green
color representing high ground stability, and red color representing area with low
ground stability (Figure 2.16).
Based on stability rating in table 2.11, the first result hazard map reCclassified into 3
(three) scenario hazard zone; low stability, medium stability, and high stability
(Figure 2.17). Statistical hazard zone describes the majority level of ground stability
is medium. The second majority of ground stability is high stability, and then the rest
31
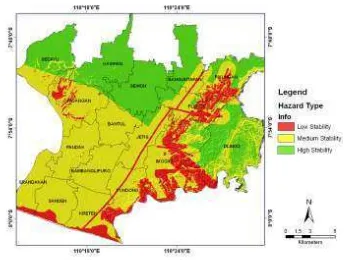
Figure 2.16 Distribution Ground Stability (Hazard) Map
32
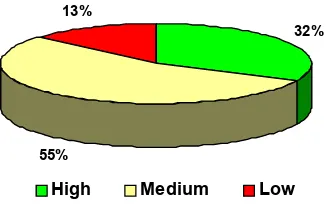
Figure 2.18 Percentage level of ground stability in research area
Those facts describe half area should be considered carefully from earthquake hazard,
especially for low and medium stability area. The explanation is the combination of
earthquake intensity factor and fault impact area causes medium and high value. Most
of the research areas are potential hazardous area, and it is important to get more
attention. The probability loss impact in research area is medium to high, when the
vulnerability aspects haven’t got more attention. With that reality, it can be predicted
where the suitable location which is safe for living and activities.
The point of interest in this research is a very hazardous area which longitudinally
cracked by Opak’s fault. The impact of earthquake in fault line caused heavy damage
for structure in the surface. Closeness to fault line area cannot be avoided although
we have implemented high technology for structure, in the same manner as explained
by Bell (1999). Totally 13% areas are close or get high impact from fault line, and in
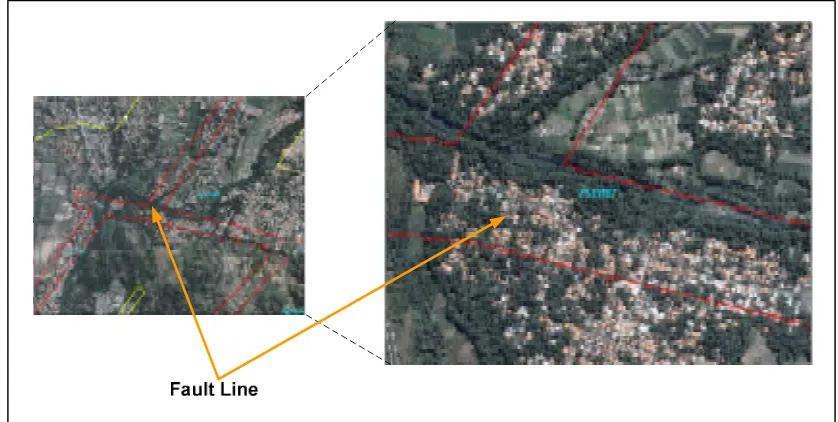
fact that area is majority classified into settlement area (Figure 2.20). Illustration in
Figure 2.19 shows the distribution of settlement areas in fault line located in Pleret,
Jetis, and Imogiri. In those areas there are lots of house buildings and built up
environment (road, drainage, etc.).
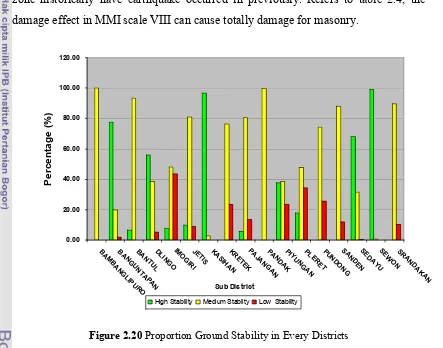
The proportion analysis for hazard level in every sub districts shows overall ranking
for hazard level. To identify the hazardous area, we started from areas which have
33
Banguntapan, Sedayu, Pandak, and Bambanglipuro are classified into potential
hazardous area (Figure 2.20).
Figure 2.19 Area where is in place fault line (area insert in double red line)
Especially in Imogiri, Pleret, Pundong, Kretek, Piyungan, they have low ground
stability more than 20 percent (Figure 2.20). The close factor from fault line, steep
area, and high earthquake intensity caused the high total score.
The second hazardous areas are located and distributed in almost whole Bantul area.
The most area which covered by medium ground stability are Bambanglipuro,
Pandak, Bantul, Srandakan, Sanden, Jetis, Pajangan, and Pundong. Those areas have
medium stability area percentage of over 50% and may even exist over 90%. The
medium ground stability area means that area has less ground stability, or it cannot be
defined as permanent stable area.
Comparing two areas such as Imogiri and Bantul, it determines that Bantul is not
really safe area. The difference of those two areas is Bantul is situated for away from
34
probability for both areas are same (figure 2.14). Bantul also has almost flat
topography while Imogiri has a very steep topography. Physical characteristic of
Bantul is also similar with Pandak and Bambanglipuro which are located in flat
topography but it has high earthquake intensity.
Bambanglipuro, Pandak, Bantul, and others area, which are located in MMI VIII,
zone historically have earthquake occurred in previously. Refers to table 2.4, the
damage effect in MMI scale VIII can cause totally damage for masonry.
Figure 2.20 Proportion Ground Stability in Every Districts
The high stability area in research study is represented by district such as Sewon,
Kasihan, Banguntapan, Sedayu, and Dlingo (Figure 2.20). Those areas have over
50% which classified into stable area. The affecting factors relates to stability areas
are the physical characteristic areas which haven’t fault line, flat topography, and the
compactness of rock structure. Several areas should get attention although classified
into stable area. For example, Dlingo, Piyungan, Pajangan, and Pleret also have low
35
stability area. The level of earthquake intensity for stable area is still classified in
dangerous situation; in level V to VI MMI can be felt by all and low to medium
potential damage for structure and built up environment.
2.5.6 Comparative Model of Hazard with the Facts on The ground
Although several locations such as Sewon, Kasihan, and Banguntapan are classified
into high stability, they are not totally free from earthquake impact. The previous
earthquake research and evidence shown in Bantul and whole Jogjakarta Province are
susceptible from earthquake hazard. That fact can be described in preCassessment
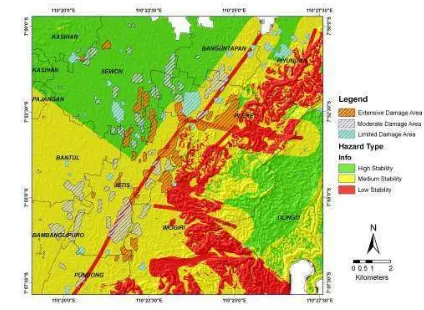
damage area developed by United Nations Institute for Training and Research
(UNITAR) in 2006, which the damage impact of earthquake was distributed in
random (Figure 2.21).
36
The figure 2.21 shows the location of damage in the event of an earthquake in 2006.
Survey conducted at some point the damage location and damage pattern looks great
in the location near the fault in particular. District of Jetis, which located near fault
has experienced of most damage area. Level of damaged started from limited level
into extensive level. Another district which has damaged area was Pleret, Piyungan,
Pundong, Imogiri, Bantul, Pundong, Sewon, and Bambanglipuro. District of Pleret,
Sewon, and Imogiri has similar level of damaged area, which consist for all level of
damaged.
The location of damaged area was majority classified into medium and low stability
area. District of Jetis, Pleret, Imogiri, Piyungan, Pundong and Banguntapan has low
stability area which influenced from fault line location. The conditions exacerbated
by the number of activities centered in the area, for example District of Jetis, Pleret,
and Banguntapan has many economic activities and settlement area. Those districts
have attached Opak’s fault lines which right in the location of economic activity and
population settlements.
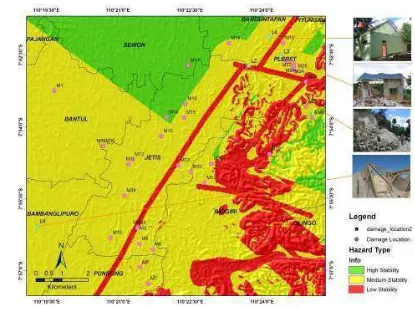
Ground checking activity used GPS shown that the location of damage is similar to
the observation by UNITAR in 2006 (Figure 2.22). Two kind’s data was used, first
developed by EERI (2006), and field survey activities part of this research in June
2009. Earthquake Engineering Research Institute (EERI) survey activity, which
coded naming L1 up to L6 shown damaged distribution in several area. The picture
on that point described about damaged effect in houses (L4, L3, and L6) and caused
landslide (L2). District of Jetis, Pleret, and Bambanglipuro included in the area were
severely damaged by the earthquake.
Activity field survey in June 2009 showed the former location of damage in some
places, which coded naming M1 up to M33 (Figure 2.22). Implementation of a survey
conducted with the help of local community guide in several districts. The former
37
Imogiri, Pleret, Piyungan, and Banguntapan. The survey results in 2006 did not much
different results of 2009 survey, which location affected by earthquake.
Yogyakarta media center in 2006 had recorded victims and structure damaged in
Bantul and Yogyakarta area. Some districts have high number of loss and located in
medium and low stability area (Figure 2.23), for example; District of Jetis, Pleret,
Imogiri, Pundong, Bantul, and Bambanglipuro. This fact proves that the relationship
between the level of ground stability and the large number of casualties. This was
caused in these areas are close to the location of faults or fault, besides that there are
many areas of housing and services.
38
Another fact which explains the relationship between the level of ground stability and
the amount of damage structure is a map of the distribution of building damage
(Figure 2.24). The attribute data was developed by Yogyakarta Media Center in 2006,
which recorded all damaged structure after earthquake occurs. The District of Bantul,
Jetis, Bambanglipuro, Pandak, Imogiri, Pleret, and Dlingo has the high number of
building damage. The area is largely into the category of low and medium stability
especially be passed by fault line.
39
Figure 2.24 Graphic map of the distribution of building damage during the Yogya earthquake 2006
2.6 Conclusion and Recommendation
2.6.1 Conclusion
The conclusion are described and structured in line with objective of this research.
• Based on the map analysis, the high stability of the land due to absence of fault
factors in addition to steep slopes and rock structures that support. Areas
categorized as having a high degree of stability such as District of Sewon and
Kasihan.
• Fault way is a major factor in increasing the value of disaster of a region, this is
evidenced by the number of victims killed or injured and damage to buildings.
40
exemplified in the district of Pundong, Imogiri, Pleret, Piyungan, and
Banguntapan.
• The second cause of a decreased level of ground stability is influenced by factors
of slope, where the steep increase disaster factor. Slope factor as stated in earlier
studies may lead to further disasters in the form of landslides or rock avalanches.
Imogiri are examples of areas with steep slopes that have a low degree of ground
stability or in general in the east of Bantul Regency.
• The prevalence of deaths, injuries, and destruction of buildings at all levels of
ground stability possible existence of high vulnerability factor, especially in areas
categorized as having high stability factor, for example in District of Sewon and
Kasihan. Assessment of the level of disaster related to the fact the number of
casualties and damage requires understanding the concept of vulnerability.
• The resulting map is still too general as this disaster database because there is
still no availability of data in detail scale. Possible differences in accuracy also
led to a general outcome.
• Determination of criteria for disaster needs further study include the use of
scoring and weighting that may only be applied in the study area.
• Involving local communities in the field survey and supported the GPS device is
helpful in assessing the accuracy of maps of disaster.
2.6.2 Recommendation
Some recommendations for further investigation are related to hazard analysis:
1. It is necessary to scale geological map in more detail to improve the accuracy of
disaster prone areas.
2. Necessary to identify early on the impact of further disasters like landslides due
41
CHAPTER III
Vulnerability Analysis in Urban Area Related
Earthquake Hazard
3.1 Introduction
Increasing growth population followed by physical development in built up area will
increase susceptibility and probability earthquake impact in urban area. The
centralization activities in urban area can trigger urbanization which shows in
migration phenomena. Rapid urbanization in the world cause 50 percent population
will dwelling in the cities, and expected to be absorbed by the urban areas of less
developed regions (UNEP, 2007).
The importance to identify the vulnerability factor in urban area will protect people,
before the hazard occurrence, and prepare precaution for them (Haki, 2004).
The impact history of earthquake in urban caused the damage of the life system and
espeacially caused many casualities. The experiences about impact of earthquake in
urban area are the occurences in NAD (2004), BantulCSpecial Region of Yogya
(2006), Tasikmalaya (2009), and Padang (2009). The damage of life system is related
to vulnerability factors such as physical, socioCeconomic, demographic, and etc.
The analysis processes of vulnerability were classified in several factors such as
physical, demographic, and social. Physical factors in terms of disaster were
associated with everything built by humans. Demographic factors associated with
resident population of an area where increasing population and the intensity in a
region highly affected, while social factors were closely related to the ability of the
community in case of disaster. Vulnerability factors is vast and varied for a given
region, the selection of vulnerability factors depend on the characteristics of the study
42
GIS has the capacity to perform spatial simulation by combining multiple layers of
spatial information. By leveraging the advantages of GIS, it is possible that
vulnerability is made to be maps that combine the spatial distribution of physical,
demographic, and social factors.
3.2 Objective of Research
The objective of research is to determine vulnerability area based on physical,
demographic and social factors using multiCcriteria analysis, and simulation in GIS.
3.3 Literature Review
Vulnerability is characteristics and circumstances of a community, system or asset
that make it susceptible to the damaging effects of a hazard (ISDR, 2009). It is
important to understand about level of vulnerability which is vulnerability influenced
by strength disaster factor, because disaster will occur in the vulnerable situation
(BNPB, 2007). Level of vulnerability can be considered into 3 (three) types:
1. Physical Vulnerability; relating to vulnerability for regional infrastructure like
density of building, percentage of built up area, percentage of building,
emergency construction, road network, communication network, and etc.
2. Social Vulnerability describing about level of social fragility to facing hazard.
Several indicators for social vulnerability are density of population, growth rate
population, and gender (female) percentage.
3. Economic Vulnerability describing about level of economic fragility to facing
hazard. Some indicators for economic vulnerability are poor household and
worker.
Comprehension about vulnerability is very various meaning depend on scientific
groups (Taubenbock, 2008), and the discussion is still continue and did not reach
precisely (Birdman, 2006a) in Taubenbock, . (2008). Refer to Taubenbock
43
wide ranging criteria such as demographic, political, and ecological aspect. The
specific vulnerability criteria explained by CASITA (2004) which cultural of the
people become a part of vulnerability.
3.4 Vulnerability Analysis
3.4.1 Method of Research
The method of research vulnerability mapping is shown in figure 3.1. The first part of
method is review and identify vulnerability criteria related earthquake hazard. The
review was based on literature and experiences from scientific groups, and the
selected vulnerability criteria used to analysis process in this research. The second
part of method was assigned weight value for every criterion. The pairwise
comparison method (PCM) was used to produce weight value. The final part of
method was to implement vulnerability model in GIS spatial analyst, which combines
logic arithmetic from spatial attribute and used weighted overlay method.
Figure 3.1 Schematic diagram of vulnerability mapping methodology
3.4.2 Determine Vulnerability Criteria
Vulnerability criteria is important in vulnerab ility process, which is not simple to
44
groups. The general rule to selecting criteria is comprehension about problem
identification for getting better response (Malczewski, 1999). Furthermore, according
to Malczewski (1999) criteria should close related between decision model and the
problem situation, also consider about number of criteria which suggest taking small
number criteria (oversimplification). Oversimplification about number of criteria
have goal to reach data availability and quality.
Refer to Malczewski (1999), the technique for selecting criteria may be developed
through an examination of the relevant literature, analytical study, and opinions. For
this research study, the examination of the relevant literature was used to select the
vulnerability criteria. The references has been using from government documents,
scientific journal, and scientific reports. Some scientific journal and government
report was result from field experiences such as CASITA (2004), Taubenbock (2008),
FEMA (2000), BNPB (2007), Cutter, Mitchell, and Scott (2004), Cutter, Boruff,
and Shirley (2003), ERA (2008), Rashed, and Weeks (2003), and DGMAE (2004),
which is all criteria/sub criteria for vulnerability was validate in the field by them.
After examination the relevant vulnerability literature, comprehension relation
between model and problem situation, and consider about data availability and
quality has been chosen some criteria for research study;
a. Physical Vulnerability
Physical vulnerability is related with vulnerability for regional infrastructure like
density of building, percentage of built up area, percentage of building, emergency
construction, road network, communication network, and etc. In this research,
physical vulnerability was developed from combination density of built up area,
45 b. Demographic Vulnerability
Demographic vulnerability is close related with probability for people affected by
earthquake hazard, when the earthquake occurs people may death, injury, infected by
disease, and suffer from stress (CASITA, 2004). The scale of demographic
vulnerability can observe based on urbanCrural area typology, which urban area have
the high vulnerability as compared to rural because most population concentrate in
urban area. Likewise in Bantul regency, some sub districts are including in urban
area. In this research, demographic vulnerability was developed from combination
total population, density population, and growth rate population.
c. Social Vulnerability
Social vulnerability is described about the people and their community ways of life.
The conceptual social vulnerability related with marginalized people due to the
impact of a disaster (CASITA, 2004). Refer from CASITA (2004), the concept of
marginalized is who the weaker sections or groups or part of society, there are based
on economical class, ethnicity, religion, gender, and age. In this research, low income
(represent poor people), female distribution, and age (elderly and children) are basic
for social vulnerability analysis.
The relevant reason for every criteria and sub criteria are explained based on some
literature Table 3.2).
3.4.3 Main Data for Research
The research study has several main spatial data (Table 3.1). The data based on vector
data with data attribute. Some data has been developing with use administrative unit
(sub district) for unit analysis, for instance density population distribution, and
46
Table 3.1 Main Data for Research
No. Information Type of 2.2 Number of Structures 2) Polygon 1:25,000 Gov. of Bantul 2008 2.3 Type of Structure 2) Polygon 1:25,000 Gov. of Bantul 2005
II. Demographic 2)
3.1 Total Population Polygon 1:25,000 Gov. of Bantul 2008 3.2 Population Density Distribution Polygon 1:25,000 Gov. of Bantul 2008 3.3 Population Growth Rates Polygon 1:25,000 Gov. of Bantul 2008
III. Social 2)
4.1 Low Income Population Distribution Polygon 1:25,000 Gov. of Bantul 2008 4.2 Gender (Female) Polygon 1:25,000 Gov. of Bantul 2008 4.3 Age (Elderly and Children) Polygon 1:25,000 Gov. of Bantul 2008
Note:
1) National Coordinating Agency Surveys and Mapping (Bakosurtanal)
2) BPS – Statistics of Bantul Regency.
3.4.3.1 Data Preparation
Process to preparing spatial data for vulnerability started from collecting relevant
statistical data with research study. The list of statistical data and the source explain
in Table 3.1. After collecting statistical data, the next step is adding to attribute GIS
data, and then the latest step is visualizing in map (Figure 3.3). The district
administrative boundary was used as spatial unit analysis. The kinds of vulnerability
map are show in Figure 3.4, Figure 3.5, Figure 3.6, Figure 3.7, Figure 3.8, Figure 3.9,
Figure 3.10, Figure 3.11, and Figure 3.12. Statistical data relating to the
vulnerabilities contained in appendix 5.
47
Table 3.2 Description of Vulnerability Criteria
No Criteria Sub Criteria Description Sources
1. Physical BuiltCup Density The high percentage of built up area from total area is indicate high vulnerable when earthquake occur. Significant structure losses might be expected from hazard event. Limited access to open space or safety area will increase number of injured and death victim.
Taubenbock (2008), Cutter, Boruff, and Shirley (2003)
Number of Structure
The number of structure in a certain area increasing probability for damage structure or totally collapse, which endanger for people when the material from the building struck down.
Taubenbock (2008), CASITA (2004), ERA (2008)
Type of Structure Structure without well construction design for earthquake can cause high damage for the structure.
Taubenbock (2008), CASITA (2004), ERA (2008)
2. Demographic Total Population The high total number population increasing injured may even death victim. Growth Population Area experiencing rapid growth lack available quality housing,
and the social service network.
Cutter, Boruff, and Shirley (2003), Taubenbock (2008) 3. Social Low Income
People Distribution
Low income people did not have many resources to preparing for earthquake hazard. For example; low income people cannot build house resistance from earthquake. emergency actions to protect themselves during earthquake.
48 Physical Criteria
Figure 3.3 Built Up Density Figure 3.4 Total Number of Structure
Figure 3.5 Type of Structure
Demographic Criteria
Figure 3.6 Total Population Figure 3.7 Density Population
Figure 3.8 Growth Population
Social Criteria
Figure 3.9 Low Income Figure 3.10 Female Distribution
49 3.4.3.2 Data Processing
First step for data processing is to standardize the entire number of attributes in every
criterion so that all have value between 0 to 1. Standardized criterion numbers of
attribute have objective transform various criteria into comparable units (Malczewski,
1999). There are many methods to standardized criterion map, and one of the ways is
using linear scale transformation (Malczewski, 1999). Benefit criterion is used as
new values which the higher score (score=1) represent the better performance, and
contrary (score=0) is worst performance.
The Benefit Criterion Equation (Malczewski, 1999);
′ =
(4)Where;
X’ij = standardized score for the th object (alternative) and the th attribute
Xij = the row score
Xi max= the maximum score for the th attribute
For example; in the Figure 3.4 is show existing condition for built up density in
research study. The highest number (score=1) indicate area have high built up
density, in that figure also show in color gradation, which is dark color represent have
high number, and bright color represent have low number. All vulnerability maps
were transformed into grid system to compatibility in spatial analysis process. The
grid size was used 30 x 30 meters, which adjusts the size of the SRTM spatial
resolution.
3.4.4 Multi Criteria Analysis
The vulnerability analysis in this research is using spatial multi criteria decision
analysis (Spatial MCDA) as decision rules. MCDA or could defined MCDM (multi
criteria decision making) techniques have largely been aspatial, but it different in GIS
50
the geographical locations of alternatives (Malczewski, 1999). For this research,
concept of vulnerability analysis is assigning weighted criteria using multiCcriteria
analysis, which is using pairwise comparison method (PCM).
!"= Σ # Bd +# Ns + #Ts (5)
!$= Σ #%Tp +# Pd + # Tg (6)
! = Σ # Li +# Fe + # Ag (7)
!& = Σ #"!" #$!$ # ! (8)
Where;
!" = Physical Vulnerability
!$= Demographic Vulnerablity
Li = Low income population distribution
Fe =Total female
Ag =Total elderly and children age
= number of indicators and their weights
# = individual weighting factors for each indicator
#" individual weighting factor for physical vulnerability
#$ individual weighting factor for demographic vulnerability
# individual weighting factor for social vulnerability
3.4.4.1 Pairwise Comparison Method (PCM)
Pairwise comparison method was developed by Saaty (1991) as part of analytical
hierarchy process (AHP) concept for multiCcriteria decision approach. The main
concept for PCM is involves oneConCone comparisons between each of Indicators
(CIFOR, 1999). The comparison between each indicator asked from expert teams,
which have objective to make comparative judgment on the relative importance of
51
Therefore numerical values expressing a judgment of the relative importance (or
preference) of one factor against another have to be assigned to each factor. Saaty
(1988), suggested a scale for comparison consisting of values ranging from 1 to 9
which describe the intensity of importance, where by a value of 1 expresses “equal
importance” and a value of 9 is given to those factors having an “extreme
importance” over another factor (Table 3.3).
Table 3.3 Pairwise Comparison Scale
Intensity of Importance Description
1 Equal importance
3 Moderate importance of one factor over another
5 Strong or essential importance
7 Very strong importance
9 Extreme importance
2,4,6,8 Intermediate values
Reciprocals Values for inverse comparison
The simple comparison between criteria describe in simple matrix comparison, which
is form in order 3 where three criteria C1, C2, and C3 are compared against each
other. For instance; criterion C1 has been regarded strongly more important than C3,
hence a value of 5 has been assigned to the corresponding matrix position. The
transpose position automatically gets the reciprocal value, in this case 1/5 which
equals 0.2 (Table 3.4).
Table 3.4 Example of a pairwise comparison matrix
Criteria C1 C2 C3
C1 1 7 5
C2 0,14 1 0,33
C3 0,2 3 1
52
The next step of the calculation process, the assigned preference values are
synthesized to determine a ranking of the relevant factors in terms of numerical
values which are equivalent to the weights of the factors. Therefore the eigen values
and eigenvectors of the square preference matrix revealing important details about
pattern in the data matrix are calculated.
3.4.4.2 Consistency Ratio (CR)
Some experience in AHP process, the values of the pairwise comparison matrix will
normally be well considered and not set arbitrarily. However, people’s feeling and
preferences remain inconsistent and intransitive and may then lead to perturbations in
the eigenvector calculations (Marinoni, 2004). Saaty (1986) defined a consistency
ratio (CR) as a ratio of the consistency index CI to an average consistency index RI,
thus;
=
(7)
RI or resulting average consistency index, also called the random index, was
calculated by Saaty (1986) as the average consistency of square matrices of various
orders n which he filled with random entries.
3.4.4.3 Aggregate Individual Response
When we faced multidiscipline expert with various judgments, it’s important to
checking one by one those consistency of judgments. After that process, the selected
result has good consistency should merging into one value. To merging values of
expert judgment use geometric mean method (Marimin, 2008):
G