STUDY ON TEMPERATURE, RH AND AIR FLOW VELOCITY DISTRIBUTION INSIDE THE GREENHOUSE EFFECT SOLAR DRYER
WULANDANI, D., K. ABDULLAH, E. HARTULISTIYOSO
Department of Agricultural Engineering, Faculty of Agricultural Technology, Bogor Agricultural University (Phone/Fax. 0251-623026, e-mail:<[email protected]>)
and A. I. SISWANTARA
Department of Mechanical Engineering, Faculty of Engineering, University of Indonesia
ABSTRACT
Greenhouse Effect (GHE) Solar Dryer is a transparent wall structure, consists of absorber plate as solar heat collector, product holders (rack, tray or batch) and fans to discharge moisture from the drying product. GHE Solar dryer is one of the alternative for the farmer and merchants to improve the quality of dried products. Direct sun drying is still popular choice by farmers because it is cheap and simple. However, the method is greatly dependent on the existence of solar irradiation, and the product is contaminated very easily by pollution and dirt. The general constraint in designing artificial dryer is the problem of non-uniformity of final moisture content of product, especially for the rack type dryer. This is influenced by three important parameters of drying; temperature, relative humidity (RH) and airflow velocity of drying air. Therefore, in this study, such problem was approached by conducting flow simulation within the drying structure using computational fluid dynamics (CFD) to determine the proper position of drying air inlet and outlet, location and capacity of the heat exchanger unit as well as the position and capacity of the fan, and finally to obtain the uniformity of temperature, RH and airflow velocity.
I. INTRODUCTION
Greenhouse effect (GHE) solar dryer is a rectangular structure, which utilizes the effect of long wave radiation trapping by transparent walls to increase drying temperature inside the structure. Blackened metal sheet laid on the chamber floor functions as heat absorber and collector. The transparent wall can be made of polycarbonate, UV stabilizer plastic, glass-fiber or polyethylene plastic. Trays as product holder are placed in the center of structure to provide even distribution of air flow, temperature and RH within the chamber. During the night or in rainy seasons, auxiliary heating can be made available using hot water from a hot water storage tank heated by a biomass stove. The hot water in turn is passed through a heat exchanger placed on the chamber floor. The significant problem in mechanical drying was on how to keep the uniformity of the final moisture content of product, especially for the rack type dryer. This is influenced by the three important parameters of drying; temperature, relative humidity (RH) and airflow velocity of drying air.
Previous study using rack type Greenhouse Effect (GHE) solar dryer had indicated that the non-uniform distribution of drying air temperature, RH and air velocity within the drying chamber was probably due to the improper location of air inlet and outlet openings and the position of the fan. Such problems had resulted in non-uniformity of moisture content of final dried product. In addition, improper positioning of the air inlet and outlet openings had caused substantial loss of heat to the surrounding environment rather than making good contact with the product to be dried. Mursalim ( 1995) had found that for the case of vanilla drying, the largest temperature difference of the
product placed within the racks was 10 degree C, with the lowest air temperature of 40oC located at the middle rack and 50oC at the bottom rack. Sukarmanto (1996) in the drying experiment using sea weeds, had capable to reduce the temperature difference by 4 degrees C between the products temperature placed in the middle racks recorded at 31oC and 35oC for those at bottom racks. Air flow distribution within a laboratory scale GHE solar dryer was studied by Lesmana (2001). She used several thin threads to indicate airflow direction within the chamber and made several possible arrangement of fan position within the chamber by trial and error method. Result of the study showed that two exhaust fans at the outlet position yield a better airflow uniformity as compared to one exhaust fan of same fan power.
In order to improve the operating condition further, a more thorough study using fluid dynamics and heat transfer analysis had been conducted in our study. The approach used an effective tools of CFD modeling as applied to the GHE solar drying. For this purpose, appropriate governing equations were developed and their numerical solution was accomplished using the finite volume discretization method based on three governing equations; continuity, momentum and energy equation. In this study a CFD model was used to determine air velocity and temperature distribution under different arrangement and location of the fan as the moisture moving device.
II. EXPERIMENTAL SET UP
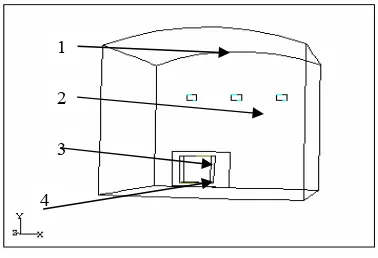
angle frame on a 0.9 m x 0.9 m square floor. The height of the whole structure
was 0.84 m. The location of the inlet and out let openings (2) as well as that of
the fan were adjustable so that different flow pattern could be obtained for different flow arrangement. Solar irradiation was generated using tungsten lamp placed on a movable steel frame which could be moved to simulate solar radiation in a day. The primary air inlet has a dimension of 0.012 m x 0.012 m on one side of the structure. A 16 W fan (4) was placed in front of the inlet. Three rectangular outlets on the opposite side of the wall (2), each has a dimension of 0.03 m x 0.05 m. A heater was installed in front of the center inlet (3).
Temperature and relative humidity were measured using CA thermocouple sensor and recorded by Chino-recorder (YOKOGAWA). Air velocity was measured using hot wire sensor
anemometer (KANOMAX). Measurements then were made 70
positions within the chamber. Measurement position of temperature, relative humidity and velocity in the chamber was taken at the cross section of the y-z plane, at x = 450 mm.
III. RESULTS AND DISCUSSIONS
Airflow simulation was conducted using CFD model aided by software FLUENT 5.3 and GEOMESH 3.4. The simulation was accomplished in two steps: 1) Simulation of air flow within laboratory scale GHE solar dryer model; 2) Airflow simulation of actual GHE solar dryer to determine the proper position of drying air inlet and outlet, location and capacity of the heat exchanger unit as well as the position and capacity of the fan, and finally to obtain the operating condition which can produce uniformity in temperature, RH and airflow velocity.
Figure 1. Schematic drawing of laboratory scale of the GHE solar dryer 3.1. The Boundary Condition, Initial Condition And Assumption for the CFD model
The boundary condition and input data were defined as follows:
1) Air velocity at fan inlet was set at 2.3 m/s based on the airflow need to remove moisture from product. The rectangular outlet was defined as outflow.
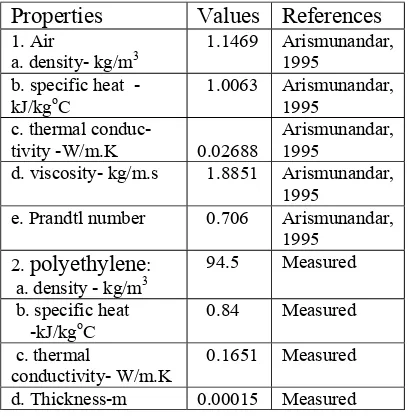
2) The heat exchanger dimension was 0.20 m x 0.16 m. Hot water at 80oC was supplied from a hot water tank to the heat exchanger pipe. The air temperature leaving the heat exchanger was 58oC. The air temperature inflow to the heat exchanger was 30oC. The overall heat transfer coefficient of heat exchanger was 426 W/m2. The transport properties of fluid and thermal properties of the material used in the CFD model are given in Table 1.
2
3
Table 1.Thermal properties of air and polyethylene sheet
Properties Values References
1. Air
a. density- kg/m3
1.1469 Arismunandar, 1995
b. specific heat -kJ/kgoC
1.0063 Arismunandar, 1995
c. thermal conduc- tivity -W/m.K
0.02688
Arismunandar, 1995
d. viscosity- kg/m.s 1.8851 Arismunandar, 1995
e. Prandtl number 0.706 Arismunandar, 1995
2. polyethylene: a. density - kg/m3
94.5 Measured
b. specific heat -kJ/kgoC
0.84 Measured
c. thermal
conductivity- W/m.K
0.1651 Measured
d. Thickness-m 0.00015 Measured
The initial condition was defined as follows:
1) The air velocity at the wall on the x, y and z direction were 0 m/s.
2) The initial temperature of the wall were the same as the ambient temperature of 30oC.
3) The initial air pressure of drying room was at the atmosphere pressure of 1 atm. or 101.325 kPa.
Assumptions made for the CFD model were
1) Density of the air constant
2) Uniform air velocity along the cross section of the fan
3) Airflow was laminar and at steady state condition. The value of (Grashoff x Prandtl) number was 4.40 x 10⁸ (for laminar flow : 104 < (Gr Pr) < 109) and Reynolds number on the inlet was 5247.
3.2. Air Flow Analysis with actual GHE solar dryer
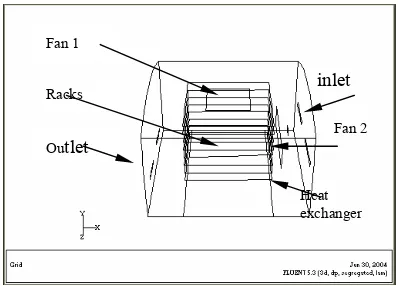
The GHE solar dryer used in this study had the following dimension, floor area 3.6 m x 3.6 m and height of 2.4 m. Two air inlet and two outlet openings with rectangular geometry each with 0.1 m x 1 m and 0.7 m x 0.15 m cross section, respectively, were placed at the front and at the opposite side of the wall of the structure. Eight square-racks with 2 m dimension in one side was place in the center of the structure.. Two electric fans were available and could be arranged to meet the requirement of each three operating scenarios set up for the purpose of this study. Figures 2, 3 and 4 describe the three operating scenarios:
Scenario 1. Inlets at the position 1.6 m from the ground are placed on one side of wall. Outlets at the position 0.75 m from the ground are placed on the other wall.
Scenario 2. Inlets at the position 1 m from the ground are placed on one side of wall. Outlets at the position 1.62 m from the ground are placed on the other wall.
Figure 2. Scenario 1. Outlet on the right
Figure 3. Scenario 2. Out let shifted to the left
Figure 4. Scenario 3. Auxiliary fan 3 on top of racks
IV. RESULTS AND DISCUSSIONS
4.1. Temperature, RH and air velocity distribution within Laboratory model
Figure 5 shows the comparison between the measured temperature and the predicted CFD temperature on the yz plane at x = 400 mm. According to the data described on Figure 5, the standard deviation of temperature was 1.2degree C. Figure 6 describes the comparison in airflow velocity, and Figure 7 shows for RH, respectively. The standard deviation of airflow velocity was 0.2 m/s and that of RH was 2.3 %. There were little differences between measurement and the predicted temperature, velocity and RH distribution using CFD.
30 32 34 36 38 40 42 44 46 48 50
0 20 40 60 80
Position of node on yz plane at x = 400 mm
T
e
m
p
er
atu
re
(C
)
T-measurement
T-CFD
Figure 5. Distribution of air temperature using CFD as compared to experimental data
0 0.5 1 1.5 2 2.5
0 20 40 60 80
Position of node on yz plane at x = 400 mm
V
e
lo
c
it
y
(
m
/s
)
v-measurement v-CFD
Figure 6. Distribution of airflow velocity using CFD as compared to the measured airflow velocity
Racks Fan 1
Outlet
Outlet
inlet
Fan 2
Heat exchanger
20 25 30 35 40 45 50 55 60
0 20 40 60 80
Position of node on yz plane at x = 400 mm
RH (
%
)
RH-measurement RH-CFD
Figure 7. Distribution of RH as predicted by CFD as compared to measurement data of RH
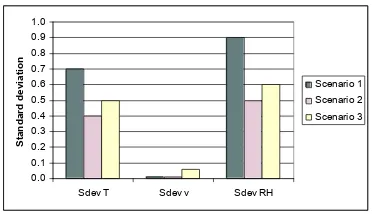
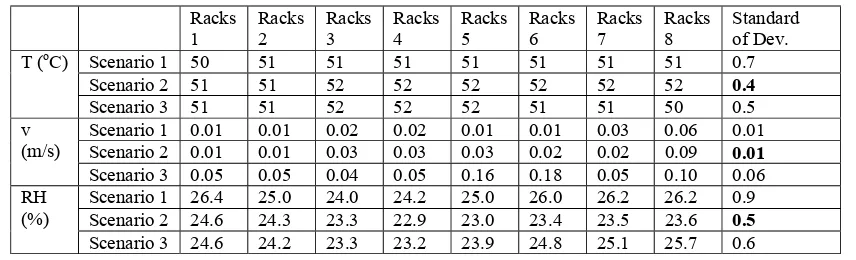
4.2. Temperature, RH and air velocity distribution in actual GHE Solar Dryer Data used for simulation different strategies to obtain optimum operating conditions in the actual GHE solar dyer are listed in Table 2 in the Appendix 1. Using these data analysis of temperature, RH and air flow distribution within the GHE solar dryer was conducted for the 3 scenarios. Figure 8 shows the comparation of standard deviation of temperature, velocity and RH among the three scenarios.
0.0 0.1 0.2 0.3 0.4 0.5 0.6 0.7 0.8 0.9 1.0
Sdev T Sdev v Sdev RH
S tan d a rd d evi ati o n Scenario 1 Scenario 2 Scenario 3
Figure 8. Standard deviation of temperature, velocity and RH of the three scenarios.
From these analysis it was found that Scenario 2 showed the smallest standard deviation in air temperature 0.4degree C, air velocity, 0.01 m/s and RH 0.5%, for temperature, velocity and RH, respectively. Therefore, it was recommended that design
configuration of a rack type GHE solar dryershould follow configuration as specified in Scenario 2.
4.3. Distribution of Temperature and Airflow Velocity inside a GHE Solar Drying of the Design Scenario 2.
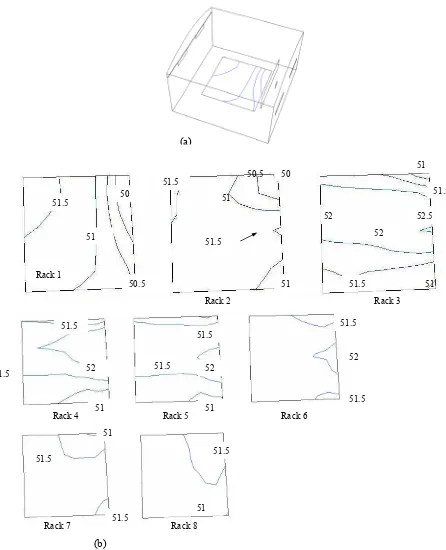
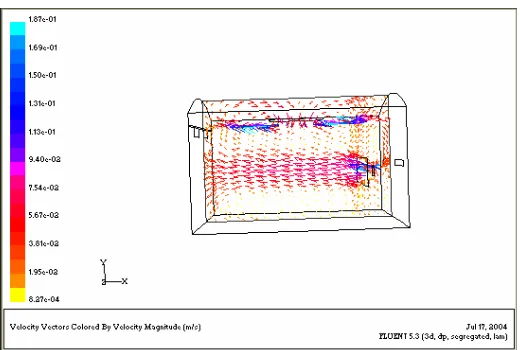
Figs. 9, shows the air temperature distribution as predicted using CFD in the form of contour and vectors. In general, air temperature showed uniform values at each racks. However, air temperature near the heat exchanger showed higher than 51oC, the average values measured at the racks. Distribution of air velocity could be categorized into four sections in the rack; a). the bottom rack (rack 1 and rack 2) had uniform flow at velocity of 0.01 m/s, b). the middle rack (rack 3, 4 and 5) which had flow pattern of higher velocity at the inlet and decreasing toward the outlet., c). the top rack (rack 6 and 7) which had average velocity of 0.01 m/s, and d) the top rack 8, which showed the highest air velocity because of its location closed to the air mixing fan.
Fig. 10 shows the velocity vector on the cross section of the structure, at z = 1.8 m. In general the drying air moved directly from inlet toward the outlet, although at the bottom of the racks some of the air streams bounced back to the opposite direction after the air flow hit the opposite wall. This low air temperature was re-circulated and pushed to the top of rack by the forcing pressure of high temperature air.
(b)
Figure 9.Calculated drying air temperature distribution inside the GHE solar dryer (a) at a rack 1 and (b) at all racks (Scenario 2)
51 51
52 51.5
51.5
51.5
51.5 52
51.5
51.5 52
Rack 6 Rack 5
Rack 4 51.5
51
50.5 50
51.5
51
51.5
51
50.5 50
52
51.5 51 52.5
51.5 51
Rack 1
Rack 3 Rack 2
51
51.5
51.5
51.5
Rack 8 Rack 7
51
(a)
Figure 10. Calculated velocity vector of drying air in the GHE solar dryer (Scenario 2)
CONCLUSIONS
1) The CDF analysis had helped in obtaining the optimum operation strategy to create uniform air temperature, RH and air velocity in side a GHE solar dryer.
2) Adding mixing fan on the top of the rack and outlet position on the right side of the transparent structure had resulted in uniform air flow, temperature and RH distributions.
ACKNOWLEDGEMENTS
The authors wish to thank the Directorate General of Higher Education for providing research grants through the URGE Project and the Basic Research Project and the Department of Mechanical Engineering, University of Indonesia for their valuable technical assistances.
REFFERENCES
Arismunandar, W. 1995. Solar Energy Technology (Teknologi Rekayasa Surya). PT Pradnya Paramita. Jakarta. Mursalim. 1995. Performnce of solar
drying system for vanilla pods with coal stove as auxiliary heating (In Indonesian language). Graduation thesis, Department of Agricultural Engineering, FATETA IPB Bogor. Lesmana,I. 2001. Study on energy balance
and air flow distribution based on fan location in a drying model (In Indonesian language). Graduation thesis. Department of Agricultural Engineering,. IPB. Bogor.
APPENDIX 1
Tabel 2. Standard deviation of temperature, velocity and RH for scenario 1, 2 and 3, respectively.
Racks
1
Racks 2
Racks 3
Racks 4
Racks 5
Racks 6
Racks 7
Racks 8
Standard of Dev.
Scenario 1 50 51 51 51 51 51 51 51 0.7
Scenario 2 51 51 52 52 52 52 52 52 0.4
T (oC)
Scenario 3 51 51 52 52 52 51 51 50 0.5
Scenario 1 0.01 0.01 0.02 0.02 0.01 0.01 0.03 0.06 0.01
Scenario 2 0.01 0.01 0.03 0.03 0.03 0.02 0.02 0.09 0.01
v (m/s)
Scenario 3 0.05 0.05 0.04 0.05 0.16 0.18 0.05 0.10 0.06
Scenario 1 26.4 25.0 24.0 24.2 25.0 26.0 26.2 26.2 0.9
Scenario 2 24.6 24.3 23.3 22.9 23.0 23.4 23.5 23.6 0.5
RH (%)