The new services in nagios: network bandwidth utility, email notification and sms
alert in improving the network performance
Mohammad Ali Arsyad bin Mohd Shuhaimi
Faculty of Information andCommunication Technology Universiti Teknikal Malaysia Melaka, Hang Tuah Jaya, 76100 Durian Tunggal, Melaka.
e-mail: [email protected]
Irda binti Roslan Faculty of Information and Communication Technology Universiti Teknikal Malaysia Melaka, Hang Tuah Jaya, 76100 Durian Tunggal, Melaka.
Email: [email protected]
Zaheera binti Zainal Abidin Faculty of Information and Communication Technology Universiti Teknikal Malaysia Melaka, Hang Tuah Jaya, 76100 Durian Tunggal, Melaka.
Email: [email protected]
Syarulnaziah binti Anawar Faculty of Information and Communication Technology Universiti Teknikal Malaysia Melaka, Hang Tuah Jaya, 76100 Durian Tunggal, Melaka.Email: [email protected]
Abstract²a new feature of services in Nagios has been added to the existing system which has no such services. The bandwidth monitoring and notification system are configured for alerting the network administrators when the bandwidth of the network in an organization hits a certain threshold settings. The system sent an email alert and sms notification to the network administrator for taking further action in order to maintain the Quality of Service (QoS) in the network. All the logs file of the Nagios actions is saved in the Nagios File Logs. The analysis was conducted from the case study and problem statements. Network Development Life Cycle (NDLC) was chosen as a methodology for implementing this system in the network. Nagios is installed inside Ubuntu 10 Operating System along with Multi-Router Traffic Grapher (MRTG) and Mail Postfix. MRTG and Mail Postfix were configured to be integrated with the Nagios System. On the client side, NSClient++ has been installed, for monitoring the bandwidth and performance of windows based on operating system. The Nagios services have been improved with the implementation of sms and emails notifications since the existing services have no such utilities. With the implementation of these services to Nagios, the performance could be even better for the future.
Keywords-component: Nagios, MRTG, Network Monitoring, Email Notification, SMS Alert, Network Performance.
I. INTRODUCTION (NAGIOS)
Network monitoring describes the use of a system that constantly monitors a computer network for slow or failing components and that notifies the network administrator via email or notification in case of outages. It is a subset of the functions involved in network management. Network monitoring takes note of slowing or failing systems and notifies the network administrator of such occurrences. Such notifications can take the form of email messages, pager alerts, or plain old phone calls. No matter what form takes, network problem messages would be the highest priority. Network monitoring alert a network administrator to indicate the problems caused by overloaded systems, crashed servers, lost network connections, virus or malware infections and power
outages, among other things. Network monitoring is commonly done by sending a ping or test to each computer or system on the network. If the system does not respond or takes too long to respond, the network monitoring system plays it roles. Pings are intended to be replied to instantaneously. In network monitoring, there are parameters which considered to measure such as bandwidth, latency, jitter and delay. These are common parameter in determining the performance of a network. Bandwidth is a measure of the amount of data passing through a network at a given time. For instance, a voice transmission by telephone requires a bandwidth of about 3000 cycles per second (3 KHz). A TV channel occupies a bandwidth of 6 million cycles per second (6MHz) in terrestrial system. In satellite based system a larger bandwidth of 17.5 to 72 MHz is used to spread the television signal in order to prevent interference. In computer networking, bandwidth in bit/s sometimes means the net bit rate, (also known as peak bit rate, information rate or physical layer useful bit rate), channel capacity, or the maximum throughput of a logical or physical communication path in a digital communication system. For example, bandwidth tests measure the maximum throughput of a computer network. The reason for this usage is that according to Hartley's law, the maximum data rate of a physical communication link is proportional to its bandwidth in hertz, which is sometimes called frequency bandwidth, spectral bandwidth, RF bandwidth, signal bandwidth or analog bandwidth.
« (1)
free tools provided to assist network engineer or administrator to govern the network, such as PRTG and MRTG. One of the powerful network monitoring is Nagios. Nagios is a free, open-source web-based network monitor developed by Ethan Galstad. Nagios is designed to run on Linux, but can be also be used on UNIX variants. Nagios monitors the status of host systems and network services and notifies the user of problems. In common with many open source utilities, installation requires a degree of system administrator experience. Nagios is a primary tool used to diagnose, prevent, and deal with network problems. The increasing of high bandwidth and mission critical application over Local Area Network (LAN) into Wide Area Network (WAN), demands more effective monitoring tools. Without a proper tools that can analyze and display network traffic and any related problem, a network admin is limited to the time-consuming try and error method to try identifying a problem. Nagios is definitely not for the novice. However with a wide range of features, including a number of web interfaces, Nagios is a very useful, feature rich monitoring tool. A large number of plug-ins available from the Nagios Library, meaning it could be customized according to requirements. Amongst others, Nagios monitors services such as SMTP, POP3, HTTP, PING and resources such as disk and memory usage, log files, processor load that integrates with the Sensatronics IT Temperature Monitor to allow monitoring and alerting of server room and device temperature at certain parameters. Nagios allows scheduling if there is network outage which the host can be suppressed and provides service notifications. Nagios gives users the flexibility to develop custom host and service checks. All the plug-ins is available for download from the Nagios library. It is possible to set up a hierarchy of alerts for instance if alerts are not responded to. The monitoring daemon runs intermittent checks on hosts and by using external plugins which return status information to Nagios. Current status information, historical logs, and reports can all be accessed via a web browser. Nagios runs on Linux and UNIX variants.
II. RELATED WORKS
The traffic on the network is generated by hundreds of devices and applications. Without the proper tools that can interpret, analyses and display network traffic and any related problem, a network admin can save time and energy to identify the network problem. With Nagios application, plug-ins and configuration such problem can immediately been detected. The bandwidth alert system monitored the maximum line bandwidth which transferred the current activities; therefore, it sent an alert to the network admin if the bandwidth usage hits a certain
provide better bandwidth performance by sending a warning, if the bandwidth usage arising, an emergency alert will be send to network admin for further actions. This is a step of early prevention of bandwidth outage in a network. To keep a network performing on the top-notch condition, the application as below will be developed: x Nagios integrated with Multi-Router Traffic Grapher
(MRTG)
x Nagios with Notifier via email
x Developed and tested in Wireless Network
Network Monitoring Tool eases the work of every network administrator. Nagios is a real time network tool used to analyze interpret and display network traffic. The workstation and client can monitor some the traffic flow in the network without disturbing the network at the same time. It also provides tools for technical control and performance of the system. The whole system can be viewed as combined structure with important process. Nagios application also presents the network bandwidth usage and also can notify the network admin via email if the network down or the bandwidth hits a certain threshold. Integrated MRTG also enable the network admin to view the bandwidth congestion during the peak hours. We propose the new services in Nagios which capable of monitoring network, bandwidth, alert via email and generate graph. Network monitoring is a part of the network. Real-time network analysis helps detect network faults and performance quickly thus preventing the network to down.
1.2.1 A. Nagios integrated with Multi-Router Traffic 1.2.2 Grapher (MRTG)
x Ability to monitor bandwidth traffic
x Ability to determine the lowers and maximum bandwidth
x Ability to generate graph
1.2.3 B. Nagios with Notify via email
x Ability to alert the network admin via email whenever there is a problem in the network and the bandwidth usage has hit a certain threshold.
III. LITERATURE REVIEW
A. Monitoring Network Quality of Service in a Dynamic Real-Time System
SNMP information polled from backbone router. However, this approach does not provide information of computer host and network path [2]. Hence, it is not suitable to be used as network monitoring tool for the resource management middleware. Another network monitoring tool that had been considered and actually tested in the course of this research was REMOS (Resource Monitoring System), which is currently being developed at Carnegie Melon University [3]. REMOS allow network-aware application to obtain both static and dynamic information about network. The network uses SNMP and benchmark techniques to collect status information.
B. SoftPerfect Bandwidth Manager for Windows
SoftPerfect bandwidth Manager is a full-featured traffic management tool for Windows that offer cost-effective bandwidth control and quality of service based on built-in prioritized rules. These rules can specify a bandwidth shaper, bandwidth limit for each Internet user. This kind of software often called bandwidth shaper, bandwidth limiter or traffic shaper. With SoftPerfect Bandwidth Manager, you can apply speed-throttling rules to specified IP addresses, port and even network interface with no change to existing network infrastructure. This rich feature is easily managed via the intuitive Windows GUI.
C. Hierarchical Filtering-based Monitoring System for Large-scale Distributed Application
Monitoring is an essential process to observe and improve the reliability and the performance of large-scale distributed (LSD) application. The monitoring system is dynamic since the monitoring demand can be added, delete and modified at runtime with no interface with the running application [6]. These design features distinguish the monitor architecture among other exiting system. A survey and evaluation of the related work in even filtering and monitoring are in respectively [7].
IV. METHODOLOGY
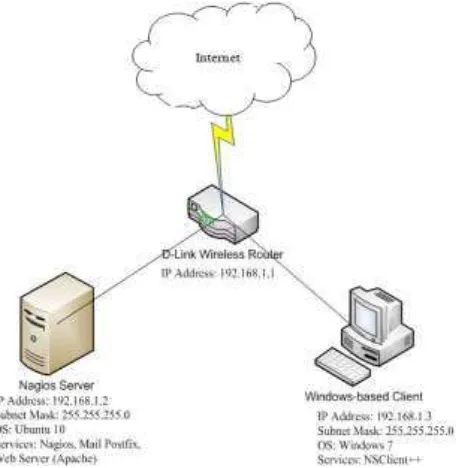
The experiment is done as in Figure 1. setup in wireless local area network with 300 Mbps speed. The Nagios server is installed at the server computer. In the Nagios server, there are some services installed in that particular server which are Web Server (Apache), Mail Postfix and Network Monitoring Tool (Nagios). The server was monitoring the windows client and the wireless router since Nagios is capable of monitoring network, hard drive space, uptime and down time of a node.
Figure 1: The logical design of the proposed model
The client side is installed with NSClient++ which act as Nagios service for the client side and send data to the Nagios Server. From there, Nagios was able to determine the size of the network and where the nodes are located. An alert is sent to the network admin if there a problem with a host and most importantly when the bandwidth hits a certain threshold set up by the network admin. The tests are done to ensure the data collected are satisfied to the parameter, have been selected. All of the services are configured in order to test the Network Monitoring Bandwidth Alert System. Multi-Router Traffic Grapher is used to generate the bandwidth usage by visualize the bandwidth usage for each 5 minutes in the form of graph.
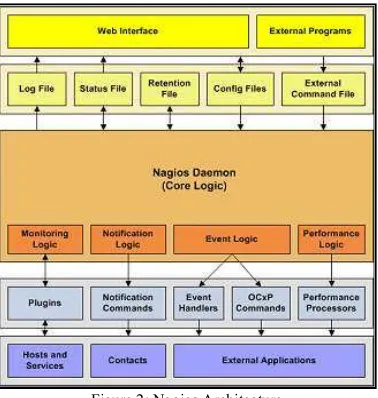
Figure 2: Nagios Architecture
(before implementation of sms and email notification)
Figure 3: Nagios Architecture
(after the implementation of sms and email notification)
C. Testing the Network Connectivity
Internet Wireless Router Windows Client Server with GSM Modem Telco Tower Network Administrator
Figure 4: Testing the SMS and Email Notification Connectivity
As the configurations and plug-in implemented into the Nagios existing architecture, the connectivity need to be tested in ensuring the successful of the implementation. The network engineer tested the connectivity by µping¶ from the server to the client. The server Nagios monitored the performance as in Figure 5.
Figure 5: Network Performance with the implementation of sms and email notification
Figure 5 showed that there is connectivity between client and server. It means the implementation was a success. After tested the connectivity, the network engineer need to test the sms and email notifications services implemented in nagios.
C. Testing Results
Figure 6: Nagios Log Result
If the client bandwidth usage hits the threshold, Nagios automatically send the notification to the network administrator via email and SMS, as in Figure 7 and 8
.
Figure 7: Email Notification from Nagios
Figure 8: SMS Alerts stored in MySQL
Figure 9 showed the nagios alert messages at the host. The node is identified as green in colour to show that the device is enabled or µON¶ mode. However, if it is in red it means the node is down or µOFF¶ mode.
Figure 9: Nagios (Host Based)
Figure 10 explains the activities and bandwidth configured in Nagios.
Figure 10: Nagios (Services Details)
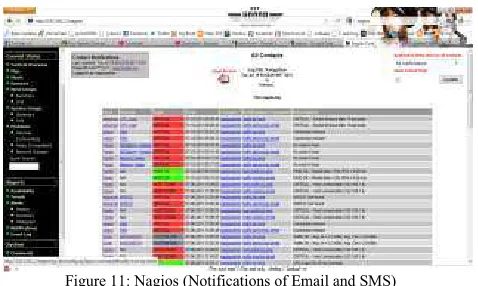
Figure 11 shows the details of services with the notification information. This information is very important for network engineer to fully optimizing the bandwidth utilization in the network performance.
Figure 11: Nagios (Notifications of Email and SMS)
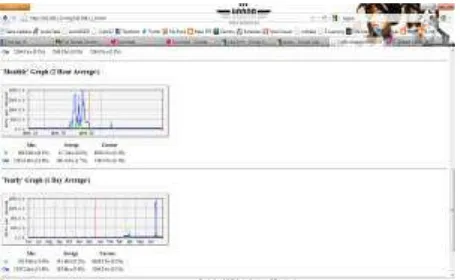
Figure 12: Nagios (Graph of Network Performance)
D. Discussions
Nagios has been one of the free monitoring tools which able to customized according to demands. However, the limitation of Nagios is when the internet is down and Nagios would not be able to send an email to the network administrator. This is because Nagios notification is completely relying on internet based connection to alert the network administrator.
E. Conclusion
The implementation of the Nagios email notification and sms alert have increased the reliability of the existing Nagios settings. The notification and alert help improved the Quality of Service (QoS) of the network and preventing the network outages. Network outages produce loss to organization. It was sensitive to bandwidth, latency and throughput of the network. Therefore, with the implementation of new services in Nagios gave a value added to the services in improving the network performance in an organization. In other hand, Nagios is not only free source tool but also can be customized according to the needs of users in an organization.
REFERENCES
>@$OH[H\5RJR]KNLQ³'HSOR\LQJ1DJLRV0RQLWRULQJ6HUYLFHV RQ6HFXUHG5HG+DW(QWHUSULVH/LQX[´*OREDO,QIRUPDWLRQ$VVXUDQFH
Certification Paper, SANS Int., 2005.
>@2QOLQH5HVRXUFHV³Bandwidth Monitoring with Nagios and MRTG´
NetworkGodெs Blog, 2009, Retrieved on April 2011 from http://www.networkgod.net/archives/121
>@2QOLQH5HVRXUFHV³2SHQ%6',QVWDOODWLRQ*XLGH´OpenBSD, 2010, Retrieved on April 2011 from http://www.openbsd.org/faq/faq4.html
>@ 2QOLQH 5HVRXUFHV ³1DJLRV 'RFXPHQWDWLRQ´ Nagios, 2010, Retrieved on April 2011 from http://www.nagios.org/documentation
>@ 2QOLQH 5HVRXUFHV ³1DJLRV 3OXJLQV´Nagios, 2010, Retrieved on April 2011 from http://www.nagiosexchange.org
[6] Ehab Al-shaer and Hussein Abdel-wahab and Kurt Maly,
³+LHUDUFKLFDO )LOWHULQJ-based Monitoring System for Large-scale
'LVWULEXWHG$SSOLFDWLRQ´WK,QWHUQDWLRQDO&RQIHUHQFHRQ3DUDOOHODQG
Distributed Computing Systems, 1997.
>@+RQJ&KHQ³0RQLWRULQJ1HWZRUN4XDOLW\RI6HUYLFHLQD\QDPLF
Real-7LPH 6\VWHP´ )ULW] - DQG 'RORUHV + 5XVV &ROOHJH RI
(QJLQHHULQJDQG7HFKQRORJ\RI2KLR8QLYHUVLW\´
>@ -RVKXD (WNLQ $QG -RKQ $ =LQN\ ³Development Life Cycle Of
&RPSXWHU 1HWZRUNV 7KH ([HFXWDEOH 0RGHO $SSURDFK´ ,HHH