Published online December 31, 2014 (http://www.sciencepublishinggroup.com/j/abb) doi: 10.11648/j.abb.20140205.11
ISSN: 2330-4154 (Print); ISSN: 2330-4162 (Online)
Covariance analysis, a new approach for relative
quantification competitive PCR in evaluation of rumen
anaerobic fungal Populations
Mohammad Hadi Sekhavati
1, Mahdi Elahi Torshizi
2, *, Mahyar Heydarpour
3, Adham Fani Maleki
41Department of Animal Science, Ferdowsi University of Mashhad, Iran
2Department of Animal Science, Mashhad Branch, Islamic Azad University, Mashhad, Iran 3CABG genomics group, Brigham & Women's Hospital, Harvard Medical School, USA
4Embryonic and Stem Cell Biology and Biotechnology Research Group, Institute of Biotechnology, Ferdowsi University of Mashhad, Iran
Email address:
[email protected] (M. H. Sekhavati), [email protected] (M. E. Torshizi), [email protected] (M. Heydarpour), [email protected] (A. F. Maleki)
To cite this article:
Mohammad Hadi Sekhavati, Mahdi Elahi Torshizi, Mahyar Heydarpour, Adham Fani Maleki. Covariance Analysis, a New Approach for Relative Quantification Competitive PCR in Evaluation of Rumen Anaerobic Fungal Populations. Advances in Bioscience and Bioengineering. Vol. 2, No. 5, 2014, pp. 44-50. doi: 10.11648/j.abb.20140205.11
Abstract:
Quantitative competitive polymerase chain reaction (QC-PCR) technique is playing an important role in nucleic acid quantification. This paper describes a new statistical approach for data analyzing in relative quantitative competitive PCR assays. In order to test the accuracy of this statistical model for quantifying anaerobic rumen fungi, samples of rumen fluid were collected from six fistulated Holstein steers which were fed in two different diets groups (soybean meal diet and canola meal diet). Competitor intensity signal (CIS) and efficiency of PCR (EFF) were assumed as two covariates in ANCOVA method. The assumptions for using of these two covariates were tested. A high positive correlation between the mean of the template intensity signal (TIS) through serial dilutions showed an appropriate efficiency of the competitive PCR assays. Results showed that the accuracy of data analyzing for relative quantification anaerobic fungi was considerable improved in ANCOVA model in comparison with ANOVA method and also the power of test is much greater. So, it seems that considering of the CIS and EFF as two co-variables was suitable.Keywords:
Analysis of Covariance (ANCOVA), Competitor Intensity Signal (CIS), Efficiency of PCR (EFF), Template Intensity Signal (TIS)1. Introduction
Real-time polymerase chain reaction (RT-PCR) method recently introduced for the rapid quantification of the target DNA sequence[1], however, quantitative competitive PCR(QC-PCR) technique continue to play an important role in nucleic acid quantification because of their significant lower costs of equipment and consumables[2]. QC-PCR is a powerful tool for accurate quantification of DNA or RNA. The procedure relies on the co-amplification of sequence of interest with a serially diluted synthetic DNA fragment of known concentration (competitor) using a single set primers [3, 4]. The initial quantity of target molecules in the sample can be calculated from the ration of competitor and target derived amplicons generated during PCR, provided that the target and competitor sequences are amplified with equivalent
efficiency [5]. The competitor contains the same primer binding site as the target, and the two DNAs compete for reactions to produce PCR products of different size, which can be separated in an agarose gel. The log ratio of intensities of amplified target DNA to competitor is determined by the equation Log (N n1/Nn2) = log (N01/N02) + n log (EFF1/EFF2)
[6]. If the efficiencies of amplification (EFF1 and EFF2) are
equal, the ratio of amplified products (Nn1/Nn2) is dependent
on the log ratio of starting products (N01/N02) [6]. The quality
with known amount of competitors [7]. using from this ratio( Z=log (Nn1/Nn2)) is not suitable for statistical analysis in
ANOVA method, because template intensity signal (TIS) and competitor intensity signal (CIS) are random variables and then using of this ratio provide assumptive amount of Z in result. Variation of TIS influence on Z linearly but variation of CIS effect on Z in hyperbolic way (Z=1/CIS). Variation below the CIS mean has a large effect on Z than variation above the CIS mean.
Moreover, the magnitude of the error of Z depends on the error of CIS but also on the absolute value of CIS, in the other way error is higher for low values of CIS. This clearly affects to the homogeneity of variance. The correct way to analyze these ratios is an analysis of covariance (ANCOVA) for the numerator using the denominator of the ratio as covariate. The analysis of covariance (ANCOVA) is a method of adjusting for the effect of an uncontrollable nuisance variable (covariates).The procedure is a combination of analysis of variance and regression analysis. The analysis of covariance involves adjusting the observed response variable for the effect of the covariate variable. Such an adjustment is not performed, the covariate variable could inflate the error mean square and decrease the precision of an experiment [8, 9].
Small differences in amplification efficiency (EFF) can have a significant impact on the productivity of PCR. For example, a 5% difference in amplification efficiency between two targets with identical starting concentration can lead to a twofold difference in amplicon concentration after just 26 cycles [1]. Differences in amplification efficiency between the target and competitor will lead to mistake in relative quantification unless corrections are made and ANCOVA can adjust these differences [1]. An index for evaluation of preference of the new model is obtaining by power of test. The technical definition of power is that it is the probability of detecting a ‘true’ when it exists. Such tests are useful in determining the number of experimental replicates required to detect a desired numerical difference between, or among, treatments prior to initiating an experiment and also accuracy of an analysis [10].
This paper describes a new model (ANCOVA) for data analysis of quantification competitive PCR for comparing changes of rumen anaerobic fungal population under different treatment. CIS and EFF are two covariates in this study which
effect on target intensity band. We evaluated the assumptions of ANCOVA in this analysis and compared ANCOVA model with ANOVA through power of test for each model.
2. Material and Methods
2.1. Isolation and Culturing of Rumen Anaerobic Fungi
Rumen fungi were isolated from the wheat straw which incubated in fistulae steer. Method of Joblin et al. (1981) was used to grow fungi under anaerobic conditions at 39º C for 3 days.
2.2. Animals, Experimental Design and Diets
Cows were fed diets that were isoenergetic containing soybean meal (SBM, n = 3), canola meal (CM, n=3) from day 5 to 56 postpartum. Six Holstein cows, 560 ± 4 kg live weight (Mean ± SEM) were blocked in pairs based on their previous 305-d milk, parity (2nd and 3rd to 5th) and expected calving dates. Six Rumen samples (200 ml) were taken 50 days after feeding each diet, 6 hours after morning feeding. Digesta samples were directly taken from the central portion of the rumen for each cow with initial course filtration through an insect screen with a medium mesh size (2 × 1.5 mm). The pooled filtrates, contained digest plant particles and rumen fluid was then stored at -80ºC until DNA was extracted for microbial population analysis.
2.3. DNA Source, PCR Amplification and Construction of Competitor
Total genomic DNA was isolated from pure culture and rumen fluid samples using Guanidine Thiocyanate-Silica Gel method [11]. The general anaerobic fungal primers (GAF) previously designed by Denman and McSweeney (2006) from multiple alignments of fungal 18S ribosomal and ITS1 gene sequences were used in this study and are listed in (Table 1). PCR amplification of rumen anaerobic fungi DNA produces a 110-bp product when amplified with the universal primers. The non-homologous competitor (are listed in Table 1) was designed as described by Sekhavati et al. (2009) which produced a competitor with 191 bp size in PCR reaction.
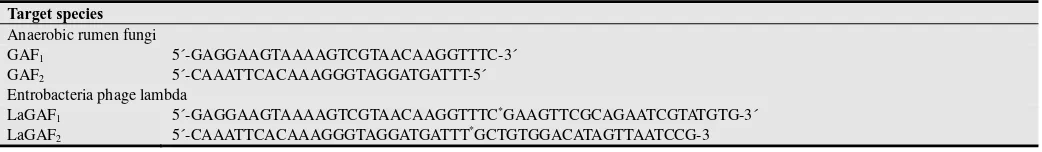
Table 1. PCR primers for amplifying target and non-homologous competitors.
Target species
Anaerobic rumen fungi
GAF1 5´-GAGGAAGTAAAAGTCGTAACAAGGTTTC-3´
GAF2 5´-CAAATTCACAAAGGGTAGGATGATTT-5´
Entrobacteria phage lambda
LaGAF1 5´-GAGGAAGTAAAAGTCGTAACAAGGTTTC*GAAGTTCGCAGAATCGTATGTG-3´
LaGAF2 5´-CAAATTCACAAAGGGTAGGATGATTT*GCTGTGGACATAGTTAATCCG-3
The 5΄ ends of hybrid primers contained a GAF-universal sequence
The PCR mixture contained 50 ng of template DNA, 2 µl
10-X PCR buffer, 2.5 mM MgCl2, 200 µM each dNTPs, 10
pM of each primer and 1 U Taq DNA polymerase. The PCR was performed in a final volume of 25 µl sealed in a capillary
were analyzed by running on 2% agarose gels containing ethidium bromide, and visualized for a single specific band and the absence of primer dimmer products by UV transilluminatin.
2.4. Quantification of PCR product
The PCR products were quantified by photographing agarose gels with Polariod 665 film (Polaroid, St. Albans, England), which produce a negative image of the photograph. The negative was scanned with a GS-670 image densitometer (Bio-Rad, Hercules, California) and analyzed with ImageJ 1.38x software (National Institutes of Health, USA). To correct for differences in the fluorescence of ethidium bromide-stained PCR fragments, the intensities of amplified standard control was multiplied by the ratio 110/191[12].
2.5. Statistical Analysis and Results
Data were analyzed with completely randomize design by covariance analysis through Generalized Linear Model (GLM) in SAS program [13].
Yij = template intensity signal
µ
=meanTi = effect of treatment i
b1 &b2 = regression coefficients
CIS = control intensity signal EFF = PCR efficiency
eij = experimental error of j that is related to treatment i έijk = sampling error of repeated j, related to treatment i and
sample k
For computing the PCR efficiency for each of 18 reactions, the competitor was diluted (1 to 10-7-fold) in distilled H2O and
amplified by PCR as outlined above. A linear regression of log ratio of intensities of amplified target DNA to competitor against the concentration of competitor DNA was used for
calculation of PCR efficiency (EFF) by using the following equation: ε= 10-1/slope for each reaction.
In this model the CIS and the EFF were used as covariate factors (see supplement 1 for programs). Test of the assumptions for ANCOVA model (Independence of CIS and PCR efficiency values from treatments), test for heterogeneity of the slopes and test the normality of residuals were performed using SAS (see supplement2).
A simple ANOVA method without considering of co- variable factors also was used in order to compare two methods (see supplement 3).Finally, power of test for both methods (ANOVA & ANCOVA) was calculated through SAS program (see supplement 4).
3. Results
3.1. Test of Linearity for 6 Dilutions of Standard DNA by Orthogonal Polynomials
PCR amplification using the anaerobic fungal primers (GAF) produced fungal-specific amplicons of the expected size was confirmed and supported previous study [10]. PCR amplification of the enterobacteria phage lambda DNA using overhang primers (LaGAF) produced the expected size (191 bp) and was purified and used as the standard control. The relative amplification efficiencies of target and standard control DNAs was determined as described. For validation of the competitive PCR method, in addition to molecular test that previously confirmed by Sekhavati et al (2009). The orthogonal polynomial (linear, quadratic and cubic) test was done. Six serial dilutions of standard control (1, 10-1, 10-2, 10-3, 10-4 and 10-5) were chosen for competitive PCR reaction in each replicate. For testing of statistical validation of competitive PCR reaction, total data which obtained from intensities of target signal (ITS) were analyzed for linearity between 6 dilutions of standard DNA. The orthogonal polynomial contrasts for linear and cubic were significant (P≥0.01) (table 2).
Table 2. Test of linearity between intensities of target signal and serial dilution for validation of QC-PCR method.
Contrast DF Contrast SS Mean Square Pr> F
Linear 1 95695.3420 95695.3420 <0.0001
Quadratic 1 26.7900 26.7900 0.7762
Qubic 1 3111.4464 3111.4464 0.0104
Result of ANCOVA, for output model 1 showed that effects of CIS and EFF (The PCR efficiency calculated for each
Error 151 89463.3446 592.4725
Corrected Total 161 170251.0875
Source DF Type III SS Mean Square F Value Pr > F
Treatment 2 8392.45765 4196.22883 7.08 0.0011
Cow(Treatment) 6 27608.58931 4601.43155 7.77 <.0001
CIS 1 54893.55099 54893.55099 92.65 <.0001
EFF 1 2715.29691 2715.29691 4.58 0.0339
Tests of Hypotheses Using the Type III MS for Cow (Treatment) as an Error Term
Source DF Type III SS Mean Square F Value Pr > F
Treatment 2 8392.457653 4196.228826 0.91 0.4510
Assumptions which are necessary for the use of covariance are as follows [13]:
1- Independence of CIS and PCR efficiency values from treatments
2- Test for heterogeneity of the slopes 3- The normality of residuals
3.2. Independence of CIS and PCR Efficiency Values from Treatments
Output model 2
Source DF Type III SS Mean Square F Value Pr > F
Treatment 2 2959.2613 1479.6306 1.03 0.3597
Results showed (output model 1 and 2) that the p-value for CIS and EFF are 0.359 and 0.451 respectively and it’s clear that co-variables and treatments are independent from each
other’s. The same result is achieved for co-variable EFF (not show here). So, this assumption was met in our analysis.
3.3. Test for Heterogeneity of the Slopes
Output model 3
Source DF Sum of Squares Mean Square F Value Pr > F
Model 5 50326.5667 10065.3133 13.09 <.0001
Error 156 119924.5208 768.7469
Corrected Total 161 170251.0875
Source DF Type I SS Mean Square F Value Pr > F
Treatment 2 9672.59900 4836.29950 6.29 0.0024
CIS 1 39979.80143 39979.80143 52.01 <.0001
CIS*Treatment 2 674.16625 337.08313 0.44 0.6458
Source DF Type III SS Mean Square F Value Pr > F
Treatment 2 3437.89776 1718.94888 2.24 0.1103
CIS 1 39597.80422 39597.80422 51.51 <.0001
CIS*Treatment 2 674.16625 337.08313 0.44 0.6458
Output model 4
Source DF Sum of Squares Mean Square F Value Pr > F
Model 5 13770.3465 2754.0693 2.75 0.0209
Error 156 156480.7410 1003.0817
Corrected Total 161 170251.0875
Source DF Type I SS Mean Square F Value Pr > F
Treatment 2 9672.598999 4836.299499 4.82 0.0093
EFF 1 531.614268 531.614268 0.53 0.4677
EFF*Treatment 2 3566.133259 1783.066629 1.78 0.1725
Source DF Type III SS Mean Square F Value Pr > F
Treatment 2 7474.246610 3737.123305 3.73 0.0263
EFF 1 1666.967396 1666.967396 1.66 0.1993
EFF*Treatment 2 3566.133259 1783.066629 1.78 0.1725
P value of interaction effect for CIS*treatment and EFF*treatment are 0.6458 and 0.1725 respectively. So the interaction effect of CIS*treatment and EFF*treatment were not significant, and consequently the hypothesis of
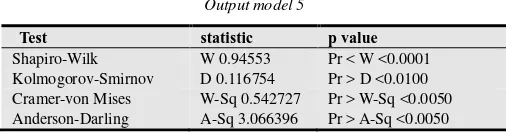
3.4. The Normality of Residual
Output model 5
Test statistic p value
Shapiro-Wilk W 0.94553 Pr < W <0.0001
Kolmogorov-Smirnov D 0.116754 Pr > D <0.0100 Cramer-von Mises W-Sq 0.542727 Pr > W-Sq <0.0050 Anderson-Darling A-Sq 3.066396 Pr > A-Sq <0.0050
Based on results it is clear that normality index of error that
calculates with Shapiro-Wilk test (W) is 0.945. This number and residual plot show that the error has no specific trend and is completely scattering (Fig1).
Result showed that if we analyze this design with ANOVA method, the power of test is 0.58 but when we include co-variable factors in the model, then the power will increase to 0.73 (see output model 7). Consequently, we can conclude that ANCOVA is better than ANOVA method for relative quantification competitive PCR.
Output model 6
Source DF Sum of Squares Mean Square F Value Pr > F
Model 8 25101.8773 3137.7347 3.31 0.0016
Error 153 145149.2102 948.6876
Corrected Total 161 170251.0875
R-Square Coeff Var Root MSE TIS Mean 0.147440 76.20933 30.80077 40.41601
Tests of Hypotheses Using the Type III MS for Cow (Treatment) as an Error Term
Source DF Type III SS Mean Square F Value Pr > F
Treatment 2 9672.598999 4836.299499 1.88 0.2322
Output model 7
Obs alpha a n df1 df2 SStrt MSres lambda Fcrit Power
1 0.05 3 9 2 6 8392.46 592 14.1764 5.14325 0.73429
Fig. 1. Residual plot of observations.
4. Discussion
Real-time PCR technique as a method for nucleic acid quantification has been widespread in most laboratories worldwide. However, this method still has some limitations in low budget laboratories and technical sophistication [9]. An ideal method that could overcome almost all these limitations is quantitative competitive PCR. This method has a high sensitivity and accuracy in nucleic acid quantification and almost twofold change in target concentration can be detectable by this method [9]. The output data of QC- PCR is the log ratio of intensity of template band to compotator which obtained from image analyzer. These data are not appropriate for statistical analysis with ANOVA model [14]. In this study
we tried to introduce a new and simple model for statistical analysis of obtained data which is obtained from QC-PCR. In this regard we conducted a simple experimental design that evaluated an effect of two treatments on rumen anaerobic fungi. In statistical analyses we assumed two factors (CIS and EFF) as co-variables in the model. Results showed a significant effect of these two factors (Output model 1), but we must test the ANCOVA assumption before considering CIS and EFF as co-variables in our model. The results indicated that we could consider these two factors as co-variables (Output 2, 3, 4 and 6). In addition, we validated the QC-PCR method with polynomial contrast vs. the validation of this method that had been done by Sekhavati et al. (2009). They confirmed this method with plotting the -60
-40 -20 0 20 40 60 80
0 50 100 150 200
R
es
id
u
al
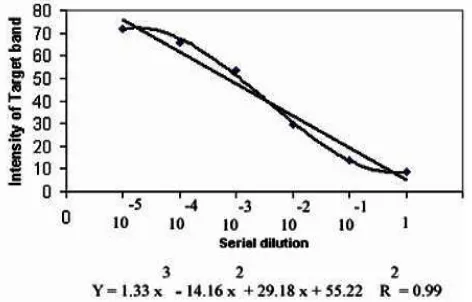
QC-PCR method against Chitin’s results that obtained from cell wall chitin analyses of rumen anaerobic fungi. High significantly of linearity for the mean of TIS through serial dilutions showed the validation of competitive PCR method (Table 2). In addition, significance of cubic trend indicated that we can eliminate the dilution of 1 and 10-5 from data analyzing because of no significant of intensities signal with adjacent dilutions. So we can perform competitive PCR reaction with 4 dilutions instead of 6. Plotting the mean intensities of target signal to each serial dilution (Fig.2) confirmed the results of orthogonal contrast.
Fig. 2. Linear and cubic manner of mean intensities of target signal to each serial dilution. Each point is consisting 18 PCR reactions for each serial dilution.
In the final step, we compared the power of ANCOVA model with the ANOVA for statistical analysis of rumen anaerobic fungal populations. Results showed that power of test of ANCOVA model is higher than the ANOVA (0.73 vs 0.58).
There are lots of studies that have used QC-PCR method for quantifying nucleic acid. However, none of them have used this simple statistical model for analyzing QC-PCR data. In this study we proposed a simple model for data analyzing of QC-PCR data and validation of this model. It seems that ANCOVA model could be a suitable model for data analyzing in QC-PCR method, particularly when the size of data is
INPUT TRETAMENT$ COW SAMPLE CIS EFF TIS, DATALINES,
DATA, PROC GLM,
CLASS TREATMENT COW,
MODEL TIS=TREATMENT COW (TREATMENT) CIS EFF,
RANDOM COW (TREATMENT),
TEST H=TREATMENT E=COW (TREATMENT), RUN,
TITLE ‘TEST FOR HETROGENEITY OF SLOPES’,
CLASS TREATMENT,
MODEL TIS= TREATMENT CIS TREATMENT*CIS, RUN,
PROC GLM,
TITLE ‘TEST FOR HETROGENEITY OF SLOPES’,
CLASS TREATMENT,
MODEL TIS= TREATMENT EFF TREATMENT*EFF, RUN,
PROC GLM,
TITLE ‘TEST FOR NORMALITY OF RESUALS’,
CLASS TREATMENT,
MODEL TIS= TREATMENT CIS EFF, OUTPUT OUT=CHEK P=PREDI R=RESI, RANDOM COW (TREATMENT),
References
[1] W.M. Freeman, S.J. Walker, and K.E. Vrana, Quantitative RT-PCR: pitfalls and potential. Biotechniques 1999. 26 p. 112-125.
[2] F. Watzinger, E. Hörth, and T. Lion, Quantification of mRNA expression by competitive PCR using non-homologous competitors containing a shifted restriction site. Nucleic Acids Research, 2001. 29 p. 52.
[3] A. Gaiger, et al., Increase of bcr- abl chimeric mRNA expression in tumor cells of patients with chronic myeloid leukemia precedes disease progression. Blood 1995. 86 p. 2371.
[4] Joblin, K., Isolation, enumeration, and maintenance of rumen anaerobic fungi in roll tubes. Applied and environmental microbiology, 1981. 42(6): p. 1119-1122.
[5] Vu, H.L., et al., A method for quantification of absolute amounts of nucleic acids by (RT)–PCR and a new mathematical model for data analysis. Nucleic acids research, 2000. 28(7): p. e18-e18.
[6] Zar, J.H., Biostatistical Analysis. Second Edition ed1984: Prentice Hall International, Inc.
[7] Reilly, K. and G. Attwood, Detection of Clostridium proteoclasticumand Closely Related Strains in the Rumen by Competitive PCR. Applied and environmental microbiology, 1998. 64(3): p. 907-913.
[8] G.W, S. and W.G. Cochran, Statistical Methods. Eighth edition ed1991: Iowa state university press/AMES
[9] Zentilin, L. and M. Giacca, Competitive PCR for precise nucleic acid quantification. Nature protocols, 2007. 2(9): p. 2092-2104.
[10] Robinson, P., et al., Some experimental design and statistical criteria for analysis of studies in manuscripts submitted for consideration for publication. Animal feed science and technology, 2006. 129(1): p. 1-11.
[11] Boom, R., et al., Rapid and simple method for purification of nucleic acids. Journal of clinical microbiology, 1990. 28(3): p. 495-503.
[12] Sekhavati, M.H., et al., Development and use of quantitative competitive PCR assays for relative quantifying rumen anaerobic fungal populations in both in vitro and in vivo systems. Mycol Res, 2009. 113(Pt 10): p. 1146-53.
[13] SAS, S. and S.U.s. Guide, Version 9.1. SAS Institute Inc., Cary, NC, 2003.
[14] J. Dubcovsky,