“ I hereby declare that I have read through this report entitle “Harmonic Source Identification System” and found that it has comply the partial fulfillment for awarding the degree of Bachelor of Electrical Engineering (Industrial Power)”
Signature : ………..
Supervisor’s Name : ………..
HARMONIC SOURCE IDENTIFICATION SYSTEM
MUHAMMAD SUFYAN SAFWAN BIN MOHAMAD BASIR
A report submitted in partial fulfillment of the requirement for the degree of Bachelor of Electrical Engineering (Industrial Power)
Faculty of Electrical Engineering
UNIVERSITI TEKNIKAL MALAYSIA MELAKA
I declare that this report entitle “Harmonic Source Identification System” is the result of my own research except as cited in the references. The report has not been accepted for any degree and is not concurrently submitted in candidature of any other degree.
Signature : ………..
Name : ………..
ACKNOWLEDGEMENT
In preparing this report, I was in contact with many people, researchers, academicians and practitioners. They have contributed towards my understanding and thought. In particular, I wish to express my sincere appreciation to my main project supervisor, Nur Hazahsha binti Shamsudin, for encouragement, guidance critics and friendship. I am also very thankful to my co-supervisor Dr. Abdul Rahim bin Abdullah for his guidance, advices and motivation. Without their continued support and interest, this project would not have been same as presented here.
I am also indebted to Advance Digital Signal Processing Laboratory (ADSP) for funding, my University Teknikal Malaysia Melaka also deserve special thanks for their assistance in supplying the relevant literatures.
ABSTRACT
ABSTRAK
TABLE OF CONTENTS
CHAPTER TITLE PAGE
ACKNOWLEDGEMENT ii
ABSTRACT iii
TABLE OF CONTENTS v
LIST OF TABLES vii
LIST OF FIGURES viii
LIST OF ABBREVIATIONS x
1 INTRODUCTION 1
1.1 Research Background / Motivations 1
1.2 Problem Statement 3
1.3 Objective 4
1.4 Scope of Work 4
1.5 Report Outlines 4
2 LITERATURE REVIEW 6
2.1 Introduction 6
2.2 Theory and Basic Principles 7
2.2.2 Harmonic Level 9
2.3 Review of Previous Related Work 10
2.4 Summary and Discussion of the Review 13
3 METHODOLOGY 14
3.1 Principles of the Methods Used In the Previous Work 14
3.2 Project Development Workflow 15
3.2.1 Software Implementation 17
3.2.2 Hardware Implementation 20
3.3 Description of the Work to Be Undertaken 21
3.4 Performance Testing 22
3.5 Project Gantt Chart and Key Milestones 24
4 RESULTS AND DISCUSSION 26
4.1 Simulation Results and Discussion 26
4.2 Performance Tests and Discussion 28
4.2.1 Overview of Performance Test Analysis 38
5 CONCLUSION 40
5.1 Conclusion 40
5.2 Recommendations 41
REFERENCES 42
LIST OF TABLES
TABLE TITLE PAGE
2.1 Sequence of Harmonic 10
2.2 Advantage and Disadvantage of WPT, Direction of Active
Power Flow, and FFT 12
3.1 Project Gantt Charts 25
4.1 LED Status for System Condition 28
4.2 Results of Incandescent Lamp Test 29
4.3 Results of CFL Lamp Test 32
LIST OF FIGURES
FIGURE TITLE PAGE
1.1 Identification of Harmonic Source Using HSIS 2 1.2 (a) Waveform with Harmonic and Inter-harmonic
Components (b) FFT Spectrum 3
2.1 Harmonic Signal Occur Inside Sinusoidal Signal 8 3.1 Components of a Multiwave Monitoring System 14
3.2 Project Workflow 16
3.3 Flowchart of Harmonic Source Identification System 17
3.4 HSIS GUI 19
3.5 General Diagram for the System 20
3.6 Connection Diagram for NI DAQ 6000 21
3.7 Schematic Diagram for HSIS 21
3.8 Incandescent Lamp Test 23
3.9 CFL Lamp Test 23
3.10 Synchronous Motor Test 24
4.1 No Harmonic Condition (a) Input Waveform (b) Power
Spectrum 26
4.2 Harmonic Condition (a) Input Waveform (b) Power
4.4 (a) Input Current Waveform (b) Power Spectrum (c) THDi
Parameter 31
4.5 GUI for Harmonic Source 32
4.6 (a) Input Voltage Waveform (b) THDv Parameter 33 4.7 (a) Input Current Waveform (b) Power Spectrum (c) THDi
Parameter 34
4.8 GUI for Harmonic Source 34
4.9 (a) Input Voltage Waveform (b) THDv Parameter 36 4.10 (a) Input Current Waveform (b) Power Spectrum (c) THDi
Parameter 37
4.11 GUI for Harmonic Source 37
LIST OF ABBREVIATIONS
A/D - Analog to digital
AC - Alternating current
ANSI - American National Standards Institute
CFL - Compact fluorescent lamp
CPU - Central processing unit
CT - Current transducer
DAQ - Data acquisition
DTFT - Discrete Time Fourier Transform DWPT - Discrete Wavelet Packet Transform
FFT - Fast Fourier Transform
GND - Ground
GUI - Graphical User Interface
HSIS - Harmonic Source Identification System
Hz - Hertz
IEEE - Institute of Electrical and Electronics Engineers
LED - Light emitting diode
LV - Low voltage
MATLAB - Matric laboratory
NI - National Instrument
rms - Root mean square
TDD - Total Demand Distortion
THD - Total harmonic distortion
THDi - Total current harmonic distortion THDv - Total voltage harmonic distortion
USB - Universal Serial Bus
VS2015 - Visual Studio 2015
VT - Voltage transducer
LIST OF APPENDICES
APPENDIX TITLE PAGE
A Hardware Development of Harmonic Source Identification
CHAPTER 1
INTRODUCTION
1.1 Research Background / Motivations
In present days, power distribution system became highlighted in the growth of technology for availability, reliability and quality of a system. Power electronic components that apply in digital circuitry such as computer and television create power line disturbance namely harmonic distortion [1]. Harmonic distortion became the major contributor to poor power quality due to excessive draw of reactive power from non-linear loads such as nonlinearity of transformer, arching device, rotating machines, and inverter fed AC drives [2]. Non-linear loads are caused by a drawn of non-sinusoidal current, thus inducing voltage distortion and affecting on consumer equipment. Based on the IEEE 519 - 2014 Task Force on the Effect of Harmonic on Equipment, the harmonic can lead to problem in central processing unit (CPU) frequency problem and can change the size and brightness for television. Hence, this justifies that modern electronic devices in electrical systems are sensitive to harmonic issues than those from the olden days.
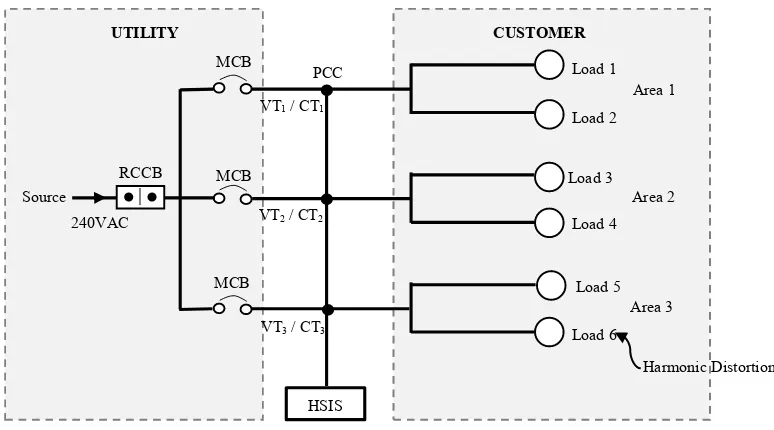
can be traced by minimizing the area where PCC is located. Figure 1.1 shows the location of the harmonic source at Area 3 that can be identified by placing the voltage transducers (VT) and current transducers (CT) at each PCC. HSIS is capable to identify the harmonic source by taking the parameters of rms voltage, current, real power, reactive power and apparent power of the measured system. Hence, the detection of harmonic source at Area 3 is classified as a customer fault and the word “Customer” will be displayed in the graphical user interface (GUI).
Figure 1.1: Identification of Harmonic Source Using HSIS
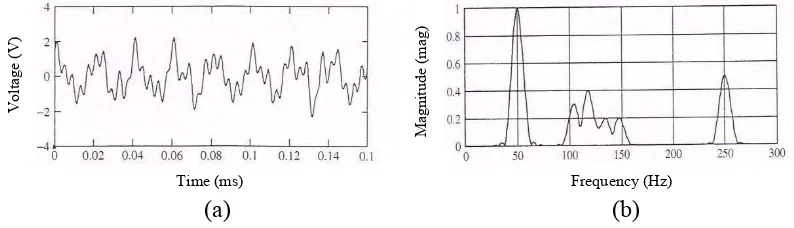
Mainly, the harmonics have varied with time according to the load conditions. From such point of view, a method based on time varying signal in an option to monitor the harmonic distortion [4]. HSIS is developed based on time domain where the value of voltage due to the time is measured by using FFT. Through the load measured in single phase system, the expected waveform with harmonic is as shown in Figure 1.2 (a). The harmonic occur in a single phase system for voltage and current is not a clean sinusoidal waveform due to non-linear loads. This signal will be analyzed and converted in term of FFT spectrum as shown in Figure 1.2 (b).
HSIS Source
240VAC
VT1 / CT1
PCC
VT2 / CT2
VT3 / CT3
Area 1 Area 2 Area 3 Harmonic Distortion Load 1 Load 6 Load 3 Load 4 Load 5 Load 2 RCCB MCB MCB MCB
(a) (b)
Figure 1.2: (a) Waveform with Harmonic Components (b) FFT Spectrum [4]
HSIS is proposed to serve as an alternative to the pricy monitoring systems available, so the performance test is conducted to ensure the capability of HSIS. Different type of loads is measured for the system performance verification due to different level of harmonic. In addition, it is well known that harmonic source detection popularity is increased because of the amount of harmonic has gained. Thus, the significant way is to monitor the level of harmonic distortion so that immediate action can be taken such as installing the filter to reduce the amount of harmonic.
1.2 Problem Statement
Harmonic distortion is mainly caused by non-linear loads supplied from the electrical appliances. This condition will form large oscillatory currents and voltage that can damage the equipment and insulation from the single phase 240VAC system. User having problems to identify the locations of the load that produced large amounts of harmonic. The capability of HSIS is able to monitor the harmonic distortion of current and voltage supplied. If the large amount of harmonic occur in a supply source, an action can be taken by the user. Different level of harmonic can be identified with different load identification in the system due to the different load demand by the user. This project is made as a safety purpose for the user to avoid using appliances than can be damaged by harmonic distortion.
1.3 Objective
This project embarks on the following objectives:
1. To simulate the voltage and current for harmonic distortion using MATLAB based on Fast Fourier Transform (FFT).
2. To develop Harmonic Source Identification System to identify the harmonic distortion from single phase 240VAC source supply.
3. To analyze the performance of the system with different load identification from single phase 240VAC source supply.
1.4 Scope of Work
Harmonic Source Identification System is developed to identify the total harmonic distortion for voltage (THDv) and current (THDi) from single phase 240VAC source supply using Fast Fourier Transform (FFT) method. Voltage and current transducer will be used to measure the harmonic distortion from single phase system with different load identification. Simulation based on voltage and current will be conducted using MATLAB and level of harmonic distortion will be presented in form of FFT spectrum. VS2015 will be used to measure the performance of the system with different load identification.
1.5 Report Outlines
summary and discussion of the proposed methods of HSIS have also explained in this chapter. Chapter 3 discusses the project methodology used in developing HSIS. Acceptable methods used in accomplishing this project are explained in details. With the help of a particular figure and block diagram, the hardware and software implementation in developing HSIS are shown. Three different loads are considered for performance test of the system.
Chapter 4 shows the results of simulations from MATLAB based on the method proposed. The effectiveness of HSIS in measurement and harmonic source identification are discussed in accordance with the results recorded by the performance test for three different types of loads.
CHAPTER 2
LITERATURE REVIEW
2.1 Introduction
In order to gain enough information to recommend the appropriate method that can be used to complete the research, comparison between certain techniques is required to measure the harmonic distortion in single phase system. The outlines in this chapter related to the theory and basic principles, review of previous related work, and summary of this project. In the first section of the research covered the definition from Institute of Electrical and Electronics Engineers (IEEE) where PCC, Total Demand Distortion (TDD), harmonic measurement methods, and voltage and current distortion limits. Besides, this section reviews on harmonic distortion occur in the single phase power system by analyzing different types of waveform for different harmonic order in the following sequence.
Institute of Electrical and Electronics Engineers (IEEE) 519-2014 stated that the measurement of harmonic distortion is recommended at PCC whereby the point is on the LV side of the distribution transformer [5]. As stated in [6], the loads contain harmonic can be pure resistive, inductive, capacitive or single phase rectifier. Nowadays, measurement of harmonic is proposed where the harmonic source is located between the utility and costumer using several methods. There will be disadvantage in measuring the harmonic at PCC for single point due to lack in accuracy. In terms of economics, PCC can increase the level of investment for harmonic measurement in power system for optimization [7].
In PCC measurement, TDD is considered as a percentage of average maximum voltage or current over a demand interval for certain time [8]. IEEE 519 stated that the demand interval in [9] is typically between 15 to 30 minutes and larger voltage or current demand will produce large distortion and vice versa. As mentioned above, TDD is not covered for interharmonics component as the main objective focused on harmonic distortion as mentioned in [6]. Based on consideration stated in [10], data taken for harmonic distortion represent best in average values for the performance of the system.
Harmonic distortion becomes the main culprit in power quality (PQ) system now. Under certain condition stated in [11] where nonlinear loads such as rectifier and arc furnace increases with the increases uses of power electronic component. This condition leads to the disturbance in a system allow appliances to operate under loss condition and increases maintenance cost. Harmonic distortion that occurs in single phase will become influenced to other appliances and leads to further damages. For example, a device like a computer that sensitive to disturbance can cause data error. The supplier will become the victim due to the loss interested in customer for their utilities. Due to this issue, researchers come with certain method that will be discussed later.
increase power factor, but may lead to the worst scenario such as harmonic [12]. In accordance, proper measuring system is the best option to monitor the performance of a system and hypothesis can be made based on the situation occur where HSIS is proposed.
2.2.1 Total Harmonic Distortion
Harmonic distortion is one of the main indices that affect the power quality. Harmonic distortion is represented in a complex time and frequency domain [12] and expressed in rms values. As mentioned in [13], due to the increases use of power electronic components, new type of harmonic source is traced. Harmonic effect can be measured either voltage or current and this distortion may lead to the increases of frequencies in the waveform [14]. Figure 2.1 presents the harmonic waveform for single phase systems.
Figure 2.1: Harmonic Signal Occur Inside Sinusoidal Signal [12]
As shown in Figure 2.1, the distortion occurs at the pure sinusoidal waveform is called notching. Notch area may affect the quality of the system. The percentage of notch depth is
Time (ms)
Vo
lta
ge
(V
)
Vs
i
iR
below [15].
���
= √∑ ��
� �=
� .
Where Vn = Single frequency r.m.s
n = Harmonic voltage N = Maximum harmonic
V1 = Fundamental line to neutral r.m.s
Based on recommendation of American National Standards Institute (ANSI) standard in [16], the THD truncation is at 5kHz, but in practical application, the value will not exceed that much due sensitivity on hardware implementation. THD may come to simple in term of measurement based on equation (2.1) but the detailed information in the power spectrum analysis for every harmonic order became the main issue.
![Figure 2.1: Harmonic Signal Occur Inside Sinusoidal Signal [12]](https://thumb-ap.123doks.com/thumbv2/123dok/495026.55045/23.612.187.445.363.592/figure-harmonic-signal-occur-inside-sinusoidal-signal.webp)
