Vol. 12, No. 1 , Agustus 1998
MEASUREMENT OF TRANSPORT PROPER TIES FOR THE
DRIED LAYER OF SEVERAL FOOD MATERIALS UNDERGOING
FREEZE-DRYING
Tetsuya ~ r a k i ' , Y. sagaral, A.H.
amb bun an',
K. ~ b d u l l a l ~ ' \ABSTRACT
The transport properties of several food materials have beet? presented us ,fundc2.nzenial irfortnurion to determine the drying rate ofpeeze-drying process. As un exatrzple, the nleasuring method of thermal condtrctivity and permeability hcrs been demonstrated for the samples of sliced and nzashed apples undergoing freeze- drying. Both samples were Ji-eeze-dried at constant surface ten~peratzn-cs ranging porn -10 to 70 under the usual pressure range of comniercial operations. A tnatheniaticul model, based on a quasi-steady state analysis, was Jormtrluted and then applied to the drying data to deternzine these transport properties for the ~lried ltryer of the sunzple undergoing,fi.eeze-drying. Valzres
of
thermal condzlctivity were ,foz,rtid to be alnlost the same between sliced and mashed .sanlples. Howevei: the perrneubility datcz of the tnashed apples were more thun 4 titnes greater th~ril that of sliced apples. Both tenzperatzire and pressure dependences on these transport properties were not recognizecl uppuretitly, and the effects of Jreezing rate on transport properties were found to be criticaljor the mashed saniples. The results indicated that the drying rate of sliced suniples MIUS limited by the trtmsJir rate of water vapor flowing through the dried IuyerThe trunsport properties for raw beeJ mi~iced beej shritnp crnd coffee solutior~s \z3ere ~xl,so yt-esented indicating the effects of operating conditions us well 'a the str~ictt~ral p~~runzeters of the satnples on these values.
Key words : freeze-drying, dried layer, thermal conductivity, permeability
INTRODUCTION o p t i ~ n u ~ n plant operations. Since the
rate of freeze-drying is limited by heat Freeze-drying has had a great and Inass transfer rates across a dried impact upon the prod~~ction of material which s ~ ~ r r o i ~ n d s the ,frozen dehydrated food because of the portion of the product, thermal superior quality of the product obtained conductivity and permeability of the and promises continued expansion of dried layer and the effects of processing the number of applications. However, factors on these transport properties are the process is only feasible if the cost fundamental information to determine of production can be lowered by the drying rate. Various method, both
8- KETEKNIKAN PERTANIAN
transient and steady state, have
bem
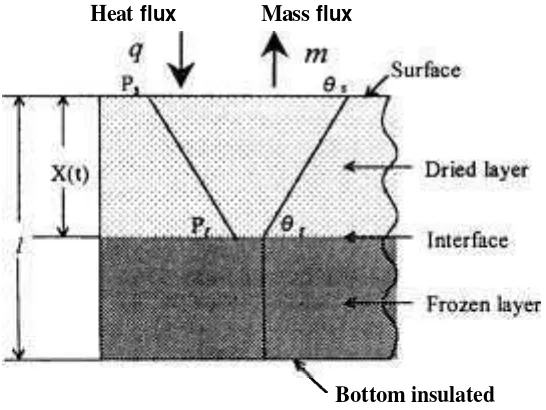
mate~ial undergoing freeze-drying. In used to determine the transport the model the material is assumed to be properties of freeze-dkied food, The a semi-infinite slab andthe
direction of transient method used in this s t u j l was haat and mass transfer is the one- based on a quasi-steady-statel analysis dimension. The insulated bottom can of actual drying data, andwas
be regarded as the center line of the described by Lusk et al. (I), Massey material heated by radiation from both and Sunderland (2), Hoge and surfaces. Furthermore, the model has Pilsworth (3), Stuart and Closset (4), several assumptions; that is, 1) The Bralsford ( 5 ) , Gaffney and Stephensaa sublimation front retreats uniformly(6) and Sandall et dtf: (7). The transport from surface of the material. 2) properties of cellular food materials Drying proceeds under a quasi-steady were measured using a steady-state state condition, and thus the changes in method by Harper and Sahrigi (8) as temperature and pressure in the well as H a w r (9). Harper and Sahrigi material and the movement of the (8) reported the values of thermal sublimation front are negligible during conductivities for freeze-dried apples calculation. 3) The linear distribution in and pears in the presence of various. tempemture and pressure exists across gases over a pressure range af 1
Pa
the
dried
layer, and the temperature of atmospheric. Harper (9) presented $le the &men layer is uniform and equal to effects of these gas pressureon+
that of sublimation front. 4) The heat permeabilities and thermal conducti- ~ y j p l i w d through the dried layer is vities of freeze-dried apples and consumed completely as the latent heat peaches. However, &ailable literatures at the sublimation front.on the transport properties for the dried Based on these assumptions, the layer of cellular food materials were equations of the heat and mass flux
limited. . were introduced, and thus the thermal
In this paper, thermal conductivity conductivity and permeability are given and permeability for the dried layer of as the following equations, respec- both sliced and mashed apples were tively:
demonstrated
40
s h ~ w the n~easuring 0,method as
hi
&kamp16..~ u & t s p m o r t $ ~ ~ ~ s i * ~
w~ ~ ( m
+
I ~ p d 6 ) l N [ I1
the transport properties, for raw beef, 01
minced beef, shrimp coffee , K;Bo 12RT
,
NM
[21solutions were
ds6
presented w f windicating the effects of o conditions as
well
as theparameters of the samples on these " ( 1 - m )
a =
P I
values. (8, - 6,) f ( - d m l d t )
THEORETI[CAL
MODEL
P
= ( 1 - m )( P , - p , ) / ( - d m l d t ) [41
Vol. 12. No. 1. Agustus 1998
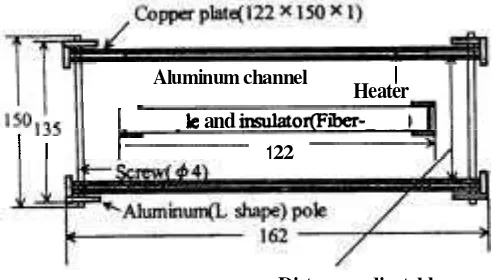
EXPERIMENT METHOD holder for solid materials or a sliced apple is shown in Figure 2. The sample,
Sample holder whose circumference was insulated
Two types of the sample holder with the fiber-glass, was located at the were prepared for solid and granular as central position of the apparatus. ~ h u s ' well as liquid materials. The sample both sample surfaces were heated by
Heat
fluxMass
flux'
Bottominsulated
Figure 1 Freeze-drying model for transport properties analysis
Aluminum channel
I
Heater
b and irisulatofliber-
I
I 1 22Distance: adjustable
Figure
2 Schematic diagram of sample holder
for solid materials
8&&k KETEKNIKAN PERTANIAN radiant heaters assembled with a silicon
heater and copper plates. The distance between heater and sample surface was adjustable with screws to increase the accuracy of the temperature control. Temperatures of the sample were monitored at both surfaces as well as center by using thermocouple probes made of 0.2 mm copper-constantan wires.
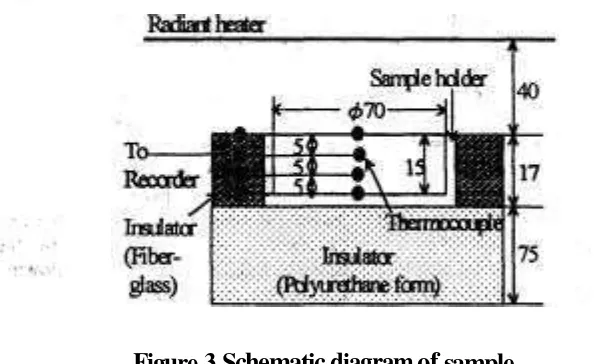
Figure 3 shows anather sample holder p r e p a w & h - & e mashed sample and measunicTg locations of temperature within the sample. The sample holder was a Plexiglas dish of 70.5mm inside diameter and 15mm in height. To promote one-dimensional freezing and freeze-drying
,
a fiber-glass insulation was placed around the side of the sample holder, and its bottom was insukited-' with a Polyuretharre foam plate. All over the exposed surfaces of the- insulating materials were covered with reflecting aluminum foil to reduce radiant hed~ < f %
to both sidc andbottom of the holder. Change in temperature distribution within the sample was measured with four thermocouple probes, which were permanently placed at the center s f the sample holder and equally spaced from the exposed surface ,of the sample. The thermocouple junction for monitoring and controtling the surface temperature was placed just under the exposed surface, and all leads were shielded from the direct radiant heat transfer by passing them through the insulation materials.
Materials and Procedure
Both sliced and mashed apples of 15mm thick were prepared as the samples. Sliced samples were cut out horizontally at the equator part, which has the largest diameter in the range from 80 to 90mm. The cores of them were removed with the cork borer whose inside diameter was 20mm. since transport properties of the core, in
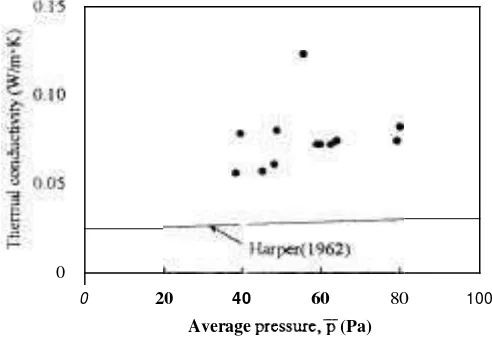
0
0 20 40 60 80 100
Average pressurc,p (Pa)
Figure 4 Pressure dependence
on
thermal
conductivity for sliced samples
which drying proceeded faster than that of flesh, was found to be different from tliat of flesh during preliminary drying experiment. Mashed ones were set in the sample holder as shown in Figure 3 . The sample was frozen one dimen- sionall~, by using a cooling copper plate at the surface temperature of -27 to 4 4 "C. and then freeze-dried at constant surfhce temperatures ranging from -10 to .70 "C i111der tlie usual pressure range of commercial operations. Moisture contents of the dried samples were determined by Karl Fisher titration method, and the initial moisture contents \\..ere calculated based on these data. As for other samples, procedures are all the same, though temperatures are different during freezing and freeze-drying stage.
RESULTS AND DISCUSSION
pressure dependence on tliese transpol t properties were not recognizecl apparently under our elperimentnl conditions, altliougli some theory, such as Chapman-Enskog formulas for tran- sport properties, showed tlie influences of temperature and pressure ( 11).
Y. H. Ma et a1 (12) pointed out tliat tlie free~e-drying rate of f ~ ) o d s \\as
lia~dly limited by the rate of \\atel vapor flowing tlirougli the dried l a ~ e r as tlie permeability value for tlle dried
layer of the material shows more than
0.1 ( x lo-' n12s-I) under the usual
operating pressure range. Values of permeability for sliced sanlples u c r e less than above-mentioned ones, as slio\vn in Table 1. From this result. it lnay be concluded tliat tlie drying rate of sliced apples was limited by tlie transfer rate of water vapor flowing tlirougli the dried layer.
Values of tlie tller~nal conductivity
Sliced apples
Frqezing time(h
Figure 5 Freeung curve
o
!
mashed samples
was similar to that of freeze-dried apples obtained by Harper's (9) steady state method, showing the increasing trend with increasing pressure. Howevel; its absolute values were relatively larger than the empirical curve presented by Harper (9), because in this study the "effective7
'-values of thermal conductivity were measured under the existing conditions of temperature and pressure gradients across the dried layer of the sample undergoing freeze drying.
The kinetic theory of the thermal conductivity
(A)
shows that h is proportional to the square of absolute temperature and is independent of the pressure, because the mean free path of a molecule is inversely proportional to the pressure. However, as shown in Figure 4, the thermal conducti~ity has a tendency to increase with increasing pressure. This shows that the mean free path of water vapor is greater than a cell's diameter of sliced apples, and as for cellular food materials, the diameter of each cell has a crucial effect upon the tl~ern~al conductivity. For the future, measurement of a cell's diameter isindispensable in order to analyze these data from a viewpailit of transport phenomena.
Mashed apples
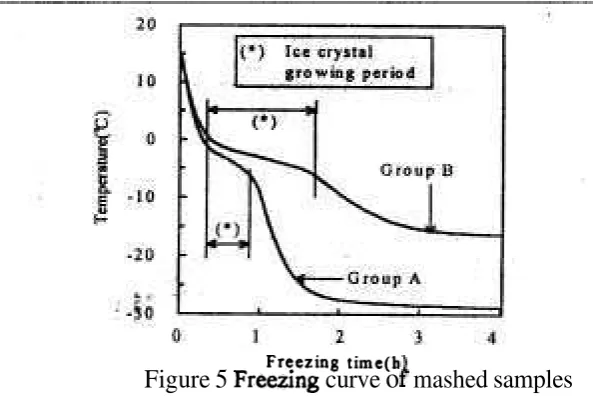
Figure 5 shows the freezing curves for mashed samples. The change with time of the center temperature during freezing could be regarded as the index of the freezing rate, and based on these indexes, mashed sanlples were classified with group A and B. The freezing rate of group A was relatively larger and B was smaller. Temperature of group B was liigher than that of A by over 10 "C after 4 hours since freezing process had started. In order to obtain tlie quantitative index, the period between two infliction points was defined as ice crystal growing period, as shown in Figure 5 (13).
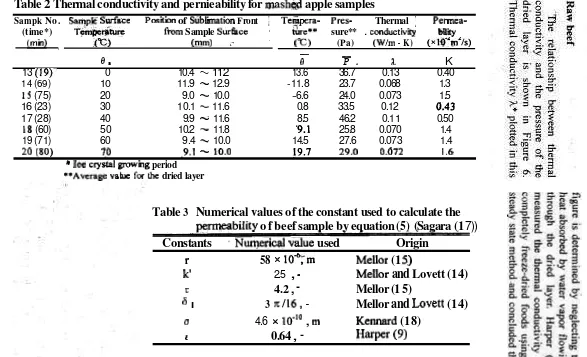
Table 2 shows values of the thermal coliductivity and permeability for mashed samples. Ice crystal growing periods of the group A and B were in tlie range from 19 to 28 min., from 60
Vol. 12, No. 1, Agustus 1998 -
these t \ \ o groups. Values of thermal were about 4times larger than that of A. conductivity ill gl-oup A \$ere about 3 The results indicated that el't.ects of
Figure
6
Thermal
conductivity
for beef
samples (Sagara
(16))
0.5. I , , ,
,
,
, ,
-
121.cr2ta abtrlnod in t h i s rpoX-
I A -lor 6 L o v o t t (1960)
-
0 -
-
-
Rworeticri. curvq.
-
-lor ( i O 7 ~ ) --
1 1 1 1 1 1 1 s .
0 -0 0.5 1 .O
w,
p
( X I O t R)Figure
7
Pemqability
vs.pressures
of
the
dried
layer
for beef samples
Voi. 12, No. 1, Agustus I998
Figure
8Thermal conductivity results for
coffee solutions (Sagara(l6))
-+y, a (
-
Figure
9Permeability vs. porosity for
Table
2
Thermal conductivity and pernieability for mash@ apple samples
Sampk No. SampE S w f ~ c e Position of Siiblimation Front
I'
Tetiipera- Pres- ThermalI
Permea- (time*) T + ~ W fFom Sample Surfwe * &re** sure**.
conductivii Way(min) ,fC) (mm) ,. " ("C) (Pa) (Wlm
-
K) ( ~ l ~ ' r n ' / s )-
-
0 * 0
P .
?b K13 (19), 0 10.4 -- 11.2 13.6 36.7 0.13 0.40 14 (69) 10 11.9
-
12.9 -11.8 23.7 0.068 1.31
S
(75) 20 9.0-
10.0 -6.6 24.0 0.073 1.516 (23) 30 10.1
-
11.6 0.8 33.5 0.12 (1.4317 (28) 40 9.9 11.6 8.5 46.2 0.1 1 0.50
18 (60) 50 10.2 -- 11.8 9.1 25.8 0.070 1.4
19 (71) 60 9.4
-.
10.0 14.5 27.6 0.073 1.420 (80) 70 -9.1
-
10.0 19.7 29.0 0.072 1.6*
Ice crystal gnnumg period **~verage vakre f& dried layerTable
3
Numerical values of the constant used to calculate the
mrmeability o f beef sample by equation
(5) (Sagara (1
7))
Constants
'Nuqeacal value used
Origin
r
58
xlod;rn
Mellor (1
5.)
k'
2.5,
-
Mellor
and
Lovett (14)
T
4.2
,
-
Mellor (1
5)
6
I3
~ 1 1 6 ,
-
Mellor
and
Lovett (1 4)
u 4.6 x10"O
,
nr
Kennard (1 8)
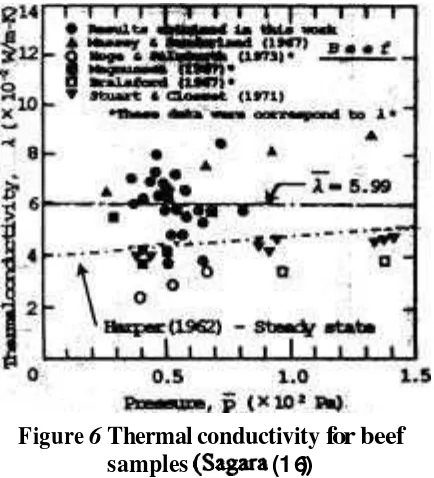
Vol. 12, No. 1, Agustus 1998 the experimental data can be adequate- Coffee solution
ly correlated by an empirical equation. A curve in Figure 6 was calculated by applying the recommended values for beef to his equation. Although effect of the pressure on thermal conductivity was not measured in this study as described above, it was considered that the thermal conductivity essentially had a tendency to increase as tlie pressure increase as shown in the curve.
Permeability vs. the pressure of the dried layer relationship are shown in Figure 7. Mellor and 1,ovett (14) applied values of the structural parameter to an equation derived on the basis of collision theory (15) for the ~ermeability in terms of the mean free path, giving K as in equation [5].
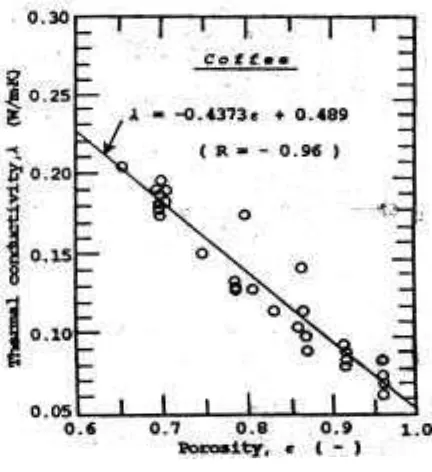
The result obtained in the present studies has shown clearly that thermal cotiductivity has been markedly affected by solute concentration or the porosity of the dried layer as shown in Figure 8. Porosity was assessed from cumulative composition using 0.625 specific volume for pure coffee soluble. A linear relationship between thernial conductivity and porosity was obtained and the equation of a regression line fitted to all of the data is also presented in Figure 8.
The relationship between permeabi- lity and porosity at various dried layer temperatures is shown in Figure 9. The curve of K,,,, in Figure 9 was
Tlie values for K were in good agreement with Mellor's (1 5) tlieoretical curve based on a collision theory and also with their experimental data using completely freeze-dried salnples under steady-state conditions. Table 3 shows tlie numerical values of the constant applied to the equation (5). As the drier layer temperature was increased, permeability had a tendency to increase at the surface temperature ranging 30 to 80 "C and to decrease from 80 to 100 O C . It was considered that in this surface temperature range the heat supplied across the dried layer was dissipated as both sensible heat to raise the temperature of the frozen layer and latent of sublimation. Thus the model applied over this temperature range was found to provide invalid values because the drying conditions did not satisfy tlie assumption used in tlie model as mentioned before.
calculated from the maximum values of temperature (26 "C) as well as pressure (65Pa) applying structural parameters obtained from equation (5). Tlie calculation method of K,,,,,, is tlie same (-5 "C, 25Pa) as described for K,,,,,. Permeability was found to depend mainly on the solute concentration or the porosity of the dried layer and then otlier factors such as temperature or pressure had been of the dried layer.
Other food materials
h)
-Table
4
Thermal conductivity and permeability for several food materials
~
Matd&
Temperature
the chamber Temperature* Pressure* conductivity Permeability Referencee c >
(Pa)@)
(Pa) (W/m*K) (x 1 ~ ‘ ~ m ~ l s )8s
Ps 8T
I
K
Sliced apple -10- 10 20-30 -1 7.7-3.4 38.4-'80.0 0.056-0.1 23 0.063-0.120 (obtained
in
this
work)~ a s h e d appl(A)* 0-40 20-30 -13.6-8.5 33.5-46.2 0.1 1-0.13 0.40-0.50 (obtained
in this
work)
~ p l e ( ~ ) * 1 0-70 20-30 -1 1.8-19.7 23.7-29.0 0.068-0.073 1.3- 1.6 (obtained
in
this
work)Beef 30-100 7-30 3.0-40.8 38.2-78.5 0.036-0.084 0.090-0.405 Sagant et al. (19)
Minced beef
40 2.7- 13.3 7.3-10.3-
0.050-0.069 0.13-0.24 Widodo and Tambunancoffee solution 20-53 10-95 -5.3- 14.8
-
0.062-0.1 72 0.340- 1.220 Sagara andHosoluiwa
((6-30%)***
Coffee solution -7-7 1 7-12 -14.1 -26.1 47.1-66.8 0.1 53-0.277 0.213-0.649 Sagara and Ichiba (21)
(29-45%)***
Coffee dution 60 22-34 12.9-20.2 24.9-64.9 0.063-0.144 0.508-4.235 Ichiba
(13)
(1 0-36%)***
shtimp
30-50 7-133 4.2-21.2 53.6-263 0.038-0.086 0.03 1-0.120 Wenur (22)-i P i D I
-*Average value
for
the dried layer **(A) Rapid tieezingand (B) Slow FreezingVol. 12. No. 1. Aaustus 1998
shrimp was limited by water vapor transfer flowing through the dried layer, such as sliced apple. In this study, the surface temperature of the slice sample could not be set at more than 10 "C to maintain an original structure. However, as shown in Table 4, the surface temperature of shrimp was ranging from 30 to 50 OC. The result indicated that the transport properties of shrimp should be measured and investigated under lower surface temperature conditions in connection with the structural nature as well as operating parameters.
NOMENCLATURE
C, = specific heat at constant pressure,
J/(kg-K)
Dl, = Knudsen diffusion coefficient, m2/s
AH = latent heat of sublimation of ice, J/kg
K = permeability, m2/s
k ' = structural constant,
-
I = thickness of slab, m
f i = mass flux density (mass transfer rate), kg/(m2-s)
m = the fraction of water remaining,
-
M = molecular weight, kg/mol
N = 1 (in radiant heating upon one surface), - ; 4 (in radiant heating upon double surfaces),
-
p = pressure, Pa
= heat flux (heat transfer rate), ~/(m's)
R = gas constant, J/(mol-K)
r = equivalent pore radius, m
T = absolute temperature, K t = time, s
X(t) = position of the sublimation front,
-
Creek letters
a = constant defined by equation (3)
p
= constant defined by equation (4) 6 , = roughness factor bf pore,-
E = porosity, -
6' = temperature, "C
h = thermal conductivity, W/(m-K)
(Equation (1)) p = density, kg/m3
r = tortuosity factor,
-
Subscripts
f sublimation front
s surface
w Water yapor
REFERENCES
Lusk, G., Karel, M. and Goldbiith, S.A., 1954, Thermal conductivity of Some Freeze-Dried Fish, Food Technology, 18(10) pp. 1625-1 628 Massey, W. M. and Sunderland, J. E.,
1967, Measurement of Thermal Conductivity during Freeze-drying of Beef, Food Technology, 21(3A)
pp.90A-94A
Hoge, H.J. and Pilsworth, M.N., 1973, Freeze-Drying of Beef, J. of Food Science, 38 pp.841-848
Stuart, E.B. and Closset, G., 197 1, Pore Size Effect in the Freeze-Drying Process, J. of Food Science, 36 pp.388-39 1
Braisford, R., 1967, Freeze-Deying of Beef, J. of Food Technology, 2 pp.339-363
Gaffney, J.J. and Stephenson, K.Q., 1968, Apparent Thermal Conduc- tivity during Freeze-Drying of a Food Model, Trans. of ASAE,
1 l(6) pp.874-880
Sandall, O.C., King
,
C.J. and Wilke, C.R., 1967, The Relation-ship Between Transport Properties and Rates of Freeze-Drying of Poultry Meat, AIChE J. 13(3) pp.428-438 Harper, J.C. and El Sahrigi, A.F., 1964,~&i!e&k KETEKNIKAN PERTAMIAN
of Gases in Porous Media at Reduced Pressures with Reference to Freeze-Drying, AIChE J., 8(3) pp.298-302
Sagara, Y. and Hosokawa, A., 1982, Dry Layer Transport Properties and Freeze-Drying Characteristics of Coffee Solutions, Proc. Third Int. Drying Symposium IDS'82, Birm ingharn, pp.487-496
Bird, R.B., Stewart, W.E. and Lightfoot, E.N., 1960, Transport Phenomena, Wiley, pp.253-260, 508-5 13
Ma, Y.H. and Peltre, P.R., 1975, Freeze-Dehydration by Microwave Energy: Part 1 Theoretical Inves- tigation, Part 2 Experimental Study, AIChE J., 21(2) pp.335-350 Ichiba, J., 1994, The Effect of Freezing Rate on Drying Characteristics of Granular Food Matefials: Change in the Structure and
.
Transport Properties, MD's Thesis, The University of Tokyo, pp.60-62 Mellor, J.D. and Lovett, D.A., Vacuum,Vol. 18, p.625
Mellor, J.D., 1978, Fundamentals of Freeze-brying, pp.94- 128, Acade- mic Press, London
Sagara, Y., Automatic Measurement System for Transport Properties of Food Samples Undergoing Subli- mation Dehydration, Advances in
Food Engineering, pp. 1 1 1- 124 Sagara,
Y.,
1986, Transport PropertiesMeasurement of Food Sample Undergoing Sublimation Dehydra- tion, Proc. Fifth Int. Drying,Sym- posium IDS '86, Boston, pp.413- 42 1
Kennard, E. H., 1938, Kinetic Theory of Gases, 149, McGrow-Hill Sagara, Y., Kameoka, T. and Hoso-
kawa, A., 1982, Measurement of Thermal Conductivity and Perme- ability of the Dried Layer during Freeze Drying of Beef, J. of Soci. Agr. Machinery, Japan 44(3) Widodo, M. and A.H.Tambunan, 1996,
Penentuan Nilai Konduktivitas Panas dan Permeabilitas Uap Air pada Lapisan Kering Daging Sapi Giling selama Proses ~ e n ~ e r i n g a n Beku, Bul. Keteknikan Pert., Th.X No.2, pp.52-60
Sagara, Y. and Ichiba, J., 1994, Measu- rement of Transport Properties for the Dried Layer of Coffee Solution Undergoing Freeze Drying, Dry- ing Technology, 12(5), pp. 108 1- 1103
Vol. 12, No. 1 , Agustus 1998
MEASUREMENT OF TRANSPORT PROPER TIES FOR THE
DRIED LAYER OF SEVERAL FOOD MATERIALS UNDERGOING
FREEZE-DRYING
Tetsuya ~ r a k i ' , Y. sagaral, A.H.
amb bun an',
K. ~ b d u l l a l ~ ' \ABSTRACT
The transport properties of several food materials have beet? presented us ,fundc2.nzenial irfortnurion to determine the drying rate ofpeeze-drying process. As un exatrzple, the nleasuring method of thermal condtrctivity and permeability hcrs been demonstrated for the samples of sliced and nzashed apples undergoing freeze- drying. Both samples were Ji-eeze-dried at constant surface ten~peratzn-cs ranging porn -10 to 70 under the usual pressure range of comniercial operations. A tnatheniaticul model, based on a quasi-steady state analysis, was Jormtrluted and then applied to the drying data to deternzine these transport properties for the ~lried ltryer of the sunzple undergoing,fi.eeze-drying. Valzres
of
thermal condzlctivity were ,foz,rtid to be alnlost the same between sliced and mashed .sanlples. Howevei: the perrneubility datcz of the tnashed apples were more thun 4 titnes greater th~ril that of sliced apples. Both tenzperatzire and pressure dependences on these transport properties were not recognizecl uppuretitly, and the effects of Jreezing rate on transport properties were found to be criticaljor the mashed saniples. The results indicated that the drying rate of sliced suniples MIUS limited by the trtmsJir rate of water vapor flowing through the dried IuyerThe trunsport properties for raw beeJ mi~iced beej shritnp crnd coffee solutior~s \z3ere ~xl,so yt-esented indicating the effects of operating conditions us well 'a the str~ictt~ral p~~runzeters of the satnples on these values.
Key words : freeze-drying, dried layer, thermal conductivity, permeability
INTRODUCTION o p t i ~ n u ~ n plant operations. Since the
rate of freeze-drying is limited by heat Freeze-drying has had a great and Inass transfer rates across a dried impact upon the prod~~ction of material which s ~ ~ r r o i ~ n d s the ,frozen dehydrated food because of the portion of the product, thermal superior quality of the product obtained conductivity and permeability of the and promises continued expansion of dried layer and the effects of processing the number of applications. However, factors on these transport properties are the process is only feasible if the cost fundamental information to determine of production can be lowered by the drying rate. Various method, both
8- KETEKNIKAN PERTANIAN
transient and steady state, have
bem
mate~ial undergoing freeze-drying. In used to determine the transport the model the material is assumed to be properties of freeze-dkied food, The a semi-infinite slab andthe
direction of transient method used in this s t u j l was haat and mass transfer is the one- based on a quasi-steady-statel analysis dimension. The insulated bottom can of actual drying data, andwas
be regarded as the center line of the described by Lusk et al. (I), Massey material heated by radiation from both and Sunderland (2), Hoge and surfaces. Furthermore, the model has Pilsworth (3), Stuart and Closset (4), several assumptions; that is, 1) The Bralsford ( 5 ) , Gaffney and Stephensaa sublimation front retreats uniformly(6) and Sandall et dtf: (7). The transport from surface of the material. 2) properties of cellular food materials Drying proceeds under a quasi-steady were measured using a steady-state state condition, and thus the changes in method by Harper and Sahrigi (8) as temperature and pressure in the well as H a w r (9). Harper and Sahrigi material and the movement of the (8) reported the values of thermal sublimation front are negligible during conductivities for freeze-dried apples calculation. 3) The linear distribution in and pears in the presence of various. tempemture and pressure exists across gases over a pressure range af 1
Pa
the
dried
layer, and the temperature of atmospheric. Harper (9) presented $le the &men layer is uniform and equal to effects of these gas pressureon+
that of sublimation front. 4) The heat permeabilities and thermal conducti- ~ y j p l i w d through the dried layer is vities of freeze-dried apples and consumed completely as the latent heat peaches. However, &ailable literatures at the sublimation front.on the transport properties for the dried Based on these assumptions, the layer of cellular food materials were equations of the heat and mass flux
limited. . were introduced, and thus the thermal
In this paper, thermal conductivity conductivity and permeability are given and permeability for the dried layer of as the following equations, respec- both sliced and mashed apples were tively:
demonstrated
40
s h ~ w the n~easuring 0,method as
hi
&kamp16..~ u & t s p m o r t $ ~ ~ ~ s i * ~
w~ ~ ( m
+
I ~ p d 6 ) l N [ I1
the transport properties, for raw beef, 01
minced beef, shrimp coffee , K;Bo 12RT
,
NM
[21solutions were
ds6
presented w f windicating the effects of o conditions as
well
as theparameters of the samples on these " ( 1 - m )
a =
P I
values. (8, - 6,) f ( - d m l d t )
THEORETI[CAL
MODEL
P
= ( 1 - m )( P , - p , ) / ( - d m l d t ) [41
Vol. 12. No. 1. Agustus 1998
EXPERIMENT METHOD holder for solid materials or a sliced apple is shown in Figure 2. The sample,
Sample holder whose circumference was insulated
Two types of the sample holder with the fiber-glass, was located at the were prepared for solid and granular as central position of the apparatus. ~ h u s ' well as liquid materials. The sample both sample surfaces were heated by
Heat
fluxMass
flux'
Bottominsulated
Figure 1 Freeze-drying model for transport properties analysis
Aluminum channel
I
Heater
b and irisulatofliber-
I
I 1 22Distance: adjustable
Figure
2 Schematic diagram of sample holder
for solid materials
8&&k KETEKNIKAN PERTANIAN radiant heaters assembled with a silicon
heater and copper plates. The distance between heater and sample surface was adjustable with screws to increase the accuracy of the temperature control. Temperatures of the sample were monitored at both surfaces as well as center by using thermocouple probes made of 0.2 mm copper-constantan wires.
Figure 3 shows anather sample holder p r e p a w & h - & e mashed sample and measunicTg locations of temperature within the sample. The sample holder was a Plexiglas dish of 70.5mm inside diameter and 15mm in height. To promote one-dimensional freezing and freeze-drying
,
a fiber-glass insulation was placed around the side of the sample holder, and its bottom was insukited-' with a Polyuretharre foam plate. All over the exposed surfaces of the- insulating materials were covered with reflecting aluminum foil to reduce radiant hed~ < f %
to both sidc andbottom of the holder. Change in temperature distribution within the sample was measured with four thermocouple probes, which were permanently placed at the center s f the sample holder and equally spaced from the exposed surface ,of the sample. The thermocouple junction for monitoring and controtling the surface temperature was placed just under the exposed surface, and all leads were shielded from the direct radiant heat transfer by passing them through the insulation materials.
Materials and Procedure
Both sliced and mashed apples of 15mm thick were prepared as the samples. Sliced samples were cut out horizontally at the equator part, which has the largest diameter in the range from 80 to 90mm. The cores of them were removed with the cork borer whose inside diameter was 20mm. since transport properties of the core, in
0
0 20 40 60 80 100
Average pressurc,p (Pa)
Figure 4 Pressure dependence
on
thermal
conductivity for sliced samples
which drying proceeded faster than that of flesh, was found to be different from tliat of flesh during preliminary drying experiment. Mashed ones were set in the sample holder as shown in Figure 3 . The sample was frozen one dimen- sionall~, by using a cooling copper plate at the surface temperature of -27 to 4 4 "C. and then freeze-dried at constant surfhce temperatures ranging from -10 to .70 "C i111der tlie usual pressure range of commercial operations. Moisture contents of the dried samples were determined by Karl Fisher titration method, and the initial moisture contents \\..ere calculated based on these data. As for other samples, procedures are all the same, though temperatures are different during freezing and freeze-drying stage.
RESULTS AND DISCUSSION
pressure dependence on tliese transpol t properties were not recognizecl apparently under our elperimentnl conditions, altliougli some theory, such as Chapman-Enskog formulas for tran- sport properties, showed tlie influences of temperature and pressure ( 11).
Y. H. Ma et a1 (12) pointed out tliat tlie free~e-drying rate of f ~ ) o d s \\as
lia~dly limited by the rate of \\atel vapor flowing tlirougli the dried l a ~ e r as tlie permeability value for tlle dried
layer of the material shows more than
0.1 ( x lo-' n12s-I) under the usual
operating pressure range. Values of permeability for sliced sanlples u c r e less than above-mentioned ones, as slio\vn in Table 1. From this result. it lnay be concluded tliat tlie drying rate of sliced apples was limited by tlie transfer rate of water vapor flowing tlirougli the dried layer.
Values of tlie tller~nal conductivity
Sliced apples
Frqezing time(h
Figure 5 Freeung curve
o
!
mashed samples
was similar to that of freeze-dried apples obtained by Harper's (9) steady state method, showing the increasing trend with increasing pressure. Howevel; its absolute values were relatively larger than the empirical curve presented by Harper (9), because in this study the "effective7
'-values of thermal conductivity were measured under the existing conditions of temperature and pressure gradients across the dried layer of the sample undergoing freeze drying.
The kinetic theory of the thermal conductivity
(A)
shows that h is proportional to the square of absolute temperature and is independent of the pressure, because the mean free path of a molecule is inversely proportional to the pressure. However, as shown in Figure 4, the thermal conducti~ity has a tendency to increase with increasing pressure. This shows that the mean free path of water vapor is greater than a cell's diameter of sliced apples, and as for cellular food materials, the diameter of each cell has a crucial effect upon the tl~ern~al conductivity. For the future, measurement of a cell's diameter isindispensable in order to analyze these data from a viewpailit of transport phenomena.
Mashed apples
Figure 5 shows the freezing curves for mashed samples. The change with time of the center temperature during freezing could be regarded as the index of the freezing rate, and based on these indexes, mashed sanlples were classified with group A and B. The freezing rate of group A was relatively larger and B was smaller. Temperature of group B was liigher than that of A by over 10 "C after 4 hours since freezing process had started. In order to obtain tlie quantitative index, the period between two infliction points was defined as ice crystal growing period, as shown in Figure 5 (13).
Table 2 shows values of the thermal coliductivity and permeability for mashed samples. Ice crystal growing periods of the group A and B were in tlie range from 19 to 28 min., from 60
Vol. 12, No. 1, Agustus 1998 -
these t \ \ o groups. Values of thermal were about 4times larger than that of A. conductivity ill gl-oup A \$ere about 3 The results indicated that el't.ects of
Figure
6
Thermal
conductivity
for beef
samples (Sagara
(16))
0.5. I , , ,
,
,
, ,
-
121.cr2ta abtrlnod in t h i s rpoX-
I A -lor 6 L o v o t t (1960)
-
0 -
-
-
Rworeticri. curvq.
-
-lor ( i O 7 ~ ) --
1 1 1 1 1 1 1 s .
0 -0 0.5 1 .O
w,
p
( X I O t R)Figure
7
Pemqability
vs.pressures
of
the
dried
layer
for beef samples
Voi. 12, No. 1, Agustus I998
Figure
8Thermal conductivity results for
coffee solutions (Sagara(l6))
-+y, a (
-
Figure
9Permeability vs. porosity for
Table
2
Thermal conductivity and pernieability for mash@ apple samples
Sampk No. SampE S w f ~ c e Position of Siiblimation Front
I'
Tetiipera- Pres- ThermalI
Permea- (time*) T + ~ W fFom Sample Surfwe * &re** sure**.
conductivii Way(min) ,fC) (mm) ,. " ("C) (Pa) (Wlm
-
K) ( ~ l ~ ' r n ' / s )-
-
0 * 0
P .
?b K13 (19), 0 10.4 -- 11.2 13.6 36.7 0.13 0.40 14 (69) 10 11.9
-
12.9 -11.8 23.7 0.068 1.31
S
(75) 20 9.0-
10.0 -6.6 24.0 0.073 1.516 (23) 30 10.1
-
11.6 0.8 33.5 0.12 (1.4317 (28) 40 9.9 11.6 8.5 46.2 0.1 1 0.50
18 (60) 50 10.2 -- 11.8 9.1 25.8 0.070 1.4
19 (71) 60 9.4
-.
10.0 14.5 27.6 0.073 1.420 (80) 70 -9.1
-
10.0 19.7 29.0 0.072 1.6*
Ice crystal gnnumg period **~verage vakre f& dried layerTable
3
Numerical values of the constant used to calculate the
mrmeability o f beef sample by equation
(5) (Sagara (1
7))
Constants
'Nuqeacal value used
Origin
r
58
xlod;rn
Mellor (1
5.)
k'
2.5,
-
Mellor
and
Lovett (14)
T
4.2
,
-
Mellor (1
5)
6
I3
~ 1 1 6 ,
-
Mellor
and
Lovett (1 4)
u 4.6 x10"O
,
nr
Kennard (1 8)