ISSN: 1693-6930
accredited by DGHE (DIKTI), Decree No: 51/Dikti/Kep/2010 431
Modeling and Control PV-Wind Hybrid System Based
On Fuzzy Logic Control Technique
Doaa M. Atia1, Faten H. Fahmy1, Ninet M. Ahmed1, Hassen T. Dorrah2
1
Electronics Research Institute, Cairo, Egypt
2 Faculty of Engineering, Cairo University, Egypt
e-mail: [email protected]
Abstrak
Ketika permintaan energi di seluruh dunia meningkat, kebutuhan akan sumber energi terbarukan yang tidak akan membahayakan lingkungan juga meningkat. Tujuan keseluruhan dari sistem energi terbarukan adalah untuk memperoleh listrik yang biaya yang kompetitif dan lebih menguntungkan dibandingkan dengan sumber energi lain. Desain yang optimal dari sistem energi terbarukan secara signifikan dapat meningkatkan kinerja ekonomis dan teknis dari suatu sumber tenaga. Makalah ini menyajikan manajemen kontrol daya dengan menggunakan teknik kendali logika fuzzy. Model matematika lengkap disertai model MATLAB/Simulink diusulkan sebagai bagian dari sistem budidaya untuk diterapkan sebagai alat untuk melacak kinerja sistem. Hasil simulasi menunjukkan adanya kelayakan teknik kontrol yang diusulkan
Kata kunci: bank baterai, kontrol logika fuzzy (FLC), sistem hibrida, susunan sel surya, turbin angin
Abstract
As energy demands around the world increase, the need for a renewable energy sources that will not harm the environment is increased. The overall objective of renewable energy systems is to obtain electricity with competitive cost and even benefit with respect to other energy sources. The optimal design of renewable energy system can significantly improve the economical and technical performance of power supply. This paper presents the power management control using fuzzy logic control technique. Also, a complete mathematical modeling and MATLAB/Simulink model for the proposed the electrical part of an aquaculture system is implemented to track the system performance. The simulation results show the feasibility of control technique.
Keywords: battery banks, fuzzy logic control (FLC), hybrid system, PV array, wind turbine
1. Introduction
2. Modeling of Hybrid System Components
The goal of this work is to simulate the operation of PV-wind battery hybrid energy system as accurate as possible. To achieve this aim, one needs a set of relative detailed models. In this section, the individual mathematical model for each component is developed in MATLAB.
Various modeling techniques are developed by researchers to model components of hybrid renewable energy system (HRES). Performance of individual components is either modeled by deterministic or probabilistic approaches. General methodology for modeling HRES components like PV, wind and battery is described below.
2.1. PV Mathematical Model
A PV system consists of many cells which connected in series and parallel to provide the desired output terminal voltage and current, and exhibits a nonlinear I–V characteristic [9-11]. The PV cell equivalent model represents the dynamic nonlinear I–V characteristics of the PV system is described below [9-11]. The operating equation of current – voltage characteristics of solar cell under illumination effect is expressed by [12-14]
Light generated current is given as:
(
)
Where reverse saturation current of PV cell is represented by
(
)
Cell temperature can be calculated by using the following equation [14]
G V Output voltage of PV array, (V).
Ns Number of series modules. Np Number of parallel strings. Il g Light generated current, (A).
Io Revese saturation current at operating temperature, (A). Isc Short circuit current at 28°c and 1000 W/m2 (=2.52 A). a, b Ideality factors (=1.92).
Tr Reference temperature (=301 K). Tp Cell temperature (K).
Tc Cell temperature (°C).
k Boltezmann' s constant (=1.38×10⁻²³ J/K).
G Cell illumination,W/m2.
Gr Reference illumination (=1000 W/m2). Ego Band gab for silicon (=1.11 ev).
m Short circuit current temperature coefficient (=0.0017 A/°C).
Ul Heat transfer coefficient. Iscr Reference short circuit current. Vocr Reference open circuit voltage.
τα Emittance absorptance product.
2.2. Wind Turbine Generator
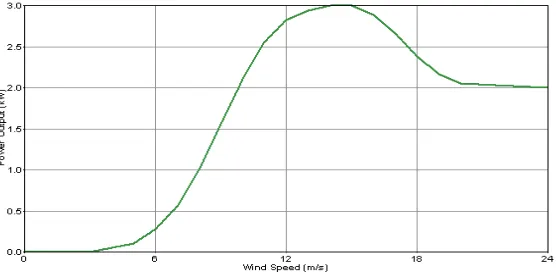
There are several existing models for the estimation of wind turbine power, such as the linear model, the model based on Weibull parameters and the quadratic model [15-19]. Choosing a suitable model is very important for wind turbine power simulation. There are three main factors that determine the output power of a wind turbine, i.e. the output power curve (determined by aerodynamic power efficiency, mechanical transmission and converting electricity efficiency) of a chosen wind turbine, the wind speed distribution of a selected site where the wind turbine is installed, and the tower height. The power curve of the machine reflects the aerodynamic, transmission and generation efficiencies of the system in an integrated form. Figure 1 shows the typical power curve of a generic wind turbine. The rated power of the turbine is 3 KW. The given curve is a theoretical one, and in practice we may observe the velocity power variation in a rather scattered pattern.
Figure 1. Power curve of wind turbine.
The power curve of a wind turbine is non-linear. The data is available from the manufacturer and can be easily digitized and the resulting table can be used to simulate the wind turbine performance [20]. The outlet energy of a turbine could be calculated from its power-speed curve [21, 22]. The output power of each WG unit versus wind speed is, always, given by manufacturer and usually describes the real power transferred from WG to DC bus. In this study, Generic Wind turbine is considered. It has a rated capacity of 3 kW and provides 24 V DC at the output. The characteristic equation of wind generator is obtained by fitting the practical output characteristic curve using a least square minimization technique [23]. By using curve fitting to obtain a mathematical modeling of nonlinear region in power curve of wind turbine, the curve fitting equation of the output characteristic of wind generator can be expressed as [24]
< <
< < +
+ + +
< =
o s r r
r s i s
i s
V V V if P
V V V if e
d a
V V if
P V bV cV V
0
2 s 3 s 4
s (7)
p
A
p
w=
wη
(8)where,
Vs Velocity (m/s).
P Output power density (W/m2).
Pr Rated power density (W/m2). Pw Output power of wind turbine (W). a, b, c, d, e Fitting parameters.
Aw Total swept area (m2).
η Generator efficiency.
To express the exact model that represent the used of wind turbine power curve, the curve fitting using MATLAB toolbox has been used to extract the model. Linear model Poly4is used and the coefficient are (with 95% confidence bounds): a = 0.0005096, b = -0.02656, c = 0.4564, d= -2.747, e = 5.362, SSE: 0.03718, R-square: 0.998 and RMSE: 0.05566.
2.3. The Battery Storage Model
The battery model describes the relationship between the voltage, current and the state of charge is discussed. The equivalent electrical circuit of storage battery is adopted by Figure 6.4.The terminal voltage of a battery can be expressed in terms of its open circuit voltage and the voltage drop across the internal resistance of the battery [25]:
B B r B V I R
V = + (9)
Where,
ςΒ Battery terminal voltage (V).
IB Battery current (A) (positive when charging and negative when discharging).
Vr Rest voltage (V).
RB Internal resistance of the battery (ohms).
The rest voltage, Vr, is expressed in terms of cell temperature as
(
)
[
c r]
r T T
V = 2.04 1− 0.001 − (10)
The battery resistance during charge and discharge process is given by:
(
) (
)
+ +
+
= -0.9 ln 300 1
-142 . 1
189 . 0 1
BC I SOC
SOC R
BC
R B
i
BC (11)
+
= i
BD R
SOC BC
R - 1 0.189 (12)
(
)
[
1-0.02 - r]
15 .
0 T T
Ri= c (13)
The battery state of charge is the instantaneous ratio of the actual amount of charge stored in the battery and the total charge capacity of the battery at a certain battery current. In the model, it is estimated as [26-28]:
BC Q SOC
SOC= o + (14)
where,
BC Battery capacity.
SOC Battery state of charge.
Tr Reference temperature.
Tc Cell temperature.
SOC0 Previous SOC.
Q Amount of exchanged charge from the previous time to the time of interest (C).
BC Battery capacity (Ah).
3. The Fuzzy Logic Concept
Fuzzy logic arose from a desire to incorporate logical reasoning and the intuitive decision making of an expert operator into an automated system [8]. The aim is to make decision based on a number of learned or predefined rules, rather than numerical calculations. Fuzzy logic incorporates rule-base structure in attempting to make decisions [8, 27]. However, before the rule-base can be used, the input data should be represented in such a way as to retain meaning, while, still allowing for manipulation. Fuzzy logic is an aggregation of rules based on the input state variables condition with a corresponding desired output. A mechanism must exist to decide on which output or combination of the different outputs will be used since each rule could conceivably result in a different output action. Fuzzy logic can be viewed as an alternative form of input-output mapping.
The fuzzy rule representation is based on linguistic [8, 27]. Thus, the input is a linguistic variable that corresponds to the state variable under consideration. In fuzzy logic control, the term “linguistic variable” refers to whatever state variables the system designer is interested in [8]. The fuzzy variable is perhaps better described as a fuzzy linguistic qualifier. Once, the linguistic and fuzzy variables have been specified, the complete inference system can be defined as developing a FIS and applying it to a control problem involves several steps:
a. Fuzzification.
b. Fuzzy rule evaluation (fuzzy inference engine). c. Defuzzification.
4. Electrical System Control
The aim of PV wind battery hybrid system controller is to ensure the management of the power, which is delivered by the hybrid system to satisfy the load and to charge the lead acid battery during the period of excess generated energy. The power management strategy flowchart is adopted in Figure 2. The block diagram of controlling the PV wind battery hybrid system using FLC is shown in Figure 3.
Figure 2. Power management of PV wind hybrid system.
Figure 3. Block diagram of fuzzy logic control for PV wind battery hybrid system.
Figure 4. Block diagram of fuzzy logic control for electrical system.
Start
Disconnect load
Pg> PL
SOC > SOCmax
DOD > DODmin
Discharge
Charge
Dissipate excess power
Supply load
End Yes
Yes No
No
Weather data,
PL, PPV, Pw, PB, SOC, DOD
Yes No
d/dt g1
g2
FLC Battery +
+
- PLref
+
ــ PLg
g3
E PPV
Pw
e (7)
ce (7)
output1 (7) electrical
The reference load is compared with the generated power to produce the error signal which used as input signal to FLC. Membership function values are assigned to the linguistic variables, using seven fuzzy subsets: NB (negative big), NM (negative medium), NS (negative small), ZE (zero), PS (positive small), PM (positive medium), and PB (positive big). The value of input error (e) and change of error (ce) are normalized by an input scaling factor.
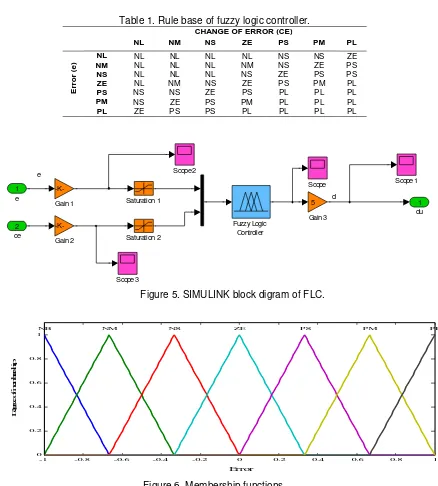
The triangular shape of the membership function of this arrangement presumes that for any particular input there is only one dominant fuzzy subset. The composition operation is the method by which the controlled output is generated. The Max–Min method is used. The output membership function of each rule is given by the Minimum. Table 1 shows the rule base of the FLC. As a system usually requires a non fuzzy value of control, a defuzzification stage is needed. Defuzzification for this system is the center of gravity method which is simple and fast. The overall system SIMULINK block diagram is presented in Figure 4. The block diagram of FLC unit built in MATLAB SIMULINK is shown in Figure 5. The triangular membership function used in this control design summarized in Figure 6.
Table 1. Rule base of fuzzy logic controller.
CHANGE OF ERROR (CE)
NL NM NS ZE PS PM PL
E
rr
o
r
(e
) NM NL NL NL NL NL NL NL NM NL NS NS NS ZE ZE PS
NS NL NL NL NS ZE PS PS
ZE NL NM NS ZE PS PM PL
PS NS NS ZE PS PL PL PL
PM NS ZE PS PM PL PL PL
PL ZE PS PS PL PL PL PL
Figure 5. SIMULINK block digram of FLC.
Figure 6. Membership functions.
e
d
du 1
Scope 3
Scope2
Scope 1 Scope
Saturation 2 Saturation 1
Gain 3 5
Gain 2 -K-Gain 1
-K-Fuzzy Logic Controller ce
2 e 1
-1 -0.8 -0.6 -0.4 -0.2 0 0.2 0.4 0.6 0.8 1
0 0.2 0.4 0.6 0.8 1
Error
D
eg
re
e
o
f
m
em
b
er
sh
ip
5. System Simulation
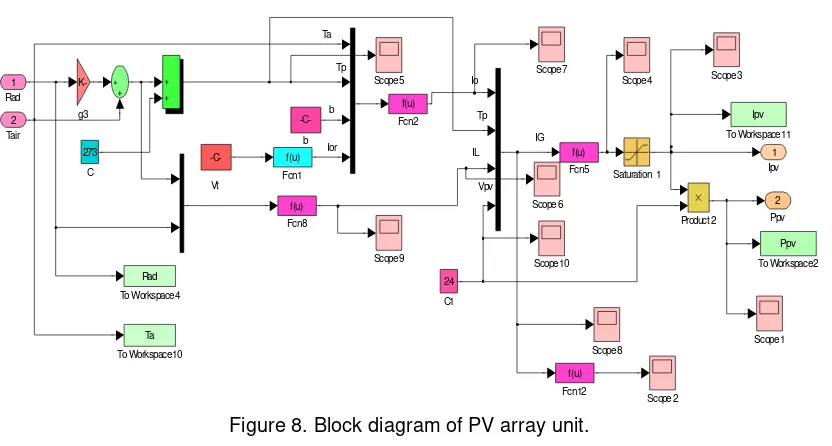
The electrical subsystem consists of several units, PV array and wind generator units as primary sources of energy, battery bank unit as auxiliary source of energy, load unit and control unit. By applying FLC as control technique which is developed to control the power management between different sources and the load, The PV-wind-battery hybrid system SIMULINK block diagram using FLC is given by Figure 7. The PV unit implementation using MATLAB SIMULINK is depicted in Figure 8. The PV unit has two input parameters affected PV generator performance; the solar irradiance and the air temperature while the outputs are PV current (IPV), PV voltage (VPV) and PV power (PPV). The wind turbine unit has the wind speed as
input signal and the wind current (IW) and the power (PW) as output signals.
The battery bank SIMULINK model implementation is illustrated in Figure 9. The battery has the air temperature and the charge current as input variables, and gives the battery voltage during charge (VBC) and discharge (VBD) process, the power (PB), the state of charge (SOC) and
the depth of discharge (DOD).
The control unit implemented by FLC is designed to control the battery current according to the supplement of the load with the required power. FLC has two inputs and one output. The inverter unit is used to convert the DC generated power from renewable energy sources to feed the load with the required AC power.
Figure 7. Electrical sub-system using FLC control.
Figure 9. Block diagram of battery bank.
6. Results
In this section the simulation results of the electrical subsystem are introduced and analyzed. The results are given in a typical day in summer and winter to verify the different environmental condition variation over the year. Each unit has its inputs and outputs, the control results of using FLC techniques are obtained to evaluate the control performance.
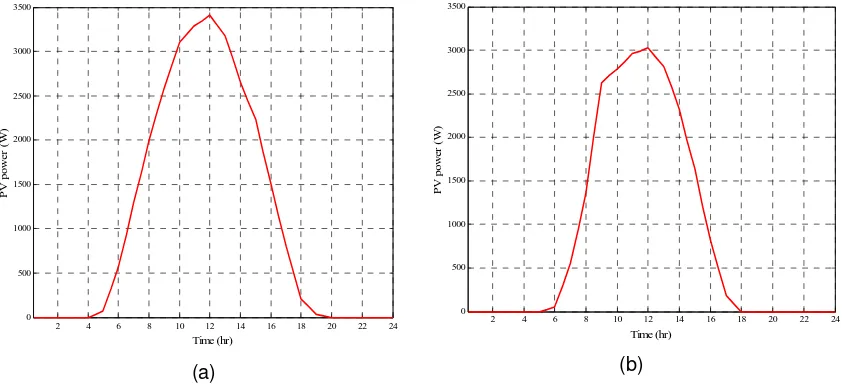
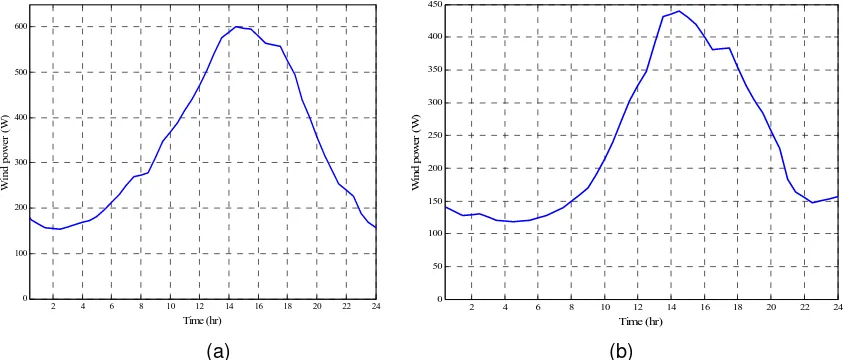
The solar irradiance and air temperature are used as the input parameters for the PV operation. The outputs are the PV current and the PV power. The PV power in summer and winter is presented in Figure 10. The value of PV power in summer is higher than in winter due to high solar irradiance and medium air temperature. The PV power takes the same shape of the solar irradiance due to the direct proportional relationship between them. PV and wind unit have been used to supply the load with the required power. The wind power is cleared in Figure 11. The wind power in winter is higher than in summer which has the inverse operation of PV unit so that the PV and the wind unit have compensated each other to feed the load over the year. The battery has the following operation; it is used to store excess energy during the day hours and to feed load with the required energy when there is no solar irradiance and wind speed. FLC is used to control the battery operation during charge and discharge process. The battery power variation over the day of simulation using FLC is given by Figure 12.
The battery feeds the load during the night hours and begins to charge with increasing the solar irradiance and the wind speed. The battery charges to higher current values in summer rather than in winter due to the high power generation of renewable energy resources in summer season.
(a) (b)
Applying the proposed control technique on the desired application, Figure 13 shows the generated current using FLC with reference load in summer and winter. It is obvious that, the generated current tracked the reference load over the simulation period. The error signal is depicted in Figure 14. The error signal ensures that the two signals (load current and generated current) have the same shape so the error signal has zero amplitude.
(a) (b)
Figure 11. Wind generator power (a) summer (b) winter.
(a) (b)
Figure 12. The battery power over the simulation period using FLC (a) summer (b) winter.
(a) (b)
Figure 13. The generated current over the simulation period using FLC (a) summer (b) winter.
Figure 14. The error signal.
7. Conclusion
The investigated PV-wind hybrid system is designed to be totally self satisfy the load during the operation period. The system is simulated to predict its performance under different environmental condition before implemented in remote area. Design via simulation allows studying different options, considering various influence parameters and effectively fulfils the system/user requirements. Mathematical models of the system components are interconnected to form a general representation of the whole system, through a central supervisory controller that defines the way in which components interact to simulate the operation of the entire system. The power management between PV array, wind generator, battery bank and the load was controlled using FLC. The system performance using FLC had high applicability of FLC technique for this application. The simulation results using MATLAB SIMULINK showed the high performance of the proposed system. The results showed that the PV and wind generator were capable of feeding the load with the required energy and charge the battery with its demands during night hours. FLC has two input signals which are error and change of error. 49 rule bases, the COG and Max-Min method were used.
References
[1] Sayigh A A M. South–south networking and cooperation on renewable energy and sustainable development. Renewable Energy. 2004; 292273(5).
[2] Asif M, Muneer T. Energy supply, its demand and security issues for developed and emerging economies. Renewable and sustain energy Rev. 2007; 11(7):1388–413.
[3] Nfah EM, Ngundam JM, Tchinda R. Modeling of solar/diesel/battery hybrid power systems for far-north Cameroon. Renew Energy. 2007; 32(5): 832–44.
[4] Zoulias EI, Lymberopoulas N. Techno-economic analysis of the integration of hydrogen energy technologies in renewable energy-based stand-along power system. Renewable Energy. 2007; 32(4): 680–96.
[5] Cai YP, Huang GH, Yang ZF, Lin QG, Bass B, Tan Q. Development of an optimization model for energy systems planning in the region of Waterloo. International Journal Energy Res. 2008; 32(11): 988–1005.
[6] Cai YP, Huang GH, Yang ZF, Lin QG, Tan Q. Community-scale renewable energy systems planning under uncertainty-an interval chance-constrained programming approach. Renewable and Sustainable Energy Review. 2009; 13(4):721–35.
[7] Orhan Ekren a, Banu Y. Ekren. Size optimization of a PV/wind hybrid energy conversion system with battery storage using simulated annealing. Applied Energy. 2010; 87:592–598.
[8] Stanislaw H Zak. Systems and control. New York Oxford: OXFORD UNIVERSITY PRESS. 2003. [9] LI Wei, ZHU Xin-jian, CAO Guang-yi. Modeling and control of a small solar fuel cell hybrid energy
system. J Zhejiang Univ Sci 8,734-740, 2007.
[10] M. Deshmukh, S Deshmukh. Modeling of hybrid renewable energy systems. Renewable and Sustainable Energy Reviews. 2008; 12: 235–249,.
[11] O C Onar, M Uzunoglu, M S Alam. Modeling, control and simulation of an autonomous wind turbine/photovoltaic/fuel cell/ultra-capacitor hybrid power system. Journal of Power Sources, 2008; 185: 1273-1283,.
[12] G. Ahmad, H. Hussein, H. El-Ghetany. Theoretical analysis and experimental verification of PV modules. Renewable Energy 28. 2003: 1159–1168.
2 4 6 8 10 12 14 16 18 20 22 24
-5 0 5 10 15 20
Time (hr)
E
rr
o
[13] M. Marwali, S. Shahidehpou, M Daneshdoost. Probabilistic production costing for photovoltaics-utility systems with battery storage. IEEE Transactions on energy conversion. 1997; 12(2).
[14] J Helmut Eckstein. Detailed modeling of photovoltaic system components. Wisconsis Madison. 1990. [15] Hongxing Y, Lu L, Wei Z. A novel optimization sizing model for hybrid solar wind power generation
system Solar Energy. 2007; 81:76–84,.
[16] Yang HX, Burnett J, Lu L. Weather data and probability analysis of hybrid photovoltaic wind power generation systems in Hong Kong. Renewable Energy. 2003; 28:1813–24.
[17] Lu L, Yang HX, Burnett LJ. Investigation on wind power potential on Hong Kong islands-an analysis of wind power and wind turbine characteristics. Renewable Energy. 2002; 27:1–12.
[18] Bogdan SB, Salameh ZM. Methodology for optimally sizing the combination of a battery bank and PV array in a wind/PV hybrid system. IEEE Trans Energy Convers. 1996; 11: 367–75.
[19] Sathyajith Mathew. Wind Energy Fundamentals. Resource Analysis and Economics. Springer-Verlag Berlin Heidelberg. 2006.
[20] H Yang, W Zhou, L Lu, Z Fang . Optimal sizing method for stand-alone hybrid solar–wind system with LPSP technology by using genetic algorithm. Solar Energy. 2008; 82: 354–367, 2008.
[21] F Jahanbani Ardakani, G H Riahy Dehkordi, M Abedi. Optimal sizing of a stand-alone hybrid system for south-west of Iran-case study. 24th International Power System Conference, 2009.
[22] Mahmoud Abdel-Qader. Simulation of a Hybrid Power System Consisting of Wind Turbine, PV, Storage Battery and Diesel Generator with Compensation Network: Design, Optimization and Economical Evaluation. M.sc. thesis An-Najah National University. 2008.
[23] S C Gupta, Y Kumar, G Agnihotri. Optimal sizing of solar-wind hybrid system. lET-UK International Conference on Information and Communication Technology in Electrical Sciences (ICTES 2007). MG R University, India. 2007: 282-287.
[24] France Lasnier, Tony Gan Ang. Photovoltaic Engineering Handbook. Bangkok, Thailand. 1990. [25] Berndt D. Maintenance-free batteries. England: John Wiley & Sons. 1994.
[26] Yoon-Ho K, Hoi Doo H. Design of Interface Circuits with Electrical Battery Models. IEEE Trans on Industrial Electronics. 1997; 44 (1): 81–6.