2015
THE APPLICATION OF ORDINAL LOGISTIC REGRESSION
ON FINANCIAL LITERACY
DIAN ANGGUN KUSUMANINGTYAS
DEPARTMENTOF STATISTICS
FACULTY OF MATHEMATICS AND NATURAL SCIENCE BOGOR AGRICULTURAL UNIVERSITY
PERNYATAAN MENGENAI SKRIPSI DAN
SUMBER INFORMASI SERTA PELIMPAHAN HAK CIPTA*
Dengan ini saya menyatakan bahwa skripsi berjudul Logistic Regression on Financial Literacy at Bogor Agricultural University adalah benar karya saya dengan arahan dari komisi pembimbing dan belum diajukan dalam bentuk apa pun kepada perguruan tinggi mana pun. Sumber informasi yang berasal atau dikutip dari karya yang diterbitkan maupun tidak diterbitkan dari penulis lain telah disebutkan dalam teks dan dicantumkan dalam Daftar Pustaka di bagian akhir skripsi ini.
Dengan ini saya melimpahkan hak cipta dari karya tulis saya kepada Institut Pertanian Bogor.
Bogor, April 2015
Dian Anggun Kusumaningtyas
ABSTRACT
DIAN ANGGUN KUSUMANINGTYAS. The Application of Ordinal Logistic Regression on Financial Literacy. Advised by Asep Saefuddin and Bambang Sumantri.
Students with limited knowledge on financial literacy will obviously face problems in managing their finance. Financial literacy is considered as an ability to take financial decisions in the present and future.It will help people to avoid Hedonic Treadmill as well. Hedonic Treadmill is known asa tendency of consumption more than they needdue to human greed. The research aimsare to provide literacy index of IPB students and identify related factors to the index. Stratified Random Sample was implemented to obtain primary data. The population was divided into two groups,students of Faculty of Economics and Management and students of other faculties. Ordinal Logistic Regression was used to analyze the data which were randomly selected from each group.The result shows that most students have low understanding on financial literacy. The faculty, year of entry to IPB, and parental income have significant effects on the financial literacy (p-value lower than 0.05). Financial literacy and each application are suggested to be included to curriculum since they are important in helping managing students finance in the present and future time.
THE APPLICATION OF ORDINAL LOGISTIC REGRESSION ON FINANCIAL LITERACY
DIAN ANGGUN KUSUMANINGTYAS
Scientific Paper
to complete the requirement for graduation of Bachelor Degree in Statistics
at
Department of Statistics
DEPARTMENT OF STATISTICS
FACULTY OF MATHEMATICS AND NATURAL SCIENCES BOGOR AGRICULTURAL UNIVERSITY
ACKNOWLEDGEMENTS
First of all, I wish to thank God for the blessing and mercies, which made me able to complete this thesis at the proper time. I choose Financial Literacy as my theme with The Application of Ordinal Logistic Regression on Financial Literacy as the tittle of my research.
I would like to express my sincere gratitude to Prof Dr Ir Asep Saefuddin, MSc as my first advisor and Ir Bambang Sumantri as my second advisor. I also would like to express my special gratitude to my lovely parents and all member of my family who have supported me in finishing my study. Thanks to my friends for giving me many criticisms and support in the process of making this research. I hope this writing will be useful for us.
Bogor, April 2015
CONTENTS
Page
ABSTRACT ii
ADVISOR AGREEMENT iii
ACKNOWLEDGEMENT iv
LIST OF TABLE v
LIST OF APPENDIX vi
INTRODUCTION 1
LITERATURE REVIEW 1
Financial Service and Product 1
Financial Literacy Classification 2
Ordinal Logistic Regression 3
DATA AND METHODS 5
Data 5
Methods 5
RESULT AND DISCUSSION 8
Survey Research 8
Financial Literacy Index 10
Ordinal Logistic Regression 11
Financial Decisions 13
CONCLUSION 16
REFERENCES 16
APPENDIX 17
LIST OF TABLE
Page 1. Link function on ordinal logistic regression 4 2. Total of students from year of 2012 and 2013 8
3. Distribution of proportional allocation 8
4. Result of validity test 9
5. Distribution samples 9
6. Financial literacy index in each gender 11
7. Wald statistic values 12
LIST OF FIGURE
Page
1. The diagram research methods 7
2. Description of respondents 10
3. Financial literacy index in each group 10
4. Category of financial literacy index 11
5. Financial decisions of preparation for a secure retirement in 30 years 14 6. Financial decisions for insurance selection for twenties and without 14
Dependents
7. Financial decisions for improve financial health 15 8. Financial decisions for maintain financial records 15
LIST OF APPENDIX
Page
INTRODUCTION
Many students use additional amount of money for consumptive activities, for examples shopping, buy new gadget to be up to date, hangout with friends, and many others. They tend to be trapped in Hedonic Treadmill habit. Hedonic Treadmill is known asa tendency of consumption more than they needdue to human greed(Brickman and Cambell 1971). If they do not have a financial plan for the future, they will lose their money for consumptive activitiesand they do not have money to save for urgent condition. Students with limited knowledge on financial literacy will obviously face problems in managing their finance. Knowledge on financial literacy also helps sudents to avoid Hedonic Treadmill. It is considered as an ability to take financial decisions not only forthe present time, but also for the future time.It includes the ability of understanding financial choices, future plans, effective ways of spending money, and manage the challenges associated with life events such as losing jobs, getting accidents, saving for retirement, or paying for a child’s education (Hendriks 2010). Factors that affect financial literacy are demographic characteristics such as age and gender, educational background, personal finance, experience of managing finance, and parental wealth (Lusardi 2008).
In 2013, Otoritas Jasa Keuangan has set that financial literacy is a strategic program in Indonesia. “Strategi Nasional Literasi Keuangan Indonesia” is the name of financial literacy program in Indonesia. Indonesia is not the first country that have implemented financial literacy as a strategic program. Several countries that have implemented national strategic on financial literacy and their programs are (OJK 2014):
a. UK : Towards a National Strategy for Financial Capability. b. USA :Promoting Financial Success in the United States
(NationalStrategy for Financial Literacy).
c. Australia : National Financial Literacy Strategy. d. New Zealand : National Strategy for Financial Literacy. e. India : National Strategy for Financial Education.
f. Canada : Canadians and Their Money Building a Brighter Financial Future.
This research aimsare to provide literacy index of IPB students and identify related factors to the index. Ordinal Logistic Regression was used to analyze the data because the outcome variable is ordinal’s data type. The respondents of this research are the undergraduate students of IPB fromthe year of 2012 and 2013.
LITERATURE REVIEW
Financial Service and Product
Below are several definition about financial service and product according to Otoritas Jasa Keuangan (OJK) (2015).
Banking
2
of savings and channel them to the public in the form of loans or other forms in order to improve the standard of living of the people.
Insurance
Insurance is an agreement between the insurer and the insured which obliges the insured to pay some amount premium to provide reimbursement for losses, damages, deaths, or losses of expected profit, which may occur on unexpected events.
Financial Institution
Financing is a business entity that conducts financing activities in the form of providing funds or capital goods.
Retirement Income
Retirement income is the legal entity that manages and runs the program that promised pension benefits.
Stock Market
Investments are made in the long term to complete the asset acquisition or purchase of shares and other securities to gain. Investment management is a process to help the formulation of objectives and policies.
Pawnshop
Pawnshop is a company founded with the aims to assist government programs in order to improve the prosperity of the people, especially the lower middle class through lending to micro, small, and medium business on the basis of liens and fiduciary law.
Financial Literacy Classification
In terms of financial literacy, students are classified into four groups: a. Well Literate
Have the knowledge and confidence of the financial services institutions and financial products and services, including features, benefits and risks, rights and responsibility related to financial products and services, and have skills in using financial products and services.
b. Sufficient Literate
Have the knowledge and confidence of the financial services institutions and financial products and services, including features, benefits and risks, rights and responsibility related to financial products and services, but do not have the skills in using financial products and services.
c. Less Literate
Just having knowledge of the financial services institutions, financial products and services, but do not have the confidence of the financial services institutions and do not have skills in using financial products and services. d. Not Literate
3 Ordinal Logistic Regression
Regression methods have become an integral component of any data analysis concerned with describing the relationship between a response variable and one or more explanatory variables. It is often the case that the outcome variable is discrete, taking on two or more possible values. Over the last decade the logistic regression model has become, in many fields, the standard method of analysis in this situation (Hosmer and Lemeshow 2000). Ordinal logistic regression perform logistic regression on an ordinal response variable. Category ordering forms logit of cumulative probabilities for ordinal response Y with j categories and x` = (x1, x2, ... ,xp) as explanatory variables. Probability of the
response variable taking value j can be written as P[Y = j|x] = ��(�). The cumulative probability for each category can be formulated as:
�[� ≤ �|�] = �1(�) + … + ��(�) ��(�) = �
�0+⋯+��
1 + ��0+⋯+��
The formulation can be linearized by logit transformation. The cumulative logit model can be defined as:
��(�) = ����� (�[� ≤ �|�])
� = vector of regression coefficients
Alpha coefficient on an ordinal logistic regression model there were J-1, each category in response variable has a different alpha value. Alpha coefficient value increases with increasing j. Reduction or increase in the number of categories of response variable can change the alpha value but does not change the value of the beta in the model. Parameters(beta) in the model are estimated by maximum likelihood method. According to the method must to be constructed the likelihood function for observation i in n observation that independent each other as follows:
4
Furthermore, to obtain the parameter estimators of ordinal logistic regression is to maximize the likelihood function log to its parameters.
In ordinal logistic regression analysis there are five option of link fuction (see Table 1). Their use depends on the distribution of the data being analyzed. Logit can be implemented on evenly distributed categories. Complementary log can be implemented when higher categories are more probable. Negative log-log can be implemented when lower categories are more probable. Probit can be used on analysis with explicit normally distributed latent variable . Chauchit can be used on outcome with many extreme values (Norusis 2010). Ordinal logistic regression is used of the research use logit on link fuction.
Table 1. Link function on ordinal logistic regression
Link Function Function
Logit ��� � �
1− ��
Complementary log-log Log (-Log(1- �))
Negative log-log -Log(-Log(�))
Probit �−1(�)
Chauchit (inverse Cauchy) Tan(phi(� −0.5))
Statistic G
The statistic G is used for assesing the significance of the explanatory variablessimultaneously. The hypothesis tested is:
�0: �1 = �2 = ⋯= �� = 0
�1 ∶At least there is�� ≠ 0.
The statistic G is calculated from the formula G = -2 ln ��0
���where�0is
value of likelihood without explanatory variable and �� is value of likelihood with explanatory variable. The statistic G follows a Chi-Square distribution with p degree of freedom. �0is rejected when the statistic G greater than��2; � or when p value < α (Hosmer and Lemeshow 2000).
Wald Statistic
The Wald statistic is used to test the significance of each explanatory variable partially. The hypothesis tested is:
�0: �� = 0 (explanatory variable i did not affectthe response variable).
�1: �� ≠0 (explanatory variable i affect the response variable). The statistic used to test the hypothesis is W = ��
���(�). �0 is rejected when |�| >
5 different knowledge about economics and finance. Stratified Random Samplewas implemented to obtain primary data. Population size in the research is 7460 students while the sample size is 380 determined by stratified random sampling method. Then, random sample was selected in each group.
Methods Questionnaire
The questionnaire for this research is according to research of Chen and Volpe RP (1998) and OJK (2014). The questionnaire consisted of three parts. Part A is a general knowledge of personal finance, divided into three sections. Section A.1 is knowledge of the financial services institutions, section A.2 is the features, benefits, and risks of financial services institutions, and use the skills, and section A.3 is a financial services institution. Part B is the opinion of personal finance, financial decision, and financial education. Part C are factors thought to affect financial literacy. Financial literacy is all sections of part A, including sections A.1, A.2, A.3 with a total of 19 questions. The explanatory variables in this study is faculty, year to entry IPB (class), and gender on identity questionnaire. Other explanatory variables is parent’s wealth, side jobs, scholarships, savings and loans in section C, question number 1, 3, 5, 7, and 9. The research questionnaire can be found in Appendix 1.
Stratified Random Sample
Stratified Random Sample in this research is used to obtain primary data. Stratified Random Sample is a method to collect samples from a population of size N sub-populations containing N1, N2, N3, ..., NL (Scheaffer et al. 1990). Between sub-populations no over lapping so that N1 + N2 + N3 + ... + NL = N. Each sub-population referred to as strata or groups. Random samples selected from each group. The sample size of each group is n1, n2, n3, ..., nL. Elements with similar characteristics are classified in the group so that the diversity of each group is relatively homogeneous. Optimal sample size in each group obtained by the following formula:
N : total undergraduate students of IPB from year of 2012 and 2013
�� : total students in group i �� : proportion students in group i �� : 1- ��
�� : the proportion of each group of the total of students
i : 1 (students of Faculty of Economics and Management), 0 (students of other faculty).
D = �2
6
Sample size in each group with proportional allocation is:
�� = � �����
Introduction survey was conducted to test the validity and reliability of the questionnaire. Validity indicates the accuracy of the measuring instrument (questionnaire), which actually states the results of measurements or observations to be measured (Kitcharoen 2004). Testing the validity of the questionnaire is the correlation between the score of question with a total score of questions. Questionnaires are considered valid if the validity is greater than or equal to 0.3 (Anwar 1992).
Reliability is an index that indicates a measurement instrument (questionnaire) trustworthy or reliable (Kitcharoen 2004). Reliability can be defined as the consistency of the questionnaire. Reliability is calculated using Cronbach's Alpha:
Criteria reliability of the questionnaire in the social sectors is if the reliability coefficient greater than or equal to 0.6 (Azwar 1992).
Descriptive Analysis and Ordinal Logistic Regression
Descriptive analysis was conducted to analyze the characteristics of each category. There are 19 questions (part A) and on each question were scored 1 for correct answers and 0 for incorrect answers include choosing "do not know". Score of financial literacy is the total correct answer on the part A. The financial literacy index is the percentage of the total score of each respondent divided by the total score of all questions.
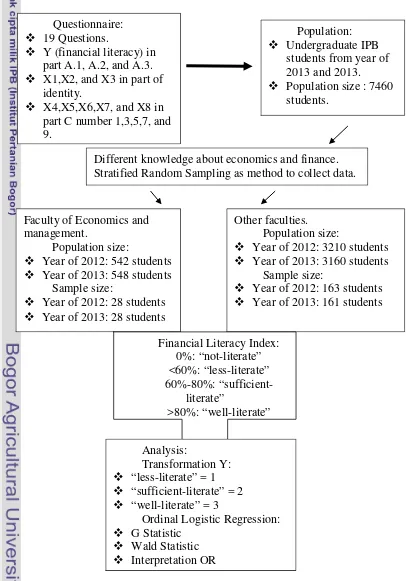
7 Ordinal logistic regression was used to analyze the factors that affect financial literacy of IPB students. The response variable in this study is the financial literacy of IPB students. There are 8 explanatory variables in the study, as follows: gender (X1), faculty (X2), class (X3), wealth of parents (X4), a side job (X5), scholarships (X6), savings (X7), and loans (X8). Ordinal logistic regression analysis done by transforming the student's financial literacy index. Students with financial literacy index in the category of "not-literate" and "less-literate" to 1, in the category "sufficient-"less-literate" becomes 2, and in the category of "well-literate" becomes 3. The Diagram research methods can be seen in Figure 1.
Figure 1. The diagram research methods
Population: Undergraduate IPB
students from year of 2013 and 2013. Population size : 7460
students. Questionnaire:
19 Questions.
Y (financial literacy) in part A.1, A.2, and A.3. X1,X2, and X3 in part of
identity.
X4,X5,X6,X7, and X8 in part C number 1,3,5,7, and 9.
Different knowledge about economics and finance. Stratified Random Sampling as method to collect data.
Other faculties. Population size:
Year of 2012: 3210 students Year of 2013: 3160 students
Sample size:
Year of 2012: 163 students Year of 2013: 161 students Faculty of Economics and
management.
Population size:
Year of 2012: 542 students Year of 2013: 548 students
Sample size: “sufficient-literate” = 2 “well-literate” = 3
Ordinal Logistic Regression: G Statistic
8
RESULT AND DISCUSSION
Survey Research
The population was IPB students from year of 2012 and 2013 with the population size was 7460 students. Distribution of students can be seen in Table 2.
Table 2 Total of students year of 2012 and 2013
Respondent Year of 2012 Year of 2013 Total
Faculty of Economics 542 548 1090
Other faculties 3210 3160 6370
Total 3752 3708 7460
The population is divided into two groups: students of the Faculty of Economics and Management and of other faculties, because they have different knowledge about economics and finance. Random samples selected by stratified random sampling method described in the previous chapter. Distribution of proportional allocation of each group can be seen in Table 3.
Table 3 Distribution of proportional allocation
Respondent Sample size Sample size in each class Faculty of Economics
and Management 56 2012 28
2013 28
Other faculties 324 2012 163
2013 161
Introduction survey conducted before the survey research with the same population. The sample size that is used by 10% of the optimum sample size with proportional distribution in each group. Introduction survey conducted to determine the validity and reliability of the questionnaire. Each question is declared valid if the correlation of these questions with a total score of more than r product moment. The value of r-product moment for the sample size of 40 was 0.312 at the 5% significance. On the validity of the test results are valid for 16 questions and three questions are not valid. Although there are three questions that are not valid, but the question is still used in research survey because its validity score is not too far from r-product moment. In addition they also include an important question. Meanwhile the reliability value is 0.6671. This indicates the reliability and consistency of the questionnaire. Validity score on each question can be seen in Table 4.
Table 4 Result of validity test
Number of question Validity score Information
1 0,5633 Valid
2 0,2694 Not Valid
3 0,4091 Valid
9
Distribution of samples on survey research only in some departments because of technical constraints and assumptions that department in each group have the same variance. Department selected in each group randomly. One department is selected from the Faculty of Economics and Management in each class. On the other faculties have been four departments in 2012 and three departments in 2013. All students in the selected departments as respondents in the study. Selected data is students who answered all the questions. The data is selected for analysis are required randomly. The selected department name can be seen in Table 5.
Table 5 Distribution samples
Faculty Department
Economics and Management year of 2012 Economics and Management
year of 2013
10
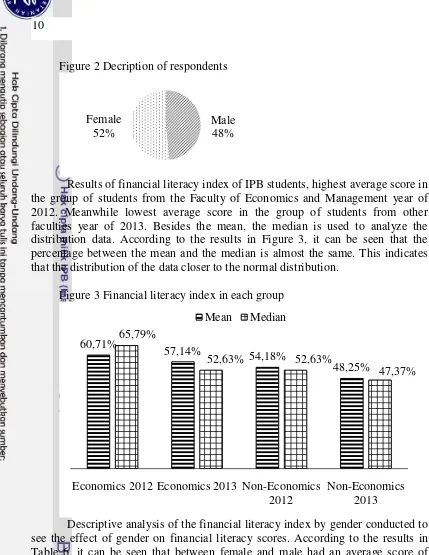
Figure 2 Decription of respondents
Results of financial literacy index of IPB students, highest average score in the group of students from the Faculty of Economics and Management year of 2012. Meanwhile lowest average score in the group of students from other faculties year of 2013. Besides the mean, the median is used to analyze the distribution data. According to the results in Figure 3, it can be seen that the percentage between the mean and the median is almost the same. This indicates that the distribution of the data closer to the normal distribution.
Figure 3 Financial literacy index in each group
Descriptive analysis of the financial literacy index by gender conducted to see the effect of gender on financial literacy scores. According to the results in Table 6, it can be seen that between female and male had an average score of financial literacy are almost the same.
Table 6 Financial literacy index in each gender
Gender Financial Literacy Index
Female 52.32%
Male 52.42%
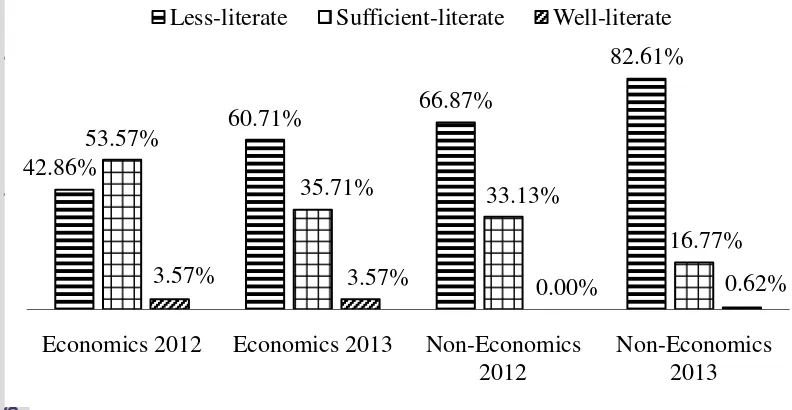
Furthermore, descriptive analysis performed on the each category. According to the survey results can be seen in Figure 4, 63.26% of IPB students be in the "less-literate". In the group of "sufficient-literate" students are 34.80% and 1.94% only IPB students who are in the group of "well-literate". Only
Male 48% Female
52%
60,71%
57,14% 54,18%
48,25% 65,79%
52,63% 52,63%
47,37%
Economics 2012 Economics 2013 Non-Economics 2012
11 students from the Faculty of Economics and Management class of 2012, most of the students are in the category of "sufficient-literate". Meanwhile students at most other groups in the category of "less-literate". The average score of IPB students financial literacy as a whole is 52.37% that belongs to the group of "less-literate". This indicates that the average student can only be answered right half of the total questions, so that the necessary education on financial literacy in students of IPB.
Figure 4Category of financial literacy index
Ordinal Logistic Regression
Ordinal logistic regression was used to analyze the factors that affect the financial literacy of IPB students. The probability of response variables j in x explanatory variables can be written as P[Y = j|x] = ��(�). The response variable in this study is the financial literacy of IPB students. There are 8 explanatory variables in the study, such as: gender (X1), faculty (X2), class (X3), wealth of parents (X4), a side job (X5), scholarships (X6), savings (X7), and loans (X8). Analysis were performed by transforming the financial literacy index. Financial literacy index in the category of "not-literate" and "less-literate" become 1, in the category "sufficient-literate" becomes 2, and in the category of "well-literate" becomes 3.
According to the results of ordinal logistic regression analysis with 8 independent variable, the value of the G statistic is 29.6426 with a p-value is 0.0002. P-value not more than 5% so that H0 is rejected or another statement at
least one predictor variables that affect financial literacy (Y). Predictor variables that affect financial literacy is variable with the Wald statistic more than Z0.025 =
1.96 or p-value (Pr> ChiSq) lower than 0.05. According to the result, the predictor variables that affect financial literacy is the faculty, class, and wealth of parents. Wald statistic values can be seen in Table 7.
42.86%
60.71% 66.87%
82.61%
53.57%
35.71% 33.13%
16.77%
3.57% 3.57% 0.00% 0.62%
Economics 2012 Economics 2013 Non-Economics 2012
12
Tabel 7 Wald statistic values
Dependent Variable Chi-Square Pr > ChiSq
Gender 0.0155 0.9009
Faculty 13.8143 0.0002
Class 10.3151 0.0013
Wealth of Parents 3.8156 0.0508
Side Job 0.7999 0.3711
Schoolarship 0.3932 0.5306
Saving 0.1917 0.6615
Loan 0.3253 0.5684
The result of logistic regression model is:
��(�) = �� - 0.0152X1+ 0.5778X2+ 0.3906X3– 0.2921X4– 0.1409X5– 0.0799X6+
0.0838X7+ 0.0760X8
Where:
��(�) : estimate the probability of financial literacy X1 : gender
Value odds ratio (OR) was used to interpret the model coefficients. Interpretation is not only for the independent variables that affect the response variable, but also for the independent variable has no affect. This is because the purpose of this study was to analyze the relationship between the explanatory variables and the response. Although there is not a predictor variables affect the response variables (p-value <0.05), the predictor variables have a relationship with the response variable because the value of Wald statistic is not zero. The first interpretation for gender with OR value is 0.9849 and p-value is 0.9009. This means there is not enough evidence to explain that there is no difference between females and males on financial literacy of students in the study of IPB, at the 95 percent level of confidence. In terms of demographic characteristics, males have been found to outperform females, although the gender difference seems to be unstable over time, females outperform males in the Jump $tart survey of the latest (Lusardi, 2008).
13 evidence to explain that students have above average scores on financial literacy is 1.4779 times more likely to occur among students in 2012 than 2013 in the study of IPB students, at the 95 percent level of confidence. The fourth interpretation of the wealth of parents with OR is 0.7467 and p-value is 0.0508. This means there is enough evidence to explain that students have above average scores on financial literacy is 0.7467 times more likely to occur between students with parental income of more than 5 million dollars from students with parental income of less than 5 million dollars in study of IPB students, at the 95 percent level of confidence. Financial literacy is positively associated with parental income (Lusardi, 2008). Results of the study can be differents each other because of differences in characteristics.
The fifth interpretation for a side job with a value of OR is 0.8686 and p-value is 0.3711. This means there is not enough evidence to explain that students have above average on financial literacy of 0.8686 times more likely to occur among students have the experience of getting extra money with part-time students do not have experience in study of IPB students, at the 95 percent confidence level. The sixth interpretation for scholarships with a value of OR is 0.9232 and p-value is 0.5306. This means there is not enough evidence to explain that there is no difference between students who get scholarships and did not get a scholarship on financial literacy of students in the study of IPB, at the 95 percent level of confidence. Interpretation of the seventh for savings with a value of OR is 1.0874 and p-value is 0.6615. This means there is not enough evidence to explain that there is no difference between the students who have savings and have no savings on financial literacy of students in the study of IPB, at the 95 percent level of confidence. Final interpretation for loans with a value of OR is 1.0790 and p-value is 0.5684. This means there is not enough evidence to explain that there is no difference between students who have debt and no debt on financial literacy of students in the study of IPB, at the 95 percent level of confidence. Students experience in managing their own finances is an important factor related to financial literacy (Lusardi, 2008).
Financial Decisions
Financial decision is used to analyze the decision of students in each category, the decision is not only for the present but also for the future time. Financial decisions are divided into 4 sections. The first section is about financial preparation for retirement in 30 years. The second section is about insurance selection for twenties and without dependents. The third section is about improve financial health. The last section is about maintain financial records.
14
Figure 5 Financial decisions of preparation for a secure retirement in 30 years
The second part is about insurance selection for twenties and without dependents. Results for the category of "less-literate" and "sufficient-literate" top choice in the buying long-term life insurance policy and the lowest choice in the buy flight insurance each time travel by air. On the other hand, the category of "well-literate" spread uniformly in every decision, unless the decision to buy flight insurance each time travel by air (see Figure 6).
Figure 6. Financial Decisions for insurance selection for twenties and without dependents
The third part is about improve financial health. Results for all category, top choice in the cut expenses and use savings to pay down debt (see Figure 7). Meanwhile, only a few students who choose to apply for a consumer loan for a new car and borrow of money to the family to pay off debt to improve their financial health.
Figure 7. Financial Decisions for improve financial health 31,29% Start to build up savings account in bank
Save money in certificate of deposit account Invest in mutual fund
Invest in long-term Treasury bond
59,17% 61,11% Buy long-term life insurance policy
15
The last part is about maintain financial records. Results for each category is students never maintain financial redords. The result of maintain financial records on financial decisions can be seen in Figure 8.
Figure 8. Financial Decisions for maintain financial records
The result on financial decisions do not give different characteristics in each category. This indicates that financial decisions are not only determined by the student’s financial knowledge, but there are other factors that influence, such as psychology and emotion (Nababan 2012).
61,25% 63,96% 66,67%
29,07% 32,43%
0,00%
5,19% 1,80%
33,33%
4,50% 1,80%
0,00% Less-literate Sufficient-literate Well-literate
Cut expenses and use savings to pay down debt Keep the same spending pattern as in the past Apply for a consumer loan for a new car Borrow of money to the family to pay off debt
16,48% 20,75%
0,00%
32,60% 33,96%
0,00%
50,92% 45,28%
100,00%
16
CONCLUSION
The results presented in this research have a number of important implications for policy makers and education providers. Most of students have low understanding on financial literacy. Educational background of economics and finance, demographic characterictic, and parental income have significant effect on financial literacy (p-value < 0.05). Financial decisions are not only determined by the student’s financial knowledge, but there are other factors that influence, such as psychology and emotion. Financial literacy is described as an education priority. It improvement is warranted, and there is a strong case for it to be rolled out as part of the compulsory curriculum in college students. The curriculum not only about knowledge financial literacy but also about applications (financial decisions). Suggestion for further research, selected samples for each department so that a more representative sample.
REFERENCES
Agresti, A. 2002. Categorical Data Analysis. New York: John Wiley and Sons.
Azwar, S. 1992. Reabillitas dan Validitas. Yogyakarta: Pustaka Pelajar. Brickman, P and Campbell D. 1971. Hedonic Relativism And Planning The Good
Society. In M. H. Apley (Ed.), Adaptation-level theory: A symposium (pp. 287–302). New York: Academic Press.
Chen, H and Volpe R P. 1998. An analysis of personal financial literacy among college students. Financial Service Review. 7(2):107-128.
Hendriks, T P. 2010. National Financial Literacy. New York: Nova Science Publishers, Inc.
Hosmer, D and Lemeshow. 2000. Applied Logistic Regression. USA: John Wiley and Sons.
Kitchaoren, K. 2004. The importance-performance analysis of service quality in administrative departements of private universities in thailand. ABAC Journal, vol. 24, no.3, p 20-46.
Lusardi, A.2008. Household saving behaviour: the role of financial literacy, information, and financial education programs. NBER Working Paper 13824. Cambridge: National Bureauof Economic Research.
Nababan, D. 2012. Analisis personal financial literacy dan financial behavior [skripsi]. Medan (ID): Universitas Sumatera Utara.
Norusis, MJ. 2010. SPSS Statistics Guides: Ordinal Regression. [Internet].
[download 2015 April 28]. Available on:http//norusis.com/pdf/ASPC_v13.pdf.
[OJK] Otoritas Jasa Keuangan. 2014. Strategi Nasional Literasi Keuangan Indonesia. Jakarta: OJK.
[OJK] Otoritas Jasa Keuangan. 2015. Regulasi Produk dan Jasa Keuangan. OJK [Internet]. [download 2015 January 11]. Available on: http//ojk.go.id/regulasi.
17 APPENDIX
Appendix 1 The research questionnaire
DEPARTEMEN STATISTIKA FAKULTAS MATEMATIKA DAN ILMU
PENGETAHUAN ALAM
INSTITUT PERTANIAN BOGOR
Jl. Meranti Kampus IPB Dramaga Bogor. 16680. Telp/Fax : (0251) 8625481-8625708
Saya, Dian Anggun Kusumaningtyas mahasiswa Statistika IPB Semester 8, sedang melakukan penelitian skripsi yang berjudul Logistic Regression on Financial Literacy at Bogor Agricultural University. Terima kasih telah bersedia menjadi responden survei saya. Survei ini dilakukan untuk mengetahui gambaran dan faktor-faktor yang mempengaruhi literasi keuangan (financial literacy) pada mahasiswa S-1 angkatan 2012 dan 2013 di Institut Pertanian Bogor.
Atas bantuan, kesedian waktu, dan kerjasamanya saya ucapkan terima kasih.
Nama :
Fakultas/Departemen :
Angkatan :
Jenis Kelamin :
A. Pengetahuan umum personal finance A.1. Pengetahuan lembaga jasa keuangan Petunjuk pengisian :
Lingkari jawaban yang sesuai dengan pilihan Anda
1. Badan usaha yang menghimpun dana dari masyarakat dalam bentuk simpanan dan menyalurkannya kepada masyarakat dalam bentuk kredit dan atau bentuk-bentuk lainnya dalam rangka meningkatkan taraf hidup rakyat banyak adalah ...
a.) Pegadaian
b.) Lembaga Pembiayaan c.) Bank
d.) Tidak Tahu
2. Perjanjian antara penanggung dan tertanggung yang mewajibkan tertanggung membayar sejumlah premi untuk memberikan penggantian atas risiko kerugian, kerusakan, kematian, atau kehilangan keuntungan yang diharapkan, yang mungkin terjadi atas peristiwa yang tak terduga adalah ...
a.) Investasi b.) Asuransi c.) Dana Pensiun d.) Tidak Tahu
3. Badan usaha yang melakukan kegiatan pembiayaan dalam bentuk penyediaan dana atau barang modal adalah ...
18
a.) Pasar Modal b.) Investasi
c.) Lembaga Pembiayaan d.) Tidak Tahu
4. Alternatif pilihan untuk menyelesaikan masalah karyawan yang timbul seiring risiko di dalam dunia pekerjaan, seperti usia yang sudah tidak produktif (lanjut usia), kecelakaan yang mengakibatkan kecacatan fisik atau bahkan meninggal dunia adalah ...
a.) Dana Pensiun b.) Asuransi c.) Investasi d.) Tidak Tahu
5. Pasar untuk berbagai instrumen keuangan jangka panjang yang bisa diperjual-belikan, baik dalam bentuk hutang maupun modal sendiri, baik yang diterbitkan oleh pemerintah, public authorities, maupun perusahaan swasta adalah ...
a.) Investasi b.) Pasar Modal
c.) Lembaga Pembiayaan d.) Tidak Tahu
6. Perusahaan yang didirikan atas dasar hukum gadai dan fidusia dengan maksud untuk membantu program pemerintah dalam rangka meningkatkan kesejahteraan rakyat, khususnya golongan menengah ke bawah melalui penyaluran pinjaman kepada usaha skala mikro, kecil, dan menengah adalah ...
a.) Lembaga Pembiayaan b.) Pegadaian
c.) Investasi d.) Tidak Tahu
A.2 Fitur, Manfaat, dan Risiko Lembaga Jasa Keuangan Petunjuk pengisian :
Beri tanda centang pada jawaban yang Anda pilih
No. Pernyataan Benar Salah Tidak
Tahu 1. Uang dalam rekening giro dapat dicairkan setiap
hari
2. Anda harus mengasuransikan hal yang memberikan dampak kerugian tinggi walaupun jarang terjadi
3. Pegadaian merupakan lembaga keuangan yang paling cocok untuk membantu penyediaan dana usaha dalam jumlah besar
19 5. Kekayaan dana pensiun pemberi kerja dapat
digolongkan sebagai investasi
6. Anda akan mempertahankan limit kredit apabila dapat membayar tunai semua barang dan jasa
7. Lembaga pembiayaan dapat membantu penyediaan dana pada proyek infrastruksur
A.3 Keterampilan Penggunaan Lembaga Jasa Keuangan Petunjuk pengisian :
Lingkari jawaban yang sesuai dengan pilihan Anda
1. Jika Anda menandatangani kontrak pinjaman di bank untuk seorang teman, maka ...
a.) Anda menjadi bertanggungjawab atas pembayaran pinjaman jika teman Anda lalai
b.) Teman Anda bisa mengambil pinjamannya sendiri c.) Anda berhak untuk menerima bagian dari pinjaman d.) Tidak Tahu
2. Berikut ini tidak akan ditanggung oleh pihak asuransi terhadap rumah Anda apabila terjadi ...
a.) Perang b.) Banjir
c.) Anda digugat oleh seseorang tetapi hanya kebohongan d.) Tidak Tahu
3. Risiko tinggi dan pengembalian tinggi merupakan strategi investasi yang paling cocok untuk ...
a.) Pasangan pensiunan tua yang hidup dengan pendapatan tetap
b.) Pasangan setengah baya yang membutuhkan dana untuk pendidikan anak-anak mereka dalam dua tahun
c.) Pasangan yang menikah muda tanpa anak d.) Tidak Tahu
4. Alasan lebih memilih pegadaian dari pada lembaga jasa keuangan lain adalah ... a.) Dapat meminjam dana dalam jumlah besar
b.) Barang jaminan bernilai tinggi
c.) Suku bunga rendah dan sesuai dengan kesepakatan d.) Tidak Tahu
5. Jenis investasi yang cocok untuk orang yang bermodal sedikit dan resiko rendah adalah ...
a.) Reksa dana pasar uang b.) Saham
c.) Obligasi d.) Tidak Tahu
6. Jika suku bunga naik maka harga obligasi akan ... a.) Naik
20
B.Pengambilan Keputusan Petunjuk pengisian :
Lingkari jawaban yang sesuai dengan pilihan Anda (jawaban boleh lebih dari satu)
1. Jika Anda berusia dua puluhan awal dan Anda ingin meningkatkan investasi yang aman untuk masa pensiun 30 tahun yang akan datang, maka apa yang akan Anda rencanakan?
a.) Menyimpan dalam bentuk tabungan di bank umum b.) Menyimpan uang dalam betuk deposito
c.) Berinvestasi dalam reksadana
d.) Berinvestasi dalam obligasi jangka panjang
2. Jika Anda berusia dua puluhan dan tanpa tanggungan, asuransi mana yang akan Anda pilih?
a.) Membeli asuransi jiwa jangka panjang b.) Tidak perlu membeli setiap asuransi jiwa
c.) Membeli asuransi penerbangan setiap kali bepergian dengan pesawat d.) Membeli asuransi nilai tunai
3. Jika Anda baru saja lulus dari perguruan tinggi dan mendapat pekerjaan dengan gaji 36 juta rupiah per tahun, tetapi Anda harus membayar hutang pinjaman sebesar 650 ribu rupiah per bulan selama lima tahun. Apa yang harus Anda lakukan untuk meningkatkan keadaan keuangan Anda?
a.) Memotong biaya dan penggunaan tabungan Anda untuk membayar hutang b.) Menjaga pola belanja sama seperti dulu
c.) Mengajukan pinjaman untuk membeli mobil baru d.) Meminjam kepada keluarga untuk melunasi hutang 4. Apakah yang Anda memiliki catatan keuangan?
a.) Memiliki semua catatan pemasukan dan pengeluaran dengan rinci b.) Mencatat pengeluaran dasar
c.) Tidak mencatat pengeluaran yang dilakukan C.Karakteristik Responden
Petunjuk pengisian :
Lingkari jawaban yang sesuai dengan keadaan Anda
1. Berapa pendapatan orang tua Anda perbulan? 1. < 1 juta 2. 1-5 juta 3. 5-10 juta
4. 10-25 juta 5. >25 juta
2. Berapa kiriman Anda per bulan dari orang tua? 1. < 500 ribu 2. 500 ribu- 1 juta 3. 1-2 juta
4. 2-5 juta 5. >5 juta 3. Apakah Anda memiliki pekerjaan sambilan?
1. Ya 2. Tidak
Jika ya, lanjut ke nomor 4. Jika tidak lanjut ke nomor 5. 4. Berapa pendapatan pribadi Anda per bulan?
21 4. 2-5 juta 5. >5 juta
5. Apakah Anda mendapatkan beasiswa? 1. Ya 2. Tidak
6. Berapa besar pengeluaran Anda per bulan?
1. < 500 ribu 2. 500 ribu- 1 juta 3. 1-2 juta 4. 2-5 juta 5. >5 juta
7. Apakah Anda memiliki akun tabungan ? 1. Ya 2. Tidak
Jika ya, lanjut ke nomor 8. Jika tidak lanjut ke nomor 9. 8. Berapa besar tabungan Anda?
1. < 500 ribu 2. 500 ribu- 1 juta 3. 1-2 juta 4. 2-5 juta 5. >5 juta
9. Apakah Anda memiliki hutang dalam sebulan terakhir? 1. Ya 2. Tidak
Jika ya, lanjut ke nomor 10. 10. Berapa jumlah hutang Anda?
1. < 500 ribu 2. 500 ribu- 1 juta 3. 1-2 juta 4. 2-5 juta 5. >5 juta
Tambahan:
1. Apakah Anda dapat memahami kalimat yang ditanyakan?
Jika tidak bagian kalimat mana yang tidak dapat Anda pahami? 2. Apakah Anda dapat memahami isi dari pertanyaan?
Jika tidak bagian mana yang tidak dapat Anda pahami?
Referensi:
22
BIOGRAPHY
Dian Anggun Kusumaningtyas was born in Pekalongan as daughter of Moh. Guntur and Sri Haryanti on March 27 1994. She was graduated from SDN Gumawang 01, SMPN 02 Pekalongan, and SMAN 1 Surakarta before continuing study to IPB in 2011.