HEAT SEALING PROPERTIES OF FISH GELATIN FILM
INDAH KURNIASARI
DEPARTMENT OF FOOD SCIENCE AND TECHNOLOGY
FACULTY OF AGRICULTURAL ENGINEERING AND TECHNOLOGY BOGOR AGRICULTURAL UNIVERSITY
STATEMENT LETTER OF MANUSCRIPT AND SOURCES OF
INFORMATION*
Hereby i genuinely stated that the manuscript entitled Heat Sealing Properties of Fish Gelatin Film is an authentic work of mine under supervision of academic conselor and never being presented in any forms and universities. All information taken and quoted from published or unpublished works of the writters has been mentioned in texts and attached in the bibliography at the end of this manuscript.
Hereby i bestow the copyright of my manuscript to Bogor Agricultural University and Kasetsart University.
Bogor, Desember 2014
Indah Kurniasari
ABSTRACT
INDAH KURNIASARI. Heat Sealing Properties of Fish Gelatin Film. Supervised by DR. ELVIRA SYAMSIR and DR. KANOKRAT LIMPISOPHON.
All fish gelatins have been observed to exhibit good film forming properties, yielding transparent, nearly colourless, water soluble, and highly extensible films. The objectives of this research are to analyze heat sealing property of gelatin film at different temperature and time. The film prepared from fish gelatin and use glycerol as plasticizer. Protein of gelatin determined in the beginning for preparation of gelatin film. In preliminary experiment used five level of glycerol (15% glycerol, 20% glycerol, 25% glycerol, 30% glycerol, and 35% glycerol) to determine one level of glycerol which will use for futher study of sealing property. The result showed that 25% of glycerol determined will used for sealing study. Result determined based on properties of the film which is color, mechanical properties, and moisture content. In the next experiment, the film will be sealed in different combination temperature (100 0C, 110 0C, and 120 0C) and time (1 s, 2 s, and 3 s). Then it will be analyzed the color, transparency, opacity and seal strength. Result showed that there was no significant different in color, transparency and opacity when it sealed. But the film have transparent appearance and excellent barrier properties against UV light like before it sealed. Temperature and time have effect on seal strength of the film (p<0.05). The higher temperature or time cause the seal strength increase. But combination time and temperature didn’t affect significantly on seal strength (p>0.05). Highest seal strength was observed at temperature 110 0C and time 3 s for 25% glycerol concentration of the film.
Manuscipt
submitted as a partial fulfillment of the requirement for degreee of Sarjana Teknologi Pertanian
at the Departement of Food Science and Technology
HEAT SEALING PROPERTIES OF FISH GELATIN FILM
INDAH KURNIASARI
DEPARTMENT OF FOOD SCIENCE AND TECHNOLOGY
FACULTY OF AGRICULTURAL ENGINEERING AND TECHNOLOGY BOGOR AGRICULTURAL UNIVERSITY
PREFACE
Praise to Allah for the the mercy, the graciousness, and the guidance throughout the research and manuscript completion. The research entitled “Heat Sealing Properties of Fish Gelatin Film” was carried out in Kasetsart University from May to September 2014.
By completion of this research and manuscript, the author would like to express great appreciation and sincere thanks to:
1. Beloved Mama, Papa, Dedek Ratna and Adek Yesa for their endless love, care, and support.
2. Dr. Elvira Syamsir, STP, M. Si, as academic advisor, for her enormous help academically throughtout the completion of my manuscript.
3. Dr. Kanokrat Limpisophon for her valuable and inspiring advices, support, loves, and also her time providing me as advisee at Kasetsart University. 4. Dr. Ir. Sukarno, M. Sc and Dian Herawati, STP, M. Si, as examiners, for their
time, correction, input and helps.
5. Ditjen DIKTI for financial support during research and all comitte of AIMS Exchange Program both in IPB (Bapak Eko, Ibu Dias, Ibu Antung, Bapak Pungki, Mbak Tika) and KU (Lecture of Food Technology, Dr. Sasitorn Tongchitpakdee and other staff of international Division Affairs) for chance doing research in KU and chance knowing another part of the world.
6. Bapak Lutfi Rauf as ambassador of Indonesia for Thailand and Bapak Yunardi Yusuf as attache Educational and Culture for their kindness and help.
7. All member of Lipid and Protein Laboratory (Phii Pat, Phii Joice, Phii Booky, Phii Kai, Phii Tan, Phii Dear, Phii Tong, Phii Nan, Phii Milk, Titu, Phii Oeuang, Phii Dao, Phii Koi, and Phii Ob) for their guidance, kindness, happiness, crazyness, and wonderful memories during stay in Thailand.
8. All of staff laboratory (Phii Pong, Phii Ant, Phii Tae, Phii Jum, Phii Neng) also all of staff in Department of Food Science and Technology (Mbak Ina, Mbak Anie, Mbak May, Ibu Novi, etc) for their time to help.
9. Al-Banatters and friends for love, care, support and beautiful friendship during survive studying in foodtech.
10. AIMS Student Thailand 2014 (Dyah, Lingga, Gunawan, Elvan) and Indonesia students (Mbak Ida, Mbak Dwita, Mas Iwan, Mbak Yuntia, Mbak Hesti, Mas Wildan, Mbak Asya, Mbak Sari, Kak Alfa, Bu Erni, Mbak Indy, Mas Aidil) for wonderful memories and adventure during in Thailand.
11. P2 team for the greatest colaboration during laboratory class and all of
foodtech ’47 student (‘DOA IBU’) for being together in good and bad time Last but not least, hopefully this manuscript is useful for the readers and gives a real contribution in food science development.
Bogor, December 2014
TABLE OF CONTENT
LIST OF TABLE x
LIST OF FIGURE x
LIST OF APPENDIX x
INTRODUCTION 1
Background 1
Objective 3
RESEARCH METHODOLOGY 3
Materials 3
Instruments 3
Method 3
Method of Analysis 4
RESULT AND DISCUSSION 6
Protein content of fish gelatin 6
Effect of glycerol concentration on properties of the film 6 Effect of sealing time and temperature on properties of film 10
CONCLUSION AND RECOMMENDATION 14
Conclusion 14
Recommendation 14
REFERENCES 15
APPENDIX 17
LIST OF TABLE
1. Effect of glycerol concentration on color of 5% protein fish gelatin film 6 2. Effect of glycerol concentration on thickness, tensile strength and
elongation at break 9
3. Effect of glycerol concentration on moisture content of 5% protein fish
gelatin film 10
4. Effect of sealing temperature and time on color of 25% glycerol
concentration of the film 11
5. Effect of sealing temperature and time on seal strength of 25% glycerol
concentration of the film 14
LIST OF FIGURE
1. Thickness of 5% protein fish gelatin film in various level of glycerol 8 2. Tensile strength of 5% protein fish gelatin film in various level of
5. Fish gelatin film in various level of glycerol 10
6. Effect of sealing temperature and time before and after sealed on transparency of 25% glycerol concentration of the film 12 7. Effect of sealing temperature and time before and after sealed on opacity
of 25% glycerol concentration of the film 13
LIST OF APPENDIX
1 . Protein standard curve for fish gelatin 17
2 . Protein concentration of fish gelatin 17
3 . Nutritional information of fish gelatin 17
4 . Statistical analysis of color 17
5 . Statistical analysis of thickness 18
6 . Statistical analysis of tensile strength 18
7 . Statistical analysis of elongation at break 19
8 . Statistical analysis of moisture content 20
9 . Statistical analysis of color on sealed film 20
10. Light transmission before sealed of 25% glycerol concentration of the
film 22
11. Light transmission after sealed of 25% glycerol concentration of the film 22 12. Effect of sealing temperature and time before sealed on transparency and
opacity of 25% glycerol concentration of the film 23 13. Effect of sealing temperature and time before sealed on transparency and
opacity of 25% glycerol concentration of the film 23
INTRODUCTION
Background
Gelatin is a protein with a broad range of functional properties and applications, including film-forming ability, and is obtained by hydrolyzing collagen of animal and fish skin. The properties and film-forming ability of gelatins are directly related to the molecular weight, i.e., the higher the average molecular weight, the better the quality of the gelatin. The molecular weight distribution depends mainly on the degree of collagen cross-linking and the extraction procedure. However, the physical properties of gelatins are related not only to the molecular weight distribution but also to the amino acid composition (Gómez-Estaca et al., 2009). It has comprising multifunctionalities like gelling, thickening, water-binding, emulsifying stabilizing, foaming, film forming and fining characteristics. It is also suitable for production of biodegradable packaging materials, with the appropriate film forming properties and good barriers against oxygen and aromas at low and intermediate relative humidity (Hosseini et al.,
2013). It forms thermo reversible gels through the formation of hydrogen bond stabilized triple helices when its solution is cooled. Again on heating it melts above 40°C. Hydrogen bond stabilization is followed by rearrangement of individual molecular chains into ordered, helical arrangement, or collagen fold and association of two or three ordered segments to create crystallites (Zaman et al., 2012).
Fish skin, which is a major by product of the fish-processing industry, causing waste and pollution, could provide a valuable source of gelatin. Gelatin films from the skins of a warm-water fish species, such as the Nile perch, have been reported to exhibit stress and elongation at break similar to that of bovine bone gelatin. Fish gelatin film, however, exhibits lower water vapor permeability than bovine gelatin. The lower WVP values (compared to those from bovine or porcine) reported for films based on fish gelatins from several species, can be explained interms of the amino acid composition. Fish gelatins are known to have much higher hydrophobicity due to lower proline and hydroxyproline contents, as the hydroxyl group of hydroxyprolineis normally available to form hydrogen bonds with water (Karim and Bhat, 2009). All fish gelatins have been observed to exhibit good film forming properties, yielding transparent, nearly colourless, water soluble, and highly extensible films. The physical properties of fish-gelatin films are highly dependent on gelatin attributes, which are in turn dependent not only on intrinsic properties related to the fish species used but also on the process employed to manufacture the gelatin. The mechanical and barrier properties of these films depend largely on the physical and chemical characteristics of the gelatin, especially the amino acid composition, which is highly species specific, and the molecular weight distribution, which depends mainly on processing conditions (Gómez-Guillén et al., 2009).
2
edible films offer alternative packaging without adversely affecting the environmental costs. However, edible films are not meant to totally replace synthetic packaging or to limit moisture, aroma and lipid migration between food components where traditional packaging cannot function. For instance, protein-based edible films can be used for versatile food products to reduce loss of moisture, to restrict absorption of oxygen, to lessen migration of lipids, to improve mechanical handling properties, to provide physical protection, or to offer an alternative to commercial packaging materials. It has impressive gas barrier properties compared with those prepared from lipids and polysaccharides. When they are not moist, the O2 permeability of soy protein-based film was 500, 260, 540 and 670 times lower than that of low-density polyethylene, methylcellulose, starch and pectin respectively. In addition, the mechanical properties of protein-based edible films are also better than those of polysaccharide and fat-based films. This is because proteins have a unique structure which confers a wider range of functional properties, especially a high intermolecular binding potential (Wittaya, 2012).
Protein films would be a suitable food packaging material for preventing the growth of aerobic microbial and lipid oxidation in lipid enriched foods because it shows impressive gas barriers. It may be able to partially replace some of the conventional synthetic packaging materials used to preserve and protect foods. These protein-based edible films should not be used alone, since contamination during food handling could occur, but would be used to wrap foods inside a secondary synthetic package during food distribution and storage. The wraps could also be used in the home to cover leftovers in the refrigerator, peeled fruit mixtures or as a sandwich bag for lunch. Because such wraps are biodegradable and may even be eaten, they are not harmful to the environment. This attribute could also reduce waste disposal costs. Applications of several protein-based edible films, such as corn zein on nut and fruit products, casein emulsion film on fruit, and whey protein films on fruit products (Wittaya, 2012).
3 Objectives
The objectives of this research are
1. To analyze effect of glycerol concentration on properties of the film 2. To analyze effect of sealing time and temperature on properties of film
RESEARCH METHODOLOGY
Materials
Gelatin is obtained from commercial fish gelatin (Rousselot® 275 FG8). The chemical required for the sample preparation and analysis including glycerol, bovine serum albumin (BSA), biuret reagent, and distillate water.
Instruments
The equipments for this research are analytical balance, magnetic water bath stirrer, magnetic stirrer, ultrasonic cleaner, silicone resin plate, ventilated oven, spectrophotometer, vortex, Mitutoyo dial thickness gage micrometer, TA.XT plus texture analyzer, ultra scan XE hunter lab, “MTMS” Kit M08-08, oven, silica gel, and desiccator.
Method
Effect of glycerol concentration on properties of the film
Gelatin film preparation was modified from methods of Limpisophon et al., (2009). Gelatin powder was dissolved at 60 0C for 30 min to obtain the film-forming solution (FFS) with 5% (w/v) protein concentration. Glycerol as a plasticizer was added into FFS at the concentration of 15%, 20%, 25%, 30% and 35% (w/w) of protein with continuous stirring at room temperature for 20 min. The air bubbles in the FFS were removed by a ultrasonic cleaner. De-aerated FFS was cast onto a rimmed silicone resin plate and dried in a ventilated oven at 25 ± 0.5 0C and 50 ± 5% relative humidity (RH) for 24 h. Films were then conditioned at 25 ± 0.5 0C and 50 ± 5% RH for 48 h before analysis. Physical properties of the film were then analyzed, which are color, film thickness, tensile strength, elongation at break and moisture content. This analyze result use to determine one level of glycerol for further study of sealing properties.
Effect of sealing time and temperature on properties of film
4
plasticizer was added into FFS at the concentration of 25% (w/w) of protein with continuous stirring at room temperature for 20 min. The air bubbles in the FFS were removed by a ultrasonic cleaner. De-aerated FFS was cast onto a rimmed silicone resin plate and dried in a ventilated oven at 25 ± 0.5 0C and 50 ± 5% relative humidity (RH) for 24 h. Film samples were cut into strips and sealed. Films were then conditioned at 25 ± 0.5 0C and 50 ± 5% RH for 48 h before analysis. Properties of the film were then analyzed, which are color, transparency, opacity, and seal strength.
Methods of Analysis
Protein analysis of fish gelatin
Amount of protein was determined by using biuret assay according to AOAC (1995). Dilution series of calibration standard was prepared in the buffer or solvent used to prepare the sample. In separate test tubes, add 1 ml of protein containing sample and of each dilution of the calibration standard to 4 ml biuret reagent and vortex. The solutions were incubated at room temperature for 20 minutes. Absorbance of the sample, calibration standards, and reference standard were measured at 550 nm. Calibration plot was prepared by graphing absorbance at 550 nm values for standards versus protein concentration (µg protein/ml). Protein concentration of the sample was determined by interpolation from the plot. Color
Color of film was determined according Nuthong et al., (2009) using a Ultra Scan XE Hunter Lab and expressed as L* (lightness), a* (redness/greenness) and b* (yellowness/blueness) values.
Film thickness
Film thickness was measured based on Limpisophon et al., (2009) with Mitutoyo dial thickness gage micrometer. Six measurements were taken at random positions.
Tensile strength and elongation at break (Limpisophon et al., 2009)
5 TS(MPa) = Fmax/A
where F max = maximum load (N) needed to pull the sample apart;A = cross- sectional area (m2) of the samples; EAB (%) was calculated by following equation:
EAB (%) = (E/30) x 100
where E = film elongation (mm) at the moment of rupture; 30 = initial grip length (mm) of samples.
Moisture Content
Moisture content determine according Rubilar et al., (2013). To determine the moisture content of films, about 50 mg of film were dried at 105 0C during 24 h (until the equilibrium weight was attained). The weight loss of the sample was determined, and moisture content was calculated using the following equation:
where Mi and Mf are the masses of initial and dried samples, respectively. Three replicates were obtained for each sample.
Transparency and opacity
The barrier properties of gelatin films against ultraviolet (UV) and visible light were measured according Limpisophon et al., (2009) at selected wavelength between 200 and 800 nm using a UV–Visible Recording Spectrophotometer. The transparency of the films was calculated according to Han and Floros (1997) by the following equation:
Transparency (A/mm) = - log T/x
where A = absorbance at each wavelength; T = transmittance (%) at each wavelength; x = film thickness (mm). According to the equation, high transparency indicates opaque.
The opacity of the films was calculated the following equation: Opacity (%) = 100% - T
where T = transmittance (%) at each wavelength.
Seal strength determination
6
plus texture analyzer, at 25 ± 0.5 0C and 50 ± 5% RH. Each leg of the sealed film was clamped to the machine, with each end of the sealed film held perpendicularly to the direction of the pull. Seal strength was calculated as follows:
Seal strength (N/m) = peak force/film width
The maximum force required to cause seal failure was reported as seal strength in Newtons/meter (N/m).
Statistical analysis
Statistical analysis used completely randomized experimental design for effect of glycerol concentration on properties of the film and factorial design for effect of sealing time and temperature on properties of film. Analyses of variance (ANOVA) were used to analyze data and mean comparisons were run by Duncan’s multiple range tests using SPSS programs (version 20.0) at p<0.05.
RESULT AND DISCUSSION
Protein content of fish gelatin
Protein content of gelatin was determined by biuret assay. Absorbance of the sample, calibration standard and reference standard were measured at 550 nm. Protein standard curve was determined by graphing absorbance value at 550 nm and protein concentration (mg protein/ml). The linier regression was y = 0.0317x + 0.619 with R2 = 0.9999. Protein content determined based on linier regression. It showed protein content in 100 g gelatin is 88.52 ± 0.11 g. Based on nutritional information, protein content of fish gelatin is 88 g. The result showed that protein content of fish gelatin close on nutritional information from the company (see appendix 3). This protein concentration will be used in preparation of gelatin films for further analysis.
Effect of glycerol concentration on properties of the film
Color
7 Table 1. Effect of glycerol concentration on color of 5% protein fish gelatin film
Sample 5% protein L* a* b* 1Data are expressed as mean ± standard deviation
2Same superscripts indicate data is not significantly different (p > 0.05) Film thickness, tensile strength and elongation at break
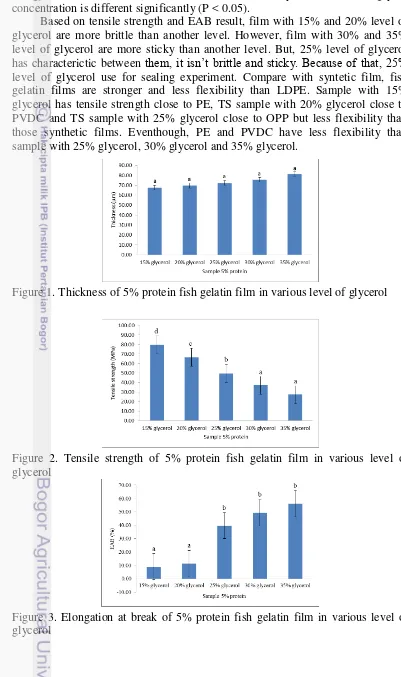
Film thickness is used to calculate the tensile strength of the film. Figure 1 and Table 2 showed the thickness of 5% protein fish gelatin film in various level of glycerol. Addition of glycerol concentration influence to film thickness. The higher level of glycerol added so the film thickness would be higher. This result is similar to Zhang and Han (2006) that the thickness of the film increased as the amount of plasticizers increased. This phenomena happen because addition of glycerol increase total amount of solids in the film so the thickness also increase. Thickness of the film consecutively are 67.69 µm (15% glycerol), 69.58 µm (20% glycerol), 72.13 µm (25% glycerol), 75.56 µm (30% glycerol), and 81.34 µm (35% glycerol). Based on statistical analysis, thickness of each glycerol concentration is not different significantly (P > 0.05).
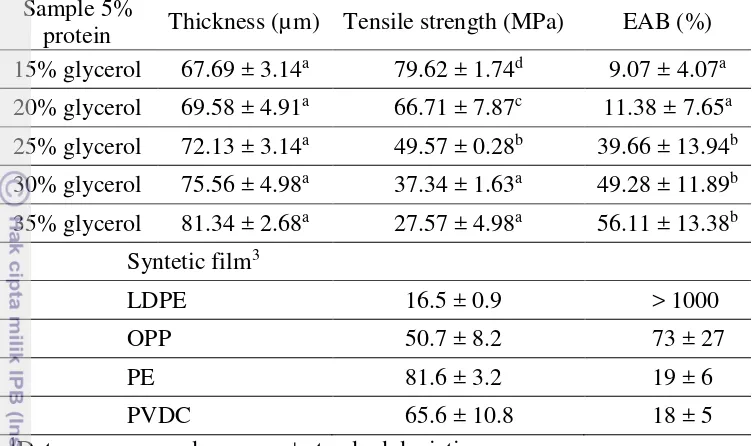
Effect of glycerol concentration on tensile strength is presented in Figure 2 and Table 2. TS of the film consecutively are 79.62 MPa (15% glycerol), 66.71 MPa (20% glycerol), 49.57 MPa (25% glycerol), 37.34 MPa (30% glycerol), and 27.57 MPa (35% glycerol). TS of the film decreased when glycerol concentration increased. This due to the use of glycerol reduce brittleness by lowering the inter-molecular interactions between adjacent chains of the biopolymers (Nuthong et al., 2009), so TS of the film decrease when glycerol concentration increase. According Jongjareonrak et al., (2006) glycerol has the relatively small molecule with hydrophilic characteristic which could be easily inserted between protein chains and establish hydrogen bonds with amide group and amino acid side chains of proteins. When glycerol was incorporated in the gelatin film network, direct interactions and the proximity between protein chains were reduced. Based on the statistical analysis, TS of each glycerol concentration is different significantly (P < 0.05).
8
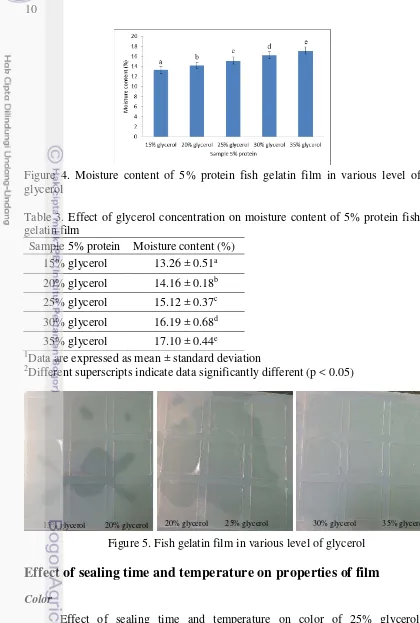
(Jongjareonrak et al., 2006). Based on the statistical analysis, EAB of each glycerol concentration is different significantly (P < 0.05).
Based on tensile strength and EAB result, film with 15% and 20% level of glycerol are more brittle than another level. However, film with 30% and 35% level of glycerol are more sticky than another level. But, 25% level of glycerol has characterictic between them, it isn’t brittle and sticky. Because of that, 25% level of glycerol use for sealing experiment. Compare with syntetic film, fish gelatin films are stronger and less flexibility than LDPE. Sample with 15% glycerol has tensile strength close to PE, TS sample with 20% glycerol close to PVDC and TS sample with 25% glycerol close to OPP but less flexibility than those synthetic films. Eventhough, PE and PVDC have less flexibility than sample with 25% glycerol, 30% glycerol and 35% glycerol.
Figure 1. Thickness of 5% protein fish gelatin film in various level of glycerol
Figure 2. Tensile strength of 5% protein fish gelatin film in various level of glycerol
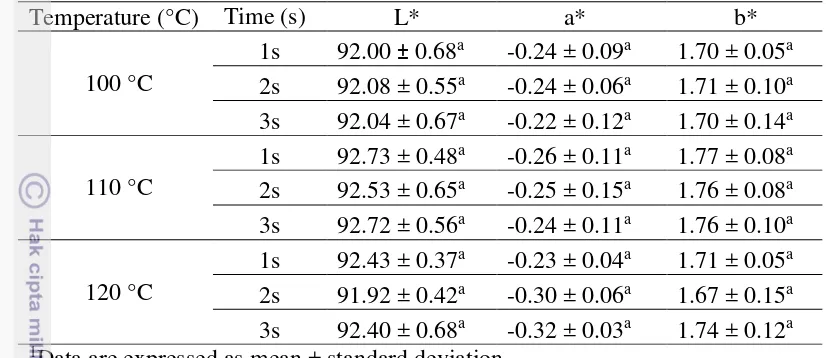
9 Table 2. Effect of glycerol concentration on thickness, tensile strength and elongation at break
Sample 5%
protein Thickness (µm) Tensile strength (MPa) EAB (%) 15% glycerol 67.69 ± 3.14a 79.62 ± 1.74d 9.07 ± 4.07a
1Data are expressed as mean ± standard deviation
2Different superscripts indicate data significantly different (p < 0.05)
3LDPE (low-density polyethylene), OPP (oriented polypropylene), PE (polyester), PVDC (polyvinylidene chloride) (Shiku et al., 2003)
Moisture content
10
Figure 4. Moisture content of 5% protein fish gelatin film in various level of glycerol
Table 3. Effect of glycerol concentration on moisture content of 5% protein fish gelatin film
Sample 5% protein Moisture content (%) 15% glycerol 13.26 ± 0.51a 20% glycerol 14.16 ± 0.18b 25% glycerol 15.12 ± 0.37c 30% glycerol 16.19 ± 0.68d 35% glycerol 17.10 ± 0.44e
1Data are expressed as mean ± standard deviation
2Different superscripts indicate data significantly different (p < 0.05)
Figure 5. Fish gelatin film in various level of glycerol
Effect of sealing time and temperature on properties of film
Color
Effect of sealing time and temperature on color of 25% glycerol concentration of the film was presented in Table 4. The appearance of sealed film is clear, green and yellow. This result almost the same with the film before sealed, but the lightness of sealed film decreased. Color of sealed film is not significantly different on each sealing time and temperature (p > 0.05). It means that sealing time and temperature don’t have effect to color.
11 1Data are expressed as mean ± standard deviation
2Same superscripts indicate data not significantly different (p > 0.05) Transparency and opacity
Effect of sealing time and temperature before and after sealed on transparency of 25% glycerol concentration of the film were presented in Figure 6. Transparency used to know the barrier properties of sealed film against ultraviolet and visible light. Lower transparency value showed that film more transparent and clear. From the figure, transparency value on visible light range is very low that indicate the film transparent. Transparency (A600/mm) of some synthetic films, LDPE (low-density polyethylene) 3.05, OPP (oriented polypropylene) 1.67, PE (polyester) 1.51, and PVDC (polyvinylidene chloride) 4.58 (Shiku et al., 2003). Transparency of the film before or after seal are more transparent than pea protein isolate edible film (16.71 ± 0.93) (Choi and Han, 2002) and close to some syntetic film (OPP and PE). These result can indicate that the film are transparent and clear enough for use as packaging.
12
Before sealed After sealed
Figure 6. Effect of sealing temperature and time before and after sealed on transparency of 25% glycerol concentration of the film
13
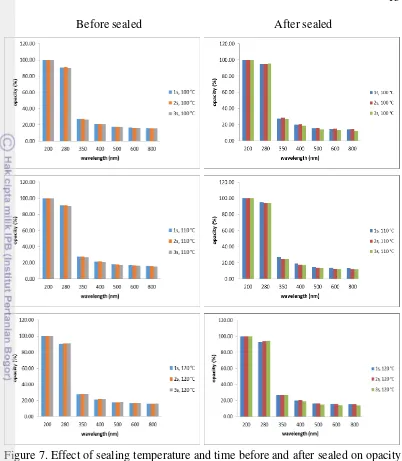
Before sealed After sealed
Figure 7. Effect of sealing temperature and time before and after sealed on opacity of 25% glycerol concentration of the film
Seal strength
heat-14
sealed synthetic polymers was >730 N/m (Kim and Ustunol, 2001). Highest seal strength was observed at temperature 110 0C and time 3 s for 25% glycerol concentration of the film.
Table 5. Effect of sealing temperature and time on seal strength of 25% glycerol concentration of the film
Temperature (°C) Time (s) Seal strength (N/m)
100
1 442.20 ± 247.16 2 970.71 ± 62.81 3 1226.33 ± 230.33
110
1 1484.29 ± 331.85 2 1682.91 ± 243.02 3 1706.94 ± 246.26
120
1 1251.01 ± 168.37 2 1446.37 ± 78.97 3 1703.84 ± 111.52
CONCLUSION AND RECOMMENDATION
Conclusion
Increase levels of glycerol causes increase in thickness, elongation at break and moisture content but decrease in tensile strength. Different sealing temperature and time didn’t affect significantly on color, transparency, and opacity. Compare with film before sealed, color of the film was decreased after it sealed. But it was still clear and very transparent. The film has good barrier properties against ultraviolet (UV) light even after it sealed. Different sealing temperature and time have effect on seal strength. Seal strength will increase with increase of temperature. Increase of time also make seal strength increase. But combination temperature and time didn’t have significant effect on seal strength.
Recommendation
15
REFERENCES
AOAC. 1995. Official Methods of Analysis. Association of Official Analytical Chemists, Washington, DC, USA.
ASTM. 2009. Annual Book of ASTM Standards. West Conshohocken, PA 19428-2959, United States. 832-841 p.
Bourtoom, T., Chinnan, M. S., Jantawat, P., & Sanguandeekul, R. 2006. Effect of select parameters on the properties of edible film from water-soluble fish proteins in surimi wash-water. Swiss Society of Food Science and Technology, LWT, 39: 405–418.
Cerqueira, M. A., Souza, B. W. S., Teixeira, J. A., & Vicente, A. A. 2012. Effect of glycerol and corn oil on physicochemical properties of polysaccharide films - A comparative study. Food Hydrocolloids 27, 175-184.
Choi, W. S. & Han, J. H. 2001. Film-forming mechanism and heat denaturation effects on the physical and chemical properties of pea-protein-isolate edible films. Journal of Food Science, 67 (4): 1399– 1406.
Elango, J., Robinson, J. S., Arumugam, V., Geevaretnam, J., & Durairaj, S. 2014. Effect of Protein and Sorbitol Concentrations on the Properties of Fish Gelatin Films. American Journal of Advanced Food Science and Technology, 2 (1): 1-11.
Gómez-Estaca, J., Bravo, L., Gómez-Guillén, M. C., Alemán, A., & Montero, P. 2009. Antioxidant properties of tuna-skin and bovine-hide gelatin films induced by the addition of oregano and rosemary extracts. Food Chemistry, 112: 18-25.
Gómez-Guillén, M. C., Pérez-Mateos, M., Gómez-Estaca, J., López-Caballero, E.,Giménez, B. & Montero, P. 2009. Fish gelatin: a renewable material for developing active biodegradable films. Trends in Food Science and Technology 20 (1): 3–16.
Hamaguchi, P. Y., Yin, W. W, & Tanaka, M. 2007. Effect of pH on the formation of edible films made from the muscle proteins of Blue marlin (Makaira mazara). Food Chemistry, 100: 914–920.
Han, J. H. & Floros, J. D. 1997. Casting antimicrobial packaging films and measuring their physical properties and antimicrobial activity. Journal of Plastic Film and Sheeting, 13(4): 287–298.
Hernandez, I. V. M., & Krochta, J. M. 2009. Thermal Transitions and Heat-sealing of Glycerol-plasticized Whey Protein Films. Packaging Technology and Science, 22: 255–260.
Hosseini, S. F., Rezaei, M., Zandi, M., & Ghavi, F. F. 2013. Preparation and functional properties of fish gelatin–chitosan blend edible films. Food Chemistry, 136: 1490–1495.
16
Karim, A.A. & Bhat, R. 2009. Fish gelatin: properties, challenges, and prospects as an alternative to mammalian gelatins. Food Hydrocolloids, 23: 563–576. Kim, S. J. & Ustunol, Z. 2001. Thermal Properties, Heat Sealability and Seal Attributes of Whey Protein Isolate/Lipid Emulsion Edible Films. Journal of Food Science, 66 (7): 85-990.
Limpisophon, K., Tanaka, M., Weng, W. Y., Abe, S., & Osako, K. 2009. Characterization of gelatin films prepared from under-utilized blue shark (Prionace glauca) skin. Food Hydrocolloids, 23: 1993–2000.
Mu, C., Guo, J., Li, X., Lin, W., & Li D. 2012. Preparation and properties of dialdehyde carboxymethyl cellulose crosslinked gelatin edible films. Food Hydrocolloids, 27: 22-29.
Nuthong, P., Benjakul, S., & Prodpran, T. 2009. Effect of some factors and pretreatment on the properties of porcine plasma protein-based films LWT - Food Science and Technology,42: 1545–1552.
Rubilar, F. J, Cruz, M. S. R., Silva, D. H., Vicente, A. A., Khmelinskii, I., & Vieira, C. M. 2013. Physico-mechanical properties of chitosan films with carvacrol and grapeseed extract. Journal of Food Engineering, 115: 466– 474.
Shiku, Y., Hamaguchi, P. Y., & Tanaka, M. 2003. Effect of pH on the preparation of edible films based on fish myofibrillar proteins. Fisheries Science, 69: 1026-1032.
Vanin, F. M., Sobral, P. J. A., Menegalli, F. C., Carvalho, R. A., Habitante, A. M. Q. B. 2005. Effects of plasticizers and their concentrations on thermal and functional properties of gelatin-based films. Food Hydrocolloids, 19: 899– 907.
Wittaya, T. 2012. Protein-Based Edible Films: Characteristics and Improvement of Properties, Structure and Function of Food Engineering, Prof. Ayman Amer Eissa (Ed.), ISBN : 978 - 953 - 51 - 0695 - 1, InTech, DOI:10.5772/48167.
Yuan, C. S., Hassan , A., Ghazali, M. I., & Ismail, A. F. 2006. Heat-seal strength analysis of laminated films with LLDPE and LDPE sealant materials in bar sealing application. FEIIC Seminar on Engineering and Technology. Zaman, H. U., Khan, M. A., & Khan, R. A. 2012. Studies on the
Thermo-Mechanical Properties of Gelatin Based Films Using 2-Hydroxyethyl Methacrylate by Gamma Radiation. Open Journal of Composite Materials, 2: 15-21.
17 APENDICES
Apendix 1. Protein standard curve for fish gelatin
Apendix 2. Protein concentration of fish gelatin
Replication
Absorbance Protein concentration Protein concentration
(mg/10 mg gelatin) Duplication 1 Duplication 2 Duplication 1 Duplication 2
1 0.340 0.340 8.7729 8.7729 8.7729
2 0.350 0.340 9.0883 8.7729 8.9306
Average (mg/10 mg gelatin) 8.8517
Protein concentration in 100 g gelatin (%) 88.52 ± 0.11
18
Apendix 4. Statistical analysis of color
ANOVA
Sum of Squares df Mean Square F Sig.
L
Between Groups ,026 4 ,007 ,525 ,724
Within Groups ,063 5 ,013
Total ,089 9
a
Between Groups ,000 4 ,000 ,030 ,998
Within Groups ,004 5 ,001
Total ,004 9
b
Between Groups ,002 4 ,000 ,173 ,943
Within Groups ,011 5 ,002
Total ,013 9
Apendix 5. Statistical analysis of thickness
ANOVA
thickness
Sum of Squares df Mean Square F Sig.
Between Groups 232,833 4 58,208 3,838 ,086
Within Groups 75,840 5 15,168
Total 308,673 9
Apendix 6. Statistical analysis of tensile strength
ANOVA
tensile strength
Sum of Squares df Mean Square F Sig.
Between Groups 3593,868 4 898,467 48,584 ,000
Within Groups 92,466 5 18,493
19 Post Hoc Tests
tensile strength
Duncan
sample 5% protein gelatin N Subset for alpha = 0.05
1 2 3 4
35% glycerol 2 27,5700
30% glycerol 2 37,3400
25% glycerol 2 49,5650
20% glycerol 2 66,7150
15% glycerol 2 79,6200
Sig. ,072 1,000 1,000 1,000
Means for groups in homogeneous subsets are displayed.
a. Uses Harmonic Mean Sample Size = 2.000.
Apendix 7. Statistical analysis of elongation at break
ANOVA
elongation at break
Sum of Squares df Mean Square F Sig.
Between Groups 3766,779 4 941,695 7,985 ,021
Within Groups 589,638 5 117,928
Total 4356,417 9
Post Hoc Tests
elongation at break
Duncan
sample 5% protein gelatin N Subset for alpha = 0.05
1 2
15% glycerol 2 9,0700
20% glycerol 2 11,3800
25% glycerol 2 39,6650
30% glycerol 2 49,2750
35% glycerol 2 56,1100
Sig. ,840 ,200
Means for groups in homogeneous subsets are displayed.
20
Apendix 8. Statistical analysis of moisture content
ANOVA
Means for groups in homogeneous subsets are displayed.
a. Uses Harmonic Mean Sample Size = 3.000.
Apendix 9. Statistical analysis of color on sealed film
Tests of Between-Subjects Effects
Intercept 230105,754 1 230105,754 696180,650 ,000
21
Tests of Between-Subjects Effects
Dependent Variable: a
Source Type III Sum of
Squares
df Mean Square F Sig.
Corrected Model ,025a 8 ,003 ,379 ,918
Intercept 1,763 1 1,763 213,785 ,000
temp ,010 2 ,005 ,591 ,564
time ,003 2 ,002 ,187 ,831
temp * time ,012 4 ,003 ,368 ,828
Error ,148 18 ,008
Total 1,937 27
Corrected Total ,173 26
a. R Squared = ,144 (Adjusted R Squared = -,236)
Tests of Between-Subjects Effects
Dependent Variable: b
Source Type III Sum of
Squares
df Mean Square F Sig.
Corrected Model ,029a 8 ,004 ,355 ,931
Intercept 80,152 1 80,152 7762,232 ,000
temp ,021 2 ,010 1,012 ,383
time ,002 2 ,001 ,119 ,889
temp * time ,006 4 ,001 ,144 ,963
Error ,186 18 ,010
Total 80,367 27
Corrected Total ,215 26
22
Apendix 10. Light transmission before sealed of 25% glycerol concentration of the film
Apendix 11. Light transmission after sealed of 25% glycerol concentration of the film
A = Absorbance T = Transmittance (%)
A T A T A T A T A T A T A T
1 0.066 0.000 100.000 1.022 9.506 0.140 72.444 0.105 78.524 0.085 82.224 0.080 83.176 0.076 83.946
2 0.072 0.000 100.000 1.052 8.872 0.139 72.611 0.103 78.886 0.083 82.604 0.078 83.560 0.073 84.528
3 0.065 0.000 100.000 0.967 10.789 0.135 73.282 0.102 79.068 0.083 82.604 0.078 83.560 0.074 84.333
1 0.079 0.000 100.000 1.312 4.875 0.157 69.663 0.111 77.446 0.087 81.846 0.082 82.794 0.077 83.753
2 0.086 0.000 100.000 1.266 5.420 0.152 70.469 0.108 77.983 0.085 82.224 0.080 83.176 0.075 84.140
3 0.070 0.000 100.000 1.013 9.705 0.137 72.946 0.102 79.068 0.082 82.794 0.078 83.560 0.073 84.528
1 0.068 0.000 100.000 1.266 5.420 0.152 70.469 0.108 77.983 0.085 82.224 0.080 83.176 0.075 84.140
2 0.085 0.000 100.000 1.291 5.117 0.156 69.823 0.112 77.268 0.088 81.658 0.082 82.794 0.077 83.753
3 0.086 0.000 100.000 1.295 5.070 0.155 69.984 0.111 77.446 0.087 81.846 0.081 82.985 0.076 83.946
100
1 0.081 0.000 100.000 1.307 4.934 0.141 72.320 0.098 79.806 0.075 84.053 0.069 85.245 0.066 85.821
2 0.080 0.000 100.000 1.355 4.415 0.149 71.024 0.102 79.149 0.077 83.746 0.071 84.983 0.069 85.405
3 0.080 0.000 100.000 1.368 4.281 0.136 73.139 0.090 81.262 0.067 85.762 0.061 86.800 0.059 87.319
1 0.083 0.000 100.000 1.325 4.729 0.136 73.089 0.092 80.951 0.069 85.223 0.064 86.217 0.062 86.637
2 0.079 0.000 100.000 1.236 5.804 0.125 75.009 0.083 82.512 0.064 86.379 0.059 87.252 0.058 87.580
3 0.078 0.000 100.000 1.225 5.957 0.124 75.162 0.082 82.815 0.062 86.652 0.057 87.633 0.056 87.932
1 0.071 0.000 100.000 1.164 6.860 0.136 73.164 0.096 80.106 0.078 83.596 0.074 84.362 0.073 84.499
2 0.073 0.000 100.000 1.205 6.232 0.137 72.940 0.099 79.663 0.078 83.582 0.074 84.326 0.073 84.614
3 0.079 0.000 100.000 1.273 5.337 0.137 72.958 0.092 80.944 0.071 84.838 0.067 85.696 0.065 86.063
23 Apendix 12. Effect of sealing temperature and time before sealed on transparency and opacity of 25% glycerol concentration of the film
Apendix 13. Effect of sealing temperature and time after sealed on transparency and opacity of 25% glycerol concentration of the film
T = Transparency (A/mm) O = Opacity (%)
T O T O T O T O T O T O T O
1 0.00 100.00 15.31 90.49 2.06 27.14 1.57 21.39 1.27 17.68 1.19 16.73 1.13 15.96
2 0.00 100.00 14.59 91.12 1.93 27.39 1.47 21.48 1.14 17.30 1.09 16.53 1.04 15.76
3 0.00 100.00 15.62 90.34 2.07 26.64 1.57 20.93 1.28 17.40 1.20 16.44 1.14 15.67
1 0.00 100.00 15.29 91.14 2.05 27.72 1.54 21.65 1.27 18.15 1.18 17.02 1.11 16.15
2 0.00 100.00 14.91 91.09 2.00 27.72 1.53 22.02 1.21 17.78 1.13 16.82 1.06 15.86
3 0.00 100.00 14.58 90.29 1.96 26.97 1.47 20.93 1.18 17.21 1.12 16.44 1.05 15.47
1 0.00 100.00 14.96 90.35 2.04 27.31 1.54 21.39 1.24 17.68 1.17 16.73 1.11 15.96
2 0.00 100.00 15.03 91.13 2.01 27.72 1.53 21.92 1.21 17.78 1.14 16.82 1.08 15.95
3 0.00 100.00 15.02 91.12 2.01 27.72 1.53 21.84 1.24 18.06 1.16 17.01 1.09 16.05
110
1 0.00 100.00 16.20 94.69 1.75 27.60 3.44 20.11 0.94 15.87 0.86 14.70 0.83 14.13
2 0.00 100.00 16.85 94.94 1.84 28.73 1.26 20.68 0.96 16.14 0.88 14.92 0.85 14.51
3 0.00 100.00 16.99 95.43 1.70 26.83 1.13 18.70 0.84 14.20 0.77 13.16 0.74 12.65
1 0.00 100.00 15.96 95.26 1.64 26.91 1.10 19.05 0.84 14.78 0.77 13.78 0.75 13.36
2 0.00 100.00 15.80 94.17 1.60 24.99 1.07 17.49 0.81 13.62 0.76 12.75 0.74 12.42
3 0.00 100.00 15.72 94.04 1.59 24.83 1.05 17.18 0.80 13.34 0.74 12.36 0.72 12.06
1 0.00 100.00 16.33 93.11 1.91 26.83 1.36 19.88 1.10 16.39 1.04 15.63 1.03 15.49
2 0.00 100.00 16.52 93.71 1.87 27.05 1.35 20.32 1.06 16.40 1.01 15.66 0.99 15.37
3 0.00 100.00 16.08 94.47 1.74 27.03 1.17 19.04 0.91 15.15 0.85 14.29 0.83 13.92
24
Apendix 14. Statistical analysis of seal strength
Tests of Between-Subjects Effects
Dependent Variable: seal strength (N/m)
Source Type III Sum of
Squares
df Mean Square F Sig.
Corrected Model 4132967.576a 8 516620.947 11.773 .000
Intercept 47319284.007 1 47319284.007 1078.321 .000
temp 2774332.088 2 1387166.044 31.611 .000
time 1089981.492 2 544990.746 12.419 .000
temp * time 268653.996 4 67163.499 1.531 .236
Error 789882.997 18 43882.389
Total 52242134.580 27
Corrected Total 4922850.573 26
a. R Squared = .840 (Adjusted R Squared = .768)
Post Hoc Tests
Temperature (°C)
seal strength (N/m)
Duncan
Temperature (°C) N Subset
1 2
100 °C 9 879.7478
120 °C 9 1467.0733
110 °C 9 1624.7144
Sig. 1.000 .128
Means for groups in homogeneous subsets are displayed.
Based on observed means.
The error term is Mean Square(Error) = 43882.389.
a. Uses Harmonic Mean Sample Size = 9.000.
25 Time (s)
seal strength (N/m)
Duncan
Time (s) N Subset
1 2
1s 9 1059.1678
2s 9 1366.6633
3s 9 1545.7044
Sig. 1.000 .087
Means for groups in homogeneous subsets are
displayed.
Based on observed means.
The error term is Mean Square(Error) = 43882.389.
a. Uses Harmonic Mean Sample Size = 9.000.
26
AUTHOR BIOGRAPHY
Indah Kurniasari was born on 6th January 1993 in Bandar Lampung, Sumatera, Indonesia. She is the first child with two sisters from Ir. Hadropin and Ir. Siti Chotimah. She studied her kindergarten school in TK 01 YAPINDO (1997-1999), elementary school in SD 01 YAPINDO (1999-2004), junior high school in SMP YAPINDO (2004-2007), and senior high school in Sugar Group High School (2007-2010). In 2010, she continued her further study in Bogor Agricultural University with Undangan Seleksi Masuk IPB (USMI) and she was accepted as Food Science and Technology student in the Faculty Agricultural Engineering and Technology. During her study, she was active in some BEM FATETA (Badan Eksekutif Mahasiswa Fakultas Teknologi Pertanian) program activities such as Sereal (2012), Hassassin (2012), and Falcon (2013). She was also active in some HIMITEPA (Food Science and Technology Student Association) program activities such as Suksesi (2012), HACCP PLASMA (2012), BAUR ACCESS (2012), I-FOOD DAY (2012), HACCP PLASMA (2013).