Movement Intention Detection Using Neural
Network for Quadriplegic Assistive Machine
T.A.Izzuddin
1, M.A.Ariffin
2, Z.H.Bohari
3, R.Ghazali
4, M.H.Jali
5 Faculty of Electrical EngineeringUniversiti Teknikal Malaysia Melaka Malacca, Malaysia email:[email protected],
2
[email protected], [email protected] , [email protected], [email protected]
Abstract—Biomedical signal lately have been a hot topic for researchers, as many journals and books related to it have been publish. In this paper, the control strategy to help quadriplegic patient using Brain Computer Interface (BCI) on basis of Electroencephalography (EEG) signal was used. BCI is a technology that obtain user’s thought to control a machine or device. This technology has enabled people with quadriplegia or in other words a person who had lost the capability of his four limbs to move by himself again. Within the past years, many researchers have come out with a new method and investigation to develop a machine that can fulfill the objective for quadriplegic patient to move again. Besides that, due to the development of bio-medical and healthcare application, there are several ways that can be used to extract signal from the brain. One of them is by using EEG signal. This research is carried out in order to detect the brain signal to controlling the movement of the wheelchair by using a single channel EEG headset. A group of 5 healthy people was chosen in order to determine performance of the machine during dynamic focusing activity such as the intention to move a wheelchair and stopping it. A neural network classifier was then used to classify the signal based on major EEG signal ranges. As a conclusion, a good neural network configuration and a decent method of extracting EEG signal will lead to give a command to control robotic wheelchair.
Keywords—Quadriplegic, Electroencephalography (EEG), Rehabilitation
I.INTRODUCTION
Currently, the use of bio-signals such as EMG, EEG and ECG to help the life of elderly people and the disabled are rising [1],[2],[3]. People who are severely immobilized, quadriplegics in particular, may not have the ability to easily control an electric wheelchair and thus are confined to a push-chair, depend on external support [4]. However, researcher has developed tools to use EEG as human command to control machines [5]. At the same time, many ways have been developed to help patient with quadriplegia to recover their ability to move. One of the ways to regain the ability is by using robotic wheelchair. This project introduces a robotic wheelchair controlled by using single channel EEG headset to control the movement of stop and forward of a wheelchair. A single channel EEG headset was used do to its practicality and ease of use. Although the use of EEG signal to control movement of electric wheelchair wasn’t new [5][6][7], most
researches focuses on the use of multi-channel EEG head cap which is impractical for daily use and may cause discomfort to actual patient. Raw EEG signals are then processed and classified using neural network classifier.
II. METHODANDEXPERIMENTALSETUP
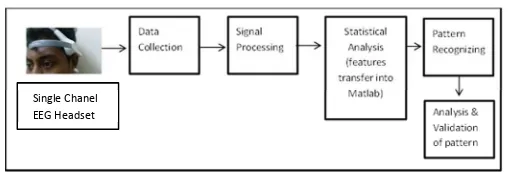
Figure 1: Flow of the project
This research will focus mainly on recording electrical signal produced by brain activity. EEG signal of human brain activity will be recorded and there are several criteria during the process of choosing the pattern. The subject must be good in mental and physical shape. The amounts of human subject selection are 5 individuals that selected randomly in order to examine the various outcomes of the result to ensure the best pattern to command the wheelchair.
A. NEUROSKY MINDWAVE HEADSET
This project proposes the use of Neurosky Mindwave headset as a medium to collect EEG signal from patient’s forehead and conveying it to a computer. This hardware consists of a dry electrode that was placed on the left forehead of the subjects to attain their EEG signal, such as shown in Figure 2. Embedded inside this EEG headset is the ThinkGear AM digital chip that enables the extraction of raw EEG signal and convert it normalized data. Although, the normalized data are mostly noise-free, the data still needs to be categorized into its own wave ranges types such as alpha, beta, delta, theta and gamma. In order to classify EEG wave, Fast-Fourier Transform will be used to accomplish the wave classification. Next, average of each range EEG waves will be used for Neural Network input.
Figure 2: NeuroSky Mindwave Headset [16]
B. PLACEMENT OF ELECTRODE
After finishing the skin preparation process, the next step is placement of electrodes. At this stage, placement of electrodes will determine the acquisition of these EEG signals. EEG signal represents the brain activity in all condition neither during meditation and relaxation mode. In order to get the consistency of EEG signal data, the placement of electrodes will be placed on the same spot of scalp and it is preferable to place the electrodes on the same position and condition of scalp while repeating collecting data. Based on previous research, cerebrum which the largest part of brain consist of the right and left of cerebral hemispheres that control the motor of muscle. Sensory cortex and motor cortex are located in the cerebrum [8]. There is specific position where the motor and sensory cortex relates to the certain parts of the body. Frontal lobe is vital for controlling thoughts, reasoning and behavior [15] and [16]. This part also called Broca area, apart from that this part also controls motor functions of human .
C. EXPERIMENTAL PROCEDURE
A study of previous experimental technique is carried to be performed by subjects. All the scope stated must be considered before any procedure is confirmed. Rehabilitation Engineering and Assistive Technology (REAT) lab situated on second floor of G block, Faculty of Electrical Engineering, Universtiti Teknikal Malaysia Melaka (UTeM) was selected due to few factors such as controlled surroundings away from public noise, public sight and ease to get a subject for data recording. Subject intent must not be distracted to reduce a noise from the raw data collected. Apart noise from public, presence of electrical machines that might disturb the performance of the EEG headset as the headset use a wireless application and a small magnetic field might interrupt the performance. After preliminary procedure executed a track for subject was set up in the controlled room.
Figure 3: Track was setup for the experiment
Subject was given a period to familiarize with the automatic wheelchair that controlled using joystick on the right-side arm rest pad. On the interface of the controller there are few features such as speed controller and horn function for safety reason. For experiment procedure the speed was set up to a constant value for all subjects to make sure there is no difference between the subjects for data recordings. A brief explanation about the experimental methods was given to all of the subjects before the data recording session takes place. There will be stop and forward movement during the one-minute operation. This action will repeated 3 times for each subject to have more data for neural network pattern recognition as the performance will be more accurate if the sample data are many.
A test for the Neurosky Mindwave was carried out to obtain a reduced-noise data. If the data recorded was not very satisfying a few step must be done such as cleaning again the forehead, earlobe, electrode and change the battery in the Neurosky Mindwave headset. After the recorded data collected is satisfying enough, the experiment was then started. An unwanted signal often occurs due to subject’s skin are not clean enough and improper placement of electrode.
Figure 4: Overall experiment setup
Figure 4 display an entire idea on how the experiment will be carried out. Firstly, the subject will control the robotic wheelchair while using NeuroSky Mindwave headset. Data from NeuroSky Mindwave headset are transmitted wirelessly by using USB adapter that comes with the NeuroSky Mindwave headset package. At the same time, NeuroSky Mindwave headset will transmit the data from subject to the NeuroSky Mindwave USB adapter that is attached to a personal computer (PC). MATLAB software running on the PC was used for further data processing to obtain the result of the experiment.
IV. RESULT AND DISCUSSION
Figure 5: Normalized EEG Signal
From the Neurosky headset a data in the Figure 5 was obtained. The x-axis of the data represent the time (ms) for the data to be record versus y-axis which represent the amplitude of the data (uV) for each second in the trial experiment period. From the headset specification, it states that every 1 second it will generate 512 of normalized data [19]. From total of 1 minute recorded time for experiment operation there will be 30720 of tabulated data.
Next, this data divided into each part for further process. In the previous chapter the experimental procedure was explained which there was stop and forward movement of the wheelchair. Those stop and forward movement time were recorded and the time interval between these two actions is identified. For the next process a data from each interval was organized. At 5,17,27,32,37,47,52 and 59 second, a data have been selected for Fast-Fourier Transform that will produce a frequency versus amplitude graph. Basically, Fast-Fourier Transform will converts time domain to frequency domain or vice versa.
Example of how to determine the data recorded at desired interval is explained in the mathematical equation below. For instance from the recorded video the subject stop at 11th second. In order to obtain the normalized data for Fast-Fourier Transform analysis simple mathematical task need to be done.
• For 11th second
• Sampling time is 512 Hz
11 512 5632
5632 512 6144
Hence, from the tabulated Normalized EEG signal table data ranging from row numbered 5632 until 6144 can be selected for Fast-Fourier Transform analysis.
A. FEATURES EXTRACTION
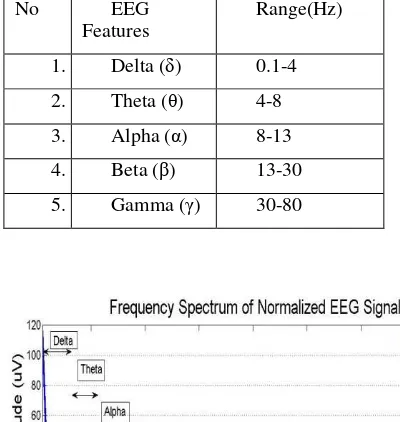
After the Fast-Fourier Transform graph was obtained the graph is scaled down to 0-80 Hz such as shown in Figure 6. This range was utilized because all EEG signal ranges are between 0.1 Hz-80 Hz [12]. An average for each range was calculated and tabulated for Pattern Recognition process in MATLAB software. Each range is classified as follows:
TABLE 1: Features of EEG signal
No EEG
Features
Range(Hz)
1. Delta (δ) 0.1-4
2. Theta (θ) 4-8
3. Alpha (α) 8-13
4. Beta (β) 13-30
5. Gamma (γ) 30-80
B. FEED FORWARD BACK PROPAGATION WITH SCALED GRADIENT CONJUGATE TRAINING
FUNCTION
By using this method, data collected was trained to confirm either the features extracted data satisfied enough to become as input for Pattern Recognition purpose. First, select the data which fit the inputs and aims to correct the problem. Input data signify the static data to the network whereas output data are target data chosen for network output.
After the data was organized, it then will be fed into Pattern Recognition tool for the final result of the study. For the percentage of the training, validation and testing is set to be different for each times of trial to acquire the best result.
C. PATTERN RECOGNITION AND CLASSIFICATION RESULT
From the Pattern Recognition and Classification tools in MATLAB software a result of the data from input and output can be obtained directly. For this study only three result will be discussed which is Matrix Confusion, Mean Square Error (MSE) and Receiver Operating Character (ROC). From the result, the numerical value keep changing even the parameters did not change. In order to archive the best result number of hidden neuron will set into three values which are 50, 500 and 5000. Each value will trained three times and the average result of Matrix Confusion, MSE and ROC are taken as the final result of the experiment. This action also will conclude what ranges of hidden neuron must be tuned to gain a consistent result.
TABLE 2 Classifier Performance vs Number of Hidden Neurons
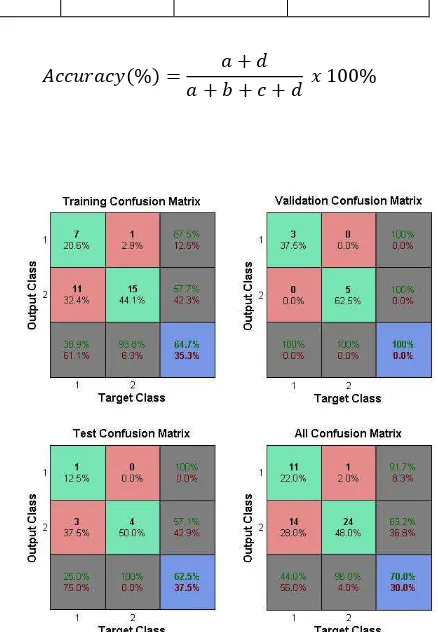
D. MATRIX CONFUSION
Matrix confusion comprises statistics about actual and expected classifications done by a classification structure. Performance of such systems is normally assessed using the figures in the matrix. Confusion matrix also can determine the number of how many testing data passed for the data classification. Besides that, confusion matrix can predicted the number of data that might be misclassified by the system.
TABLE 3 Confusion Matrix arrangement
Predicted
Stop Forward
Actual Stop a b
Forwar d
c d
% 100%
Figure 7: Matrix confusion result from Pattern Recognition tools in MATLAB software
From Figure 7 an example of result displayed result of training, validation, testing and average of the result are acquired. This model is the will be trained 3 times with number of hidden neuron set to be 50,500 and 5000. Each overall performance for every number of hidden neuron are tabulated in Table 3
From Table 2 it states that as the number of hidden neuron increase the overall performance also increase. This is because a high number of hidden neuron are important if the data classification is harder to distinguish. Besides that, the number of hidden neuron ranging from 1000-5000 might matching with this system effectively because the input data is slight. Remarks
No.
of
Hidden Neuron
Training
(%)
Validation
(%)
Testing
(%)
Average
(%)
50 44.1 75.0 62.5 52.0
500 82.4 75.0 62.5 78.0
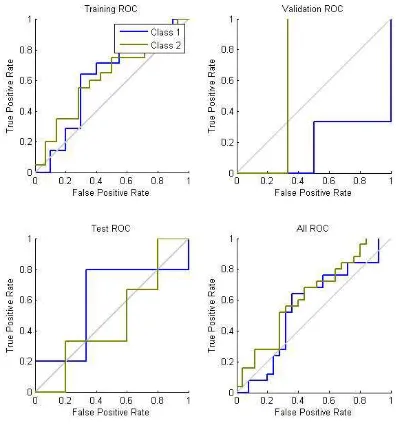
E. RECEIVER OPERATING CHARACTERISTIC (ROC)
Receiver operating characteristic (ROC) is another ways to resolve the performance of neural network classification apart from confusion matrix. A ROC graph is a design with the false positive rate on the X axis and the true positive rate on the Y axis. The position (0,1) is the flawless classifier, it categorizes all positive cases and negative cases appropriately. It is (0,1) because the false positive rate is 0 (none), and the true positive frequency is 1 (all). The position (0,0) signifies a classifier that expects all cases to be negative, while the position (1,1) corresponds to a classifier that guesses every case to be positive. Point (1,0) is the classifier that is improper for all classifications. In many cases, a classifier has a constraint that can be adjusted to increase TP at the cost of an increased FP or decrease FP at the cost of a decrease in TP.
Each limitation setting provides a (FP, TP) pair and a series of such pairs can be used to plot an ROC curve. A non-parametric classifier is represented by a single ROC point, matching to its (FP,TP) pair. In a simple words a good classifiers graph will moves to top left corner directly. Theoretically, great model graph will show that the lines will climb quickly toward top left corner and if the lines lies underneath the diagonal line the system are inaccurate predicted the cases. Although, the best result failed to archive desired result the final result still managed to differentiate between stop and forward waves. For this result, three values of hidden neuron was set to gain the best hidden neuron value that suit with the model.
Figure 8: ROC curve of 50 hidden neurons
Figure 9: ROC curve of 500 hidden neurons
Figure 10: ROC curve of 5000 hidden neurons
V.CONCLUSIONANDRECOMMENDATION
EEG is a technique for determining the electrical signal from the brain to observe the subject intention. Hence, EEG signal brings valuable figures about the nerve system of brain. From the research, raw EEG signals of stop and forward brain activity signal from subjects were successfully measured from the left frontal lobe using Neurosky Mindwave headset. Then, in order to gain the normalized EEG signals, the subjects must go through several measures like skin preparation, tools set up and sensor location procedure to avoid artifacts that surely will affect the reading. All of these procedures are essential in order to gain a better quality of EEG signals. Based on previous research, generally raw EEG signals also contain a noise occur from the interior noise which is tissue characteristic, skin impedance and blinking of an eye. While for the external noise, it's caused by the surrounding environment condition such as public sight and operating machine. Placement of electrodes also will contribute to the noise if it was wrong placed and not on the left frontal lobe.
After that, EEG ranges of waves was successfully being extracted from the normalize EEG data. All the features are recommended as input for a classification purpose by using neural network. Neural network classification is a supervise type of classification that need a target to match between the input and output. From the extracted features, the data will be classified into 2 main groups, stop and forward. The data were effectively classified into 2 group, although there were cross over between stop and forward movement of subjects.
Besides that, there are several things need to be developed for future researches. While dealing with brain, EEG devices used should be high specification and decent enough to detect the brain activity because the noise of from subject itself is different from each other. Then, the level of subjects with intention to stop or move forward also needs to more specific. It also can provide a data without any crossover while extracting the features for comparison purpose. In order to realize the main target for this study, a program that can process the preprocessing data must be made and use the neural network model that already trained. In advance, this project still can improve by classified the different intention of subject movement by using feed forward back propagation neural network with Levernberg-Marquardt training method or another training method that would make a better result.
VI. ACKNOWLEDGEMENT
This work was supported by Ministry of Higher Education Malaysia (MOHE) Research Grants and Universiti Teknikal Malaysia Melaka (UTeM).
REFERENCES
[1] C. Mandel, L. Thorsten, T. Laue, R. Thomas, and A. Gr, “Navigating a Smart Wheelchair with a Brain-Computer Interface Interpreting
Steady-State Visual Evoked Potentials, IEEE/RSJ International Conference on Intelligent Robots and Systems”( C. Mandel, L. Thorsten, T. Laue, R. Thomas, and A. Gr) pp. 1118–1125, 2009.
[2] K. Ullah, A. P. E. E. Deptt, M. Ali, S. E. E. Deptt, M. Rizwan, S. E. E. Deptt, M. Imran, and S. E. E. Deptt, “Low-Cost Single-Channel EEG Based Communication System for People with Lock-in Syndrome,”, 2011.
[3] M.H. Jali, M.F. Sulaima, T.A. Izzuddin, W.M. Bukhari, M.F. Baharom, “Comparative Study of EMG based Joint Torque Estimation ANN Models for Arm Rehabilitation Device”, International Journal of Applied Engineering Research, Vol 9 (10), pp. 1289 - 1301, 2014 [4] N. T. Nguyen, H. T. Nguyen, and S. Su, “Advanced robust tracking
control of a Powered wheelchair system,” Proceedings of the 29th
Annual International Conference of the IEEE EMBS.( N. T. Nguyen, H.
T. Nguyen, and S. Su), pp. 4767–4770, 2007.
[5] B. Shin, T. Kim, and S. Jo, “Non-invasive brain signal interface for a wheelchair navigation,” International Conference on Control, Automation and Systems 2010 (B. Shin, T. Kim, and S. Jo,)pp. 2257– 2260, 2010.
[6] T. F. Bastos-Filho, A. Ferreira, A. C. Atencio, S. Arjunan, and D. Kumar, “Evaluation of feature extraction techniques in emotional state recognition,” IEEE Proceedings of 4th International Conference on
Intelligent Human Computer Interaction, (T. F. Bastos-Filho, A.
Ferreira, A. C. Atencio, S. Arjunan, and D. Kumar)pp. 1–6, Dec. 2012. [7] K. K. Ang, C. Guan, K. S. G. Chua, B. T. Ang, C. Kuah, C. Wang, K. S.
Phua, Z. Y. Chin, and H. Zhang, “A clinical evaluation on the spatial patterns of non-invasive motor imagery-based brain-computer interface in stroke.,” 30th Annual International IEEE EMBS Conference (K. K. Ang, C. Guan, K. S. G. Chua, B. T. Ang, C. Kuah, C. Wang, K. S. Phua, Z. Y. Chin, and H. Zhang) pp. 4174–4177, Jan. 2008.
[8] “Wilder Penfield, Theodore Rasmussen-The Cerebral Cortex Of Man- A
Clinical Study Of Localization Of Function 1st ed. -MacMillan ,1950.
[9] Neurosky.com “The application does not show brainwaves even though it looks connected?” Available [Online]. At : http://support.neurosky.com/kb/mindwave/the-application-does-not-show-brainwaves-even-though-it-looks-connected (Accessed: 8 November 2014)
[10] K. Tanaka, K. Matsunaga, and H. O. Wang, “of an Electric Wheelchair,”
Ieee Transactions On Robotics, Vol. 21, No. 4,( K. Tanaka, K.
Matsunaga, and H. O. Wang) pp. 762–766, 2005.
[11] B. Rebsamen, C. Guan, S. Member, H. Zhang, C. Wang, C. Teo, M. H. Ang, and E. Burdet, “A Brain Controlled Wheelchair to Navigate in Familiar Environments,” IEEE Transactions On Neural Systems And Rehabilitation Engineering, Vol. 18, No. 6, (B. Rebsamen, C. Guan, S. Member, H. Zhang, C. Wang, C. Teo, M. H. Ang, and E. Burdet,) 2010. [12] F. Carrino, J. Dumoulin, E. Mugellini, O. A. Khaled, and R. Ingold, “A
Self-Paced BCI System To Control An Electric Wheelchair : Evaluation Of A Commercial , Low-Cost EEG Device.”,2008.
[13] F. B. E. N. T. Aher, N. B. E. N. Amor, and M. Jallouli, “EEG control of an electric wheelchair for disabled persons,” International Conference
on Individual and Collective Behaviors in Roboticspp. 27–32,( F. B. E.
N. T. Aher, N. B. E. N. Amor, and M. Jallouli) 2013.
[14] Ericka Janet Rechy-Ramirez, Huosheng Hu and Klaus McDonald-Maier “Head movements based control of an intelligent wheelchair in an indoor environment” Proceedings of the 2012 IEEE International
Conference on Robotics and Biomimetics pg 1464-1469 (Ericka Janet
Rechy-Ramirez, Huosheng Hu and Klaus McDonald-Maier), 2012. [15] Lai Weit, Huosheng Hut, Tao Lut and Kui Yuan ” Evaluating the
Performance of a Face Movement based Wheelchair Control Interface in an Indoor Environment” Proceedings of the 2010 IEEE International
Conference on Robotics and Biomimetics pg 387-392 (Lai Weit,
Huosheng Hut, Tao Lut and Kui Yuan),2010.