DEVELOPMENT OF LAND SUITABILITY EVALUATION
SYSTEM FOR COASTAL AQUACULTURE
USING ARTIFICIAL NEURAL NETWORK AND
GEOGRAPHICAL INFORMATION SYSTEMS
Case Study: Mahakam Delta, East Kalimantan
I KETUT SUTARGA
GRADUATE SCHOOL
ABSTRACT
I Ketut Sutarga (2005). Development of Land Suitability Evaluation System for Coastal Aquaculture Using Artificial Neural Network and Geographical Information Systems (Case Study: Mahakam Delta, East Kalimantan). Under the Supervision of I Wayan Astika and Antonius Bambang Wijanarto.
Land suitability is the aptitude of given type of land to support a certain use. Land suitability is one of key factors for the sustainability of aquaculture system. It can be determined by using matching methods between land suitability criteria and land characteristics, such as topography, hydrography, climate, water characteristic, risk, land cover, and spatial plan aspects. Evaluation of land for aquaculture suitability can be reached using a parametric approach, which is implemented by using the distinguish land characteristics and combination of it. Parametric approach uses the numeric value, which classifies the land based on individual characteristics.
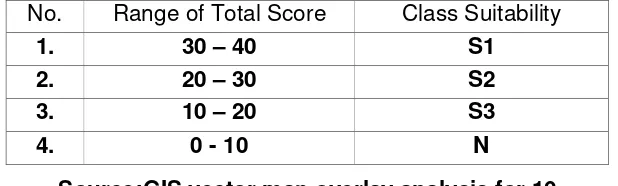
The objectives of the research are to develop a land evaluation system on aquaculture suitability by using artificial neural network (ANN) and geographical information system (GIS) and to evaluate the performance of the new developed system as compared to GIS vector spatial analysis method. Four types of suitability were defined, i.e. highly suitable (S1), moderately suitable (S2), marginally suitable (S3) and not suitable (N). The new developed GIS model uses the raster format and ANN classifier. The performance of GIS model was then evaluated, and compared to the vector map overlay that used GIS spatial analysis features, including suitability distribution, covered area, processing speed and validity.
The multilayer feedforward of the ANN with backpropagation learning algorithm was chosen to do the classification. GIS overlaid layer in form of spatial database was then converted into training dataset, validation dataset and prediction dataset. Training and validation dataset contains a pair of input and output, while the prediction dataset contains input data only.
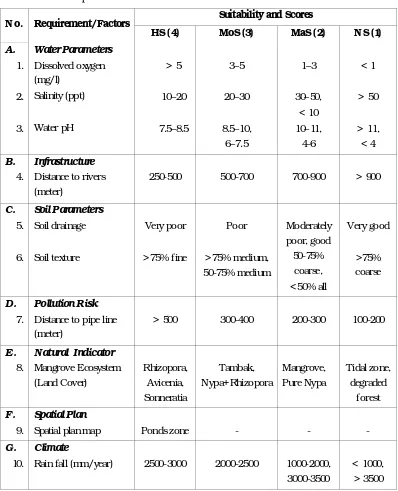
To compare the two methods, the Mahakam Delta-East Kalimantan were selected as a case study. Ten thematic map layers of land characteristic were involved in both methods, i.e.: water salinity, dissolved oxygen, water pH, soil texture, soil drainage, distance to rivers, pollution risk, land cover type, land use plan and annual rainfall intensity. Each feature of thematic map layers were classified and scored using 1 to 4 ranges from worst to best, respectively.
DEVELOPMENT OF LAND SUITABILITY EVALUATION
SYSTEM FOR COASTAL AQUACULTURE USING
ARTIFICIAL NEURAL NETWORK AND GEOGRAPHICAL
INFORMATION SYSTEMS
Case Study: Mahakam Delta - East Kalimantan
I KETUT SUTARGA
A Thesis submitted for the degree of Master of Science
of Bogor Agricultural University
MASTER OF SCIENCE IN INFORMATION TECHNOLOGY
FOR NATURAL RESOURCES MANAGEMENT
GRADUATE SCHOOL
BOGOR AGRICULTURAL UNIVERSITY
Research Title : Development of Land Suitability Evaluation System for Coastal Aquaculture Using Artificial Neural Network and Geographical Information Systems (Case Study: Mahakam Delta, East Kalimantan) Student Name : I Ketut Sutarga
Student ID : G.051030131
Study Program : Master of Science in Information Technology for Natural Resources Management
Approved by, Advisory Board:
Dr. Ir. I Wayan Astika, M.Si Supervisor
Dr. Antonius Bambang Wijanarto Co-supervisor
Endorsed by,
STATEMENT
I, I Ketut Sutarga, hereby stated that this thesis entitled:
Development of Land Suitability Evaluation System for Coastal Aquaculture
Using Artificial Neural Network and Geographical Information Systems
(Case Study: Mahakam Delta, East Kalimantan)
is the result of my own work during the period of April until September 2005 and it has not been published before. The content of the thesis has been examined by the advising committee and the external examiner.
Bogor, November 2005
ACKNOWLEDGEMENT
I would to extend my special thanks to the following people for their contribution to this thesis.
ϖ The research was completed under the supervision of Dr. Ir. I Wayan Astika, M.Si as supervisor and Dr. Antonius B. Wijanarto as co-supervisor
who have kept me on track with their guidance, technical comments and
constructive criticism through all months of my research.
ϖ To my external examiner Dr. Ir. Djoko Purwanto, DEA, for his corrections, suggestions and positive ideas of this thesis.
ϖ To the MIT-SEAMEO BIOTROP management and staffs, as well as IPB Post Graduate who have supported our administration, technical aspects and the facilities.
ϖ To the lecturers of MIT who taught me with important knowledge for my future prospects.
ϖ To Bakosurtanal, especially for chairman and the head of the Center for Marine Natural Resource Survey for giving me the opportunity and funding to study for higher education.
ϖ To my friends of MIT 2003 batch, I really appreciate our togetherness, solidarities, and support to finish my study. Finally I am really thank to my beloved wife Suratmi and my daughter Saras and my son Sena for your eternal love, support and patience. I dedicated this thesis to my office Bakosurtanal.
Engineer Diploma in Geodetic Engineering from the Faculty of Engineering, Gadjah Mada University, Yogyakarta in 1991. From 1989 to 1993, he worked for private engineering company in the field of surveying, mapping and consulting engineering. Since 1994 to present, he has been working for National Coordinating Agency for Surveys and Mapping (Bakosurtanal), Cibinong, West Java.
TABLE OF CONTENTS
STATEMENT ... I
ACKNOWLEDGEMENT... ii
CURRICULUM VITAE ... iii
ABSTRACT ...iv
TABLE OF CONTENTS ...v
LIST OF TABLES ...vi
LIST OF FIGURES ...vii
LIST OF APPENDICES ... viii
I. INTRODUCTION ...1
1.1. Background ...1
1.2. Objectives ...4
1.3. Problem Statement ...5
1.4. Research Output ...5
II. LITERATURE REVIEW ...7
2.1. Geographical Information Systems ...7
2.1.1. Spatial and Attribute Data ...7
2.1.2. Spatial Analysis ...9
2.1.2.1. Vector Data Analysis ...10
2.1.2.2. Raster Data Analysis ...11
2.2. Artificial Neural Network ...12
2.2.1. Artificial Neural Network Basics ...12
2.2.2. Multi Layer Feedforward-Backpropagation ...15
2.2.2.1. Backpropagation Model ...15
2.2.2.2. Backpropagation Learning Algorithm ...16
2.3. Land Suitability ...19
2.4. Coastal-Aquaculture ...21
………... 21
2.1.1. Aquaculture System ………21
2.1.2. Cultivable Species ……….…… 22
2.5. Previous Related Research ……… 23
III. RESEARCH METHODOLOGY ………25
3.3.1. Data Acquisition ……… 26
3.3.2. Field Data Processing ……… 28
3.3.3. Equipments ……… 29
3.4. Procedures ………. 30
3.4.1. Spatial Database Preparation ……… 30
3.4.2. Mapping Suitability by Vector Analysis ……….. 32
3.4.3. Map Conversion and Combination ……….. 34
3.4.4. Building Artificial Neural Network ………. 35
3.4.4.1. Training Process ……….. 35
3.4.4.2. Validation ……… 37
3.4.4.3. Map the Raster GIS and ANN Suitability …….. 38
3.5. Land Suitability Comparison ……… 40
IV. RESULT AND DISCUSSION ……….. 41
4.1. Performances of ANN and GIS Method ……… 41
4.1.1. Training Data Sets ………. 41
4.1.2. Validation Data Sets ……….. 42
4.2. Land Suitability Map of Raster GIS and ANN ………. 43
4.3. Land Suitability Analysis using Vector-Map Overlay ……….. 45
4.4. Comparison of Field Data and Land Suitability ……… 48
4.5. Comparison of The Two Methods ……… 50
4.5.1. Suitability Distributions ………. 50
4.5.2. Area Covers ……… ……….. 52
V. CONCLUSIONS ……… 56
5.1. Conclusions ……… 56
5.2. Recommendations ………. 57
REFERENCES ……….. 58
DEVELOPMENT OF LAND SUITABILITY EVALUATION
SYSTEM FOR COASTAL AQUACULTURE
USING ARTIFICIAL NEURAL NETWORK AND
GEOGRAPHICAL INFORMATION SYSTEMS
Case Study: Mahakam Delta, East Kalimantan
I KETUT SUTARGA
GRADUATE SCHOOL
ABSTRACT
I Ketut Sutarga (2005). Development of Land Suitability Evaluation System for Coastal Aquaculture Using Artificial Neural Network and Geographical Information Systems (Case Study: Mahakam Delta, East Kalimantan). Under the Supervision of I Wayan Astika and Antonius Bambang Wijanarto.
Land suitability is the aptitude of given type of land to support a certain use. Land suitability is one of key factors for the sustainability of aquaculture system. It can be determined by using matching methods between land suitability criteria and land characteristics, such as topography, hydrography, climate, water characteristic, risk, land cover, and spatial plan aspects. Evaluation of land for aquaculture suitability can be reached using a parametric approach, which is implemented by using the distinguish land characteristics and combination of it. Parametric approach uses the numeric value, which classifies the land based on individual characteristics.
The objectives of the research are to develop a land evaluation system on aquaculture suitability by using artificial neural network (ANN) and geographical information system (GIS) and to evaluate the performance of the new developed system as compared to GIS vector spatial analysis method. Four types of suitability were defined, i.e. highly suitable (S1), moderately suitable (S2), marginally suitable (S3) and not suitable (N). The new developed GIS model uses the raster format and ANN classifier. The performance of GIS model was then evaluated, and compared to the vector map overlay that used GIS spatial analysis features, including suitability distribution, covered area, processing speed and validity.
The multilayer feedforward of the ANN with backpropagation learning algorithm was chosen to do the classification. GIS overlaid layer in form of spatial database was then converted into training dataset, validation dataset and prediction dataset. Training and validation dataset contains a pair of input and output, while the prediction dataset contains input data only.
To compare the two methods, the Mahakam Delta-East Kalimantan were selected as a case study. Ten thematic map layers of land characteristic were involved in both methods, i.e.: water salinity, dissolved oxygen, water pH, soil texture, soil drainage, distance to rivers, pollution risk, land cover type, land use plan and annual rainfall intensity. Each feature of thematic map layers were classified and scored using 1 to 4 ranges from worst to best, respectively.
DEVELOPMENT OF LAND SUITABILITY EVALUATION
SYSTEM FOR COASTAL AQUACULTURE USING
ARTIFICIAL NEURAL NETWORK AND GEOGRAPHICAL
INFORMATION SYSTEMS
Case Study: Mahakam Delta - East Kalimantan
I KETUT SUTARGA
A Thesis submitted for the degree of Master of Science
of Bogor Agricultural University
MASTER OF SCIENCE IN INFORMATION TECHNOLOGY
FOR NATURAL RESOURCES MANAGEMENT
GRADUATE SCHOOL
BOGOR AGRICULTURAL UNIVERSITY
Research Title : Development of Land Suitability Evaluation System for Coastal Aquaculture Using Artificial Neural Network and Geographical Information Systems (Case Study: Mahakam Delta, East Kalimantan) Student Name : I Ketut Sutarga
Student ID : G.051030131
Study Program : Master of Science in Information Technology for Natural Resources Management
Approved by, Advisory Board:
Dr. Ir. I Wayan Astika, M.Si Supervisor
Dr. Antonius Bambang Wijanarto Co-supervisor
Endorsed by,
STATEMENT
I, I Ketut Sutarga, hereby stated that this thesis entitled:
Development of Land Suitability Evaluation System for Coastal Aquaculture
Using Artificial Neural Network and Geographical Information Systems
(Case Study: Mahakam Delta, East Kalimantan)
is the result of my own work during the period of April until September 2005 and it has not been published before. The content of the thesis has been examined by the advising committee and the external examiner.
Bogor, November 2005
ACKNOWLEDGEMENT
I would to extend my special thanks to the following people for their contribution to this thesis.
ϖ The research was completed under the supervision of Dr. Ir. I Wayan Astika, M.Si as supervisor and Dr. Antonius B. Wijanarto as co-supervisor
who have kept me on track with their guidance, technical comments and
constructive criticism through all months of my research.
ϖ To my external examiner Dr. Ir. Djoko Purwanto, DEA, for his corrections, suggestions and positive ideas of this thesis.
ϖ To the MIT-SEAMEO BIOTROP management and staffs, as well as IPB Post Graduate who have supported our administration, technical aspects and the facilities.
ϖ To the lecturers of MIT who taught me with important knowledge for my future prospects.
ϖ To Bakosurtanal, especially for chairman and the head of the Center for Marine Natural Resource Survey for giving me the opportunity and funding to study for higher education.
ϖ To my friends of MIT 2003 batch, I really appreciate our togetherness, solidarities, and support to finish my study. Finally I am really thank to my beloved wife Suratmi and my daughter Saras and my son Sena for your eternal love, support and patience. I dedicated this thesis to my office Bakosurtanal.
Engineer Diploma in Geodetic Engineering from the Faculty of Engineering, Gadjah Mada University, Yogyakarta in 1991. From 1989 to 1993, he worked for private engineering company in the field of surveying, mapping and consulting engineering. Since 1994 to present, he has been working for National Coordinating Agency for Surveys and Mapping (Bakosurtanal), Cibinong, West Java.
TABLE OF CONTENTS
STATEMENT ... I
ACKNOWLEDGEMENT... ii
CURRICULUM VITAE ... iii
ABSTRACT ...iv
TABLE OF CONTENTS ...v
LIST OF TABLES ...vi
LIST OF FIGURES ...vii
LIST OF APPENDICES ... viii
I. INTRODUCTION ...1
1.1. Background ...1
1.2. Objectives ...4
1.3. Problem Statement ...5
1.4. Research Output ...5
II. LITERATURE REVIEW ...7
2.1. Geographical Information Systems ...7
2.1.1. Spatial and Attribute Data ...7
2.1.2. Spatial Analysis ...9
2.1.2.1. Vector Data Analysis ...10
2.1.2.2. Raster Data Analysis ...11
2.2. Artificial Neural Network ...12
2.2.1. Artificial Neural Network Basics ...12
2.2.2. Multi Layer Feedforward-Backpropagation ...15
2.2.2.1. Backpropagation Model ...15
2.2.2.2. Backpropagation Learning Algorithm ...16
2.3. Land Suitability ...19
2.4. Coastal-Aquaculture ...21
………... 21
2.1.1. Aquaculture System ………21
2.1.2. Cultivable Species ……….…… 22
2.5. Previous Related Research ……… 23
III. RESEARCH METHODOLOGY ………25
3.3.1. Data Acquisition ……… 26
3.3.2. Field Data Processing ……… 28
3.3.3. Equipments ……… 29
3.4. Procedures ………. 30
3.4.1. Spatial Database Preparation ……… 30
3.4.2. Mapping Suitability by Vector Analysis ……….. 32
3.4.3. Map Conversion and Combination ……….. 34
3.4.4. Building Artificial Neural Network ………. 35
3.4.4.1. Training Process ……….. 35
3.4.4.2. Validation ……… 37
3.4.4.3. Map the Raster GIS and ANN Suitability …….. 38
3.5. Land Suitability Comparison ……… 40
IV. RESULT AND DISCUSSION ……….. 41
4.1. Performances of ANN and GIS Method ……… 41
4.1.1. Training Data Sets ………. 41
4.1.2. Validation Data Sets ……….. 42
4.2. Land Suitability Map of Raster GIS and ANN ………. 43
4.3. Land Suitability Analysis using Vector-Map Overlay ……….. 45
4.4. Comparison of Field Data and Land Suitability ……… 48
4.5. Comparison of The Two Methods ……… 50
4.5.1. Suitability Distributions ………. 50
4.5.2. Area Covers ……… ……….. 52
V. CONCLUSIONS ……… 56
5.1. Conclusions ……… 56
5.2. Recommendations ………. 57
REFERENCES ……….. 58
LIST OF TABLES
No. Caption Page
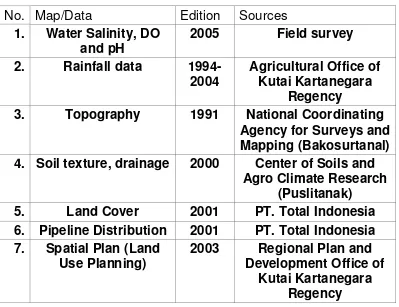
1.1. Land cover change of Mahakam delta: 1980-1996 ……… 4 3.1. Map and data that used in the research ………. 29 3.2. Classification scheme on aquaculture suitability, especially for
shrimps and crabs ……….………. 31
3.3. Range of suitability in aggregate of vector spatial analysis ………….. 34 3.4. Example of input (X) and output (Y) pattern of S1, S2, S3, and N ..… 37 4.1. Accuracy of ANN for training dataset processing ……… 42 4.2. Accuracy of ANN for validation dataset processing ……… 43 4.3. The “Unclassified” numbers of the prediction dataset ………. 44
4.4.
Comparison between GIS raster together
with ANN and GIS vector map overlay
………
LIST OF FIGURES
No. Caption Page
2.1. Overlay of map layer to generate the aggregate new output …………. 10 2.2. The simplified configuration of an organic neuron (a), and artificial
neural network (b) ………... 13
2.3. The sigmoid activation function ……….. 14
2.4. Backpropagation neural network ……… 16
3.1. The map of study area ……… 25
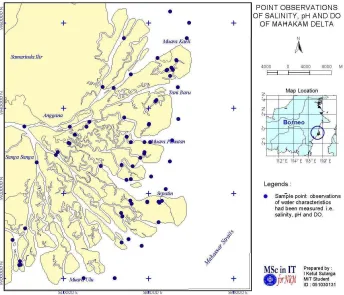
3.2. Distribution of water characteristic point observation, from field survey (2005) and obtained from Total Indonesia
(2004-2005)……… … 27
3.3.
Process of GIS map overlay steps of vector
spatial analysis ………..
32
3.4 Structure of multilayer feedforward backpropagation ANN ……….. 35 3.5 Process of GIS raster with training and validation of ANN ………… 39 3.6 Predicting the land suitability of GIS raster with ANN ……….. 40 4.1. The relationship of accuracy achieved and iteration epoch number .. 41 4.2. Land suitability map using raster GIS and ANN analysis ………….. 46 4.3. Land suitability map using vector map overlay analysis ………… ... 47 4.4. Distribution of pond productivity that produce shrimp and crab in
kg/ha/year ……… 49
4.5. Distribution of the suitability differences between GIS vector spatial
LIST OF APPENDICES
No. Caption Page
1. The training dataset ………. 61
2. The validation dataset ………. 62
3. The ANN prediction of suitability classes
4. List of points of water characteristic observation ……….. 68 5. List of shrimp and crab yield in the study area ……….. 70 6. Thematic layer: water salinity map ……… 71 7. Thematic layer: water dissolved oxygen map ……… 72
8. Thematic layer: Water pH map ………. 73
9. Thematic layer: soil map ……… 74
10. Thematic layer: rainfall intensity map ……… 75
11. Thematic layer: land cover map ………. 76
TABLE OF CONTENTS
STATEMENT ... i ACKNOWLEDGEMENT... ii CURRICULUM VITAE ... iii ABSTRACT ...iv TABLE OF CONTENTS ...v LIST OF TABLES ...vi LIST OF FIGURES ...vii LIST OF APPENDICES ... viii I. INTRODUCTION ...1 1.1. Background ...1 1.2. Objectives ...4 1.3. Problem Statement ...5 1.4. Research Output ...5 II. LITERATURE REVIEW ...7 2.1. Geographical Information Systems ...7 2.1.1. Spatial and Attribute Data ...7 2.1.2. Spatial Analysis ...9 2.1.2.1. Vector Data Analysis ...10 2.1.2.2. Raster Data Analysis ...11 2.2. Artificial Neural Network ...12 2.2.1. Artificial Neural Network Basics ...12 2.2.2. Multi Layer Feedforward-Backpropagation ...15 2.2.2.1. Backpropagation Model ...15 2.2.2.2. Backpropagation Learning Algorithm ...16 2.3. Land Suitability ...19 2.4. Coastal-Aquaculture ...21 2.1.1. Aquaculture System ...21 2.1.2. Cultivable Species ...22 2.5. Previous Related Research ...23 III. RESEARCH METHODOLOGY ...25 3.1. Site Descriptions ...25 3.2. Time and Location ...25 3.3. Data and Equipment ...26
LIST OF TABLES
No. Caption Page 1.1. Land cover change of Mahakam delta: 1980-1996 ...4 3.1. Map and data that used in the research ...29 3.2. Classification scheme on aquaculture suitability, especially for shrimps
and crabs 31
3.3. Range of suitability in aggregate of vector spatial analysis ...34 3.4. Example of input (X) and output (Y) pattern of S1, S2, S3, and N ...37 4.1. Accuracy of ANN for training dataset processing ...42 4.2. Accuracy of ANN for validation dataset processing ...43 4.3. The “Unclassified” numbers of the prediction dataset ...44
LIST OF FIGURES
No. Caption Page
2.1. Overlay of map layer to generate the aggregate new output ...10 2.2. The simplified configuration of an organic neuron (a), and artificial
neural network (b) 13
2.3. The sigmoid activation function 14
2.4. Backpropagation neural network 16 3.1. The map of study area 25
3.2. Distribution of water characteristic point observation, from field survey (2005) and obtained from Total Indonesia (2004-2005) 27
3.3. Process of GIS map overlay steps of vector spatial analysis 32 3.4. Structure of multilayer feedforward backpropagation ANN 35 3.5. Process of GIS raster with training and validation of ANN 39
3.6. Predicting the land suitability of GIS raster with ANN 40
4.1. The relationship of accuracy achieved and iteration epoch number 41 4.2. Land suitability map using raster GIS and ANN analysis 46
4.3. Land suitability map using vector map overlay analysis 47
4.4. Distribution of pond productivity that produce shrimp and crab in
kg/ha/year 49
4.5. Distribution of the suitability differences between GIS vector spatial analysis and GIS raster with Artificial Neural Network 51
LIST OF APPENDICES
No. Caption Page
I. INTRODUCTION
1.1. Background
Land evaluation is a process of assessing the land for defining the
suitability for specific uses. Generally, land evaluation deals with
agriculture, which provides information and recommendations for
deciding 'which crops to grow where' and other related questions. The
land evaluation in non-agriculture purposes has also been conducted in
many applications, such as site selection for specific land allocation for
waste disposal, real estate, sport center and others. The main product
of land evaluation investigations is a land classification that indicates
the suitability of various kinds of land for specific land uses, and it is
usually depicted on maps with accompanying reports. Land suitability
is the selection of suitable land, and suitable cropping and
management alternatives that are physically and financially practicable
and economically viable. The land suitability is the aptitude of a given
type of land to support a defined use. The process of land suitability
classification is the appraisal and grouping of specific areas of land in
terms of their suitability for a defined use.
Land suitability for certain purposes is needed to be defined to get
optimal utilization of land. Government should arrange and specify the
land use to have sustainability of the land and to maintain the
utilization. Another important aspect of land suitability is to allocate the
benefit and positive impact to increase local government revenue and
local economy.
Several methods have been used to define land suitability both for
agriculture or non- agriculture, such as the conventional method of
spatial analysis, multi criteria decision-making, and analytical hierarchy
process. This research will attempt to apply the artificial neural network
(ANN), that will be integrated to geographical information systems
(GIS). Mahakam Delta of East Kalimantan (Indonesia) area will be
evaluated for its land suitability based on physical aspects only using
this method. Land suitability of that area will be defined for coastal
aquaculture.
Land suitability is assessed and classified with respect to
specified kinds of uses. Evaluation is done through land suitability
involving comparison of two or more alternative kinds of use. The
suitability classes are defined by physical criteria, so that the
multidisciplinary approach is required. Suitability refers to land use on
a sustained basis. An ideal system to evaluate the land suitability
should take into account the physical, economic, social and political
context of the area concerned. However, due to the limitation of
Mahakam Delta data availability, time and cost, the evaluation will be
conducted based on physical aspects only.
Spatial analysis represents the methods to do land suitability,
which utilizes the GIS functionalities. It is conducted by superimposing
one map layer to another to perform the land unit for scoring, summing,
classifying and mapping the suitability classes. The process takes long
time to achieve the land suitability class map, because it conducts the
To overcome the conventional GIS-spatial analysis limitations, the
automatic spatial analysis is then introduced by integrating GIS
technology with neural network. Neural network represents the new
method, based on simplified models of the human-central nervous
system (Peterson, 1996). This method has been applied in many fields
such as: constraint satisfaction, forecasting, general mapping, control,
data compression, diagnostics, optimization, pattern recognition, risk
assessment, and multi sensor data fusion. In this research, neural
network will be applied to classify land suitability based on GIS-spatial
analysis data. This research aims at defining the land suitability for
aquaculture in Mahakam Delta-East Kalimantan, Indonesia by
evaluating the neural network method on GIS raster data and by
comparing the results against vector map overlay.
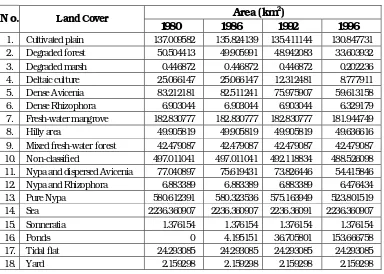
The developments of Mahakam Delta are very dynamic that can be
indicated on the series of land cover area recorded by the ‘PT. Total
Indonesia’ company (Total Indonesia, 2001) as shown in Table 1.1. The
table describes the trend of land cover change from 1980-1996. The
most rapid change area is Ponds (fish/shrimp ponds) which is 0 km
square in 1980 into 153.67 km squares in 1996. Other significant land
cover changes are: degraded forest, deltaic culture, dense avicenia,
nypa and dispersed avicenia, and pure nypa. This indicates that there is
a significant land utilization change from Non-Ponds into Ponds. Due to
this uncontrolled land cover change trend of the Mahakam Delta,
trend of changing from non-ponds into ponds problems in this study
[image:32.612.119.503.255.529.2]area.
Table 1.1. Land cover changes of Mahakam Delta 1980-1996.
Area (km2)
N o. Land Cover
1980 1986 1992 1996 1. Cultivated plain 137.009582 135.824139 135.411144 130.847731 2. Degraded forest 50.504413 49.905991 48.942083 33.603932 3. Degraded marsh 0.446872 0.446872 0.446872 0.202236 4. Deltaic culture 25.066147 25.066147 12.312481 8.777911 5. Dense Avicenia 83.212181 82.511241 75.975907 59.613158 6. Dense Rhizophora 6.903044 6.903044 6.903044 6.329179 7. Fresh-water mangrove 182.830777 182.830777 182.830777 181.944749 8. Hilly area 49.905819 49.905819 49.905819 49.636616 9. Mixed fresh-water forest 42.479087 42.479087 42.479087 42.479087 10. Non-classified 497.011041 497.011041 492.118834 488.526098 11. Nypa and dispersed Avicenia 77.040897 75.619431 73.826446 54.415846 12. Nypa and Rhizophora 6.883389 6.883389 6.883389 6.476434 13. Pure Nypa 580.612391 580.323536 575.163949 523.801519 14. Sea 2236.360907 2236.360907 2236.36091 2236.360907 15. Sonneratia 1.376154 1.376154 1.376154 1.376154
16. Ponds 0 4.195151 36.705801 153.666758
17. Tidal flat 24.293085 24.293085 24.293085 24.293085
18. Yard 2.159298 2.159298 2.159298 2.159298
1.2. Objectives
The objectives of this research are:
1) To develop a land evaluation system on coastal aquaculture
suitability by using artificial neural network (ANN) and
geographical information system (GIS).
2) To evaluate the performance of the new developed system as
compared to the GIS-vector spatial analysis method. The
processing speed and validity by taking coastal aquaculture
suitability at Mahakam Delta-East as a case study.
1.3. Problem Statement
As mention earlier, land evaluation is used to define the land
suitability for specific purpose such as coastal aquaculture in Mahakam
Delta, East Kalimantan. This suitability classes are needed for
arranging and specifying within this under developing area because of
the uncontrolled land use change. This area represents the most
dynamic area where the land is increasing in significant amount caused
by eroded process in upper land and heaped in the coastal. So, this is
why the land uses for spatial planning is needed to be emphasized in
more detail.
ANN is commonly used in image processing for supervised
classification method of remotely sensed data. In this case, a research
will be conducted on the ‘integrated ANN and GIS’ based on GIS data
for defining the land suitability for coastal aquaculture. The land
suitability that will be considered is based only on the physical aspects.
Another aspect that need to be emphasized in this research is to
develop land evaluation system in the form of application software
based on ANN and GIS
1.4. Research Output
with ANN classifier. A raster spatial analysis feature in GIS is
implemented for overlaying thematic map layer into new merging map,
while land suitability will be classified by using ANN. On the other
hand, vector spatial analysis in that study area will also be conducted.
This will provide good comparison on the performances of the GIS map
overlay against the proposed new method of ANN to produce land
suitability map for aquaculture.
The expected benefit of this research is that using the ANN
method, the land suitability map of coastal aquaculture can be done
more effectively and efficiently. This is not only for the case of
Mahakam Delta, but also for land suitability analysis in general. In the
case of Mahakam Delta, Coastal aquaculture suitability, will be
assessed only for the brackish water farming in the land, such as tiger
shrimp (Penaeus monodon) ponds even mud crab (Scylla serrata). The
land suitability on aquaculture availability would facilitate the local
government to make a decision on Mahakam Delta management. In the
long term, it will be expected the method will provide good assistance
II. LITERATURE REVIEW
2.1. Geographical Information Systems
2.1.1. Spatial and Attribute Data
A geographical information system (GIS) is a computer-based
system for managing spatial data, including the functionalities for data
capture, input, manipulation, transformation, visualization,
combination, query, analysis, modeling and output. (Bonham-Carter,
1994). GIS functionalities are the reliable tool for spatial analysis
dealing with geo-referenced data. Geographic data are characterized by
two fundamental components: the phenomenon such attribute and the
spatial location of it. Geographic data are inherent form of spatial data.
Geo-referenced data mean spatial data that pertain to location on the
earth’s surface.
Spatial data are associated with map, whereas attributes data are
supported with tables. The representation of spatial data is crucial for
any further processing and understanding of data. In general, spatial
data model consists of raster and vector models.
• Raster data model is a regularly spaced set of cells with associated
field values. The location of geographic objects is defined by its row
and column position of the cell they occupy. The associated value
with each cells are not illustrated, they are individual cells. Each cell
is stored in a unique value and represents an area of the land
• Vector data model represents the geographic objects in the real
world using the points and lines that define their boundaries. Their
locations on earth’s surface are referenced to map position using
Cartesian coordinate system. Points, lines and polygons are used to
represent irregularly distributed geographic object. The spatial
entities in vector model of correspond more or less to the spatial
entities that they represent in the real world.
An advantage of vector data model is efficient representation of
topology. However, it s a complex data structure, difficult to do overlay
and inefficient for image processing. On the other hand, raster data
model can make simple data structure, simple to do overlays and
efficient for image processing, although raster format is less compact
data structure and difficult to represent topology. Raster data format
enables to conduct map algebra such as for map combination. Another
advantage of raster data model is that raster provides wider variety of
range of attribute data, because each cells has value it self. Based on
this consideration, raster data model is chosen in this research
incorporated with ANN.
One important thing of GIS software is spatial data organization. A
spatial data layer is either a representation of continuous or discrete
field, or a collection of objects of the same kind. A data layer contains
spatial data of any attribute (or thematic) data. Data layers can be
overlaid with each other in GIS software. Spatial data layers can
perform spatial analysis such as overlay function, map algebra or other
GIS analysis functionalities.
Database management systems are computer systems for
the heart of any GIS. GIS system allows storing and manipulating the
database. Some GIS software use internal DBMS to manage non-spatial
data such attribute or thematic information, others provide linkages to
external DBMS.
Attribute is descriptive information characterizing a geographical
feature (point, line and area). Fact describes an entity in a relational
data model equivalent to the column in a relational table. Attribute
values can be written based on primary observation or they can be
derived by secondary processing and calculation. Attribute of spatial
object are usually organized into lists or tables. It draws in form of
computer organizational tables, two-dimensional arrays of number with
rows being entities or object and columns being attributes. Attribute is
also known as thematic information, which refers to other kinds of
properties of geographical object, such as land use, annual rainfall,
rock type or soil type.
Each of polygon, which is coded by value of features relates to
each attribute in each record. Numeric codes are the unique value that
can be distinguished from others. The relationship of spatial and
attribute data that describing the geographical information could be
formed both in vector and raster data model. This geographic
information format is simply depicted in the GIS software.
2.1.2. Spatial Analysis
The principal objective of spatial analysis is to transform and
suitability for certain purpose, modeling and many other applications.
Spatial analysis, in this case, will be conducted both in vector and
raster data format.
2.1.2.1. Vector Data Analysis
Spatial analysis of vector data is conducted by utilizing the GIS
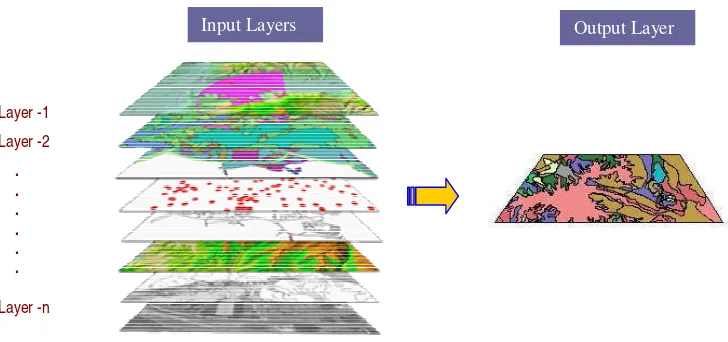
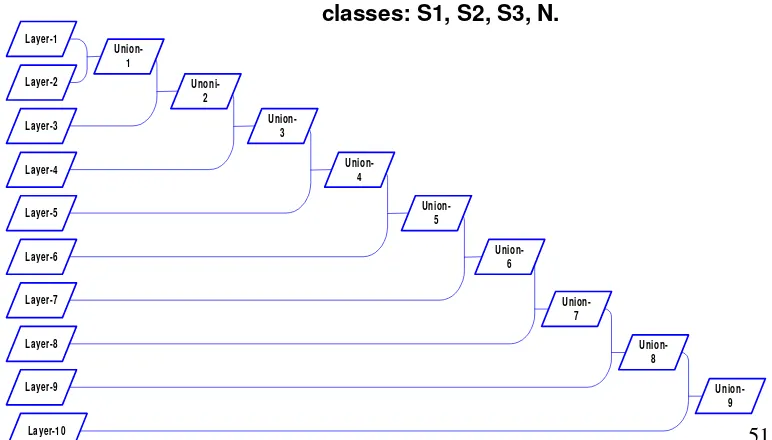
functionality in map overlay. Many functionalities of map overlay, i.e.
union, intersect, identity, erase. Map overlay functions combine the
geometry and attributes of two polygon feature maps to create a new
output map. Most of map overlay will be used by applying “Union’
operation. The illustration of ‘Union’ operation is depicted in Figure 2.1.
The output map represents the aggregate of the input both in spatial
and attributes. Map overlay of several feature maps (layers) is destined
only for polygon features.
For map layer consisting of line features such as rivers and pipe
gas line, analysis can be done by applying a zoning of it. This can be
done by applying “Buffer functionality. Buffering is the creation of
polygon features as far as a distance from the line center.
Layer -1 Layer -2
. . . . . .
Layer -n
[image:38.612.127.491.443.614.2]Input Layers Output Layer
The most important thing in map overlay is the attribute of each
layer database. Attribute of each map layer contains thematic
information and its score, respectively. Attribute distinguishes one
feature to others, while score determines the numeric value of
attributes. Both of attribute and score of each layer are brought to the
output map layer. The output map layer represents the aggregate of all
input layer. Analysis of new features of output map corresponds to the
total score of numeric value. Classification of total score represents
feature class of output map. In this research, classification of total
score aggregate is conducted by implementing the equal interval of the
maximum and the minimum range of values.
2.1.2.2. Raster Data Analysis
As mention before, the raster data model uses a regular grid to
cover the space in each grid cell to correspond to the characteristic of a
spatial phenomenon at the cell location. Raster data analysis can be
performed at the individual cell, or group of cell. An important
consideration in raster data analysis is the type of cell value and cell
size. Cell size deals with the detail level of information to be created.
Smaller cell size indicates more detail information and vice versa.
Raster analysis begins with the set up of an analysis environment
including the area extent and cell size. The extents zone of raster grid
Joining raster layer is implemented using cell-by-cell operations
(or local operation). A local operation creates a new grid from either a
single input grid or multiple input grids, and the cell values of the new
grid are computed by a function relating the input to the output. Joining
process in raster grid data looks like Union operation in vector format.
However, joining process is simpler and faster rather than union
operation. Analysis of raster data is incorporated with ANN.
2.2. Artificial Neural Network
2.2.1. Artificial Neural Network Basics
Artificial Neural Network represents the computational through
parallel-distributed information structure consisting of a set of adaptive
processing (computational) elements and a set of unidirectional data
connections (Abrahat and Fischer (2000). These data connection (or
network) are “neural” in the sense that they have been inspired by
neuroscience as biological or cognitive neural phenomena. In fact, ANN
is more common with traditional mathematical and/or statistical model,
such as non-parametric pattern classifier, statistical regression model
and clustering algorithm, rather than neurobiological models.
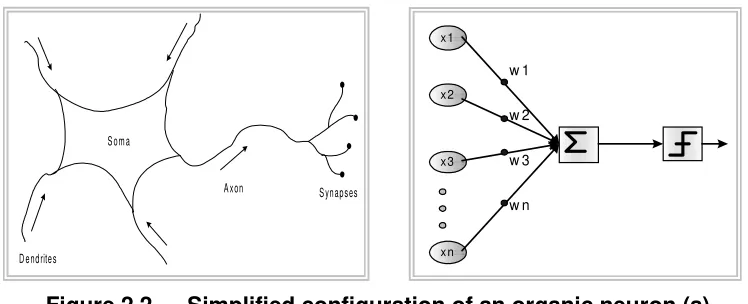
The simplest neural network architecture is a single layer
feedforward network. It is a single layer because the input patterns are
processed through a single layer of neuron only. An input pattern is
propagated through neural synaptic weight connections to the neuron
where response is generated as the output activation. It is feedforward
because signals propagate only in a forward direction, from the input
nodes to the output node. The simplified configuration of organic
neuron and its relation to the artificial model of neural network are
The basic computing element of biological system is the neuron. A
neuron is a small cell that receives electrochemical stimuli from
multiple sources and responds by generating electrical impulse that are
transmitted to other neurons or effector’s cells. Due to the amount of
neurons that will be processed, the architecture of artificial neural
network is fully done by a large number of nodes and connections.
Each connection points from one node to another is associated with a
weight. According to Fu (1994), the artificial neural network should
involve the following tasks: determination of network properties, node
properties and learning algorithm.
The network properties include connectivity (topology), type of
connections, the order of connections, and the weight range. The
[image:41.612.132.506.182.334.2]topology of a neural network refers to its framework as well as its Figure 2.2. Simplified configuration of an organic neuron (a), Artificial model of neuron (b), (Veelenturf, 1995).
S om a
D endrites
A xon S ynapses
x 1
x 2
x 3
x n
by the number of layers and the number of nodes per layer. Three types
of layers include (Fu, 1994):
• The input layer: The nodes, which encode the instance presented to
the network for processing. For example, each input unit may be
designated by an attribute value possessed by the instance.
• The hidden layer: The nodes, which are not directly observable and
hence hidden. They provide nonlinearities for the network.
• The output layer: The nodes which encode possible concept (or
value) to be assigned to the instance under consideration. For
example, each input unit represents a class of object.
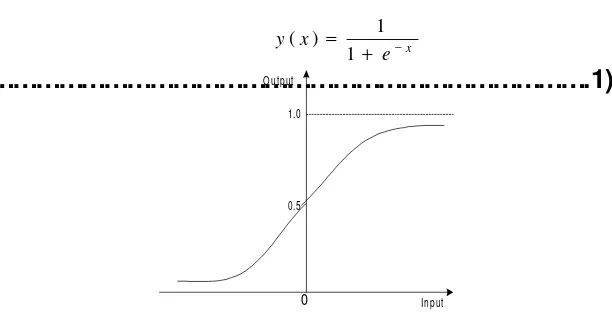
Node properties of a neural network is the transfer function to be
done corresponding to the activation level. The activation levels of
nodes can be discrete (e.g, 0 and 1) or continuous across a range (e.g.,
[0,1]) or unrestricted. This depends on the activation (transfer) function
chosen. If it is hard limiting function, then the activation levels are 0 (or
–1) and 1. For sigmoid function, the activation levels are limited to a
continuous range of real [0,1]. The sigmoid function F (Fu, 1994) is
formulated in equation 1, while Figure 2.3 illustrated the bonded value
of that function.
x
e x
y −
+ =
1 1 ) (
[image:42.612.152.458.568.725.2]……….1)
Figure 2.3. The sigmoid activation function (Fu, 1994) 1.0
0.5 O utput
The learning rule is one of the most important attributes to specify
for a neural network (Fu, 1994). The learning rule determines how to
adapt connection weights order to optimize the network performance. It
indicates how to calculate the weight adjustment during each training
cycle. The weight initialization scheme is specific to the particular
neural network model chosen. In many case, initial weights are just
randomized to small real numbers.
The basic performance of ANN is to learn the relation between
input and output, then to accommodate for getting consistent
responses. Efficient learning algorithms should be developed,
particularly for the network with multiple layers and large number of
interconnection. Computation is done by iterative learning procedures
to obtain an adequate weight value. Learning method is suited to the
ANN model and mathematical model. Methods of learning can be
categorized into supervised, reinforced and unsupervised. This
research chooses a supervised method that applies the
backpropagation algorithm for learning process.
2.2.2. Multi Layer Feedforward-Backpropagation
2.2.2.1. Backpropagation Model
Backpropagation is a learning algorithm using multilayer
feedforward network with a different transfer function in artificial
neuron. Backpropagation learning algorithm is usually implemented in
multi (three or more) layer neural network. This learning algorithm
output layer. The hidden layer only receive internal inputs (inputs from
other processing units) and hidden from outside world.
The backpropagation arises from the method in which corrections
are made to the weights (Patterson, 1996). During the learning phase,
input patterns are presented to the network in some sequences. Each
training pattern is propagated forward layer by layer until an output
pattern is computed. The computed output is then compared to a
desired value or target output and error value is determined. The errors
are used as inputs to feedback connections from which adjustments
are made to the synaptic weights layer by layer in back direction. The
backward linkages are used for the learning phase, whereas the
forward connections are used for both the learning and the operational
phase.
The processes inside the feedforward backpropagation algorithm
network are described in the Figure 2.4.
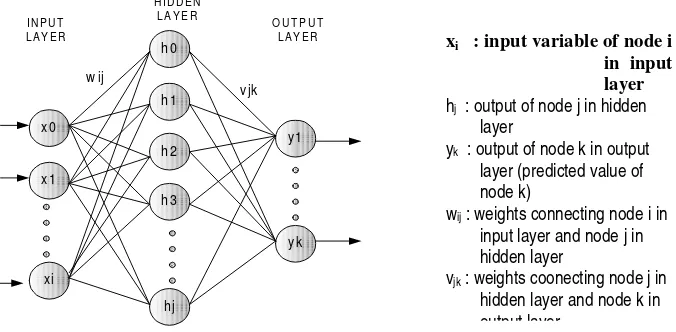
[image:44.612.174.512.479.645.2]2.2.2.2. Backpropagation Learning Algorithm
Figure 2.4. Backpropagation neural
xi : input variable of node i in input layer
hj : output of node j in hidden
layer
yk : output of node k in output
layer (predicted value of node k)
wij : weights connecting node i in
input layer and node j in hidden layer
vjk : weights coonecting node j in
hidden layer and node k in output layer. x 0 x 1 x i h 0 h 1 h 2 h 3 h j y1
IN P U T L A Y E R
H ID D E N L A Y E R
O U T P U T L A Y E R
yk w ij
In ‘the backpropagation learning algorithm’ the training instance
set for the network must be presented many times in order for the
interconnection weight between the neurons to settle into a state for
correct classification of input pattern. The basic learning algorithm of
back propagation modifies the interconnection weight on the network
so that signal error is minimum (closer to zero).
Figure 2.4 shows a backpropagation neural network with one
hidden layer and full interconnection. Refers to Patterson (1996), the
notations of network parameters are:
ij
v
: Weight connections between input layer unit i and hiddenlayer unit j
i = 1,2,…,N, j = 1,2,…,H
jk
w
: Weight connections between hidden layer unit j and outputlayer unit k j = 1,2,…,H, k = 1,2,…,M
p
x
: Input training pattern, p = 1,2,…Pp j
y
: Output hidden layer unit j for input pattern unitx
pp k
z
: Output from unit k of the output layer for input patternx
pp k
t
: Desire or target outputIn each hidden layer, the net input that represent the sum of input
nodes times weight can be computed as: ij i
i
j
w
x
H
=
Σ
andj jk j
k
v
h
I
=
Σ
, whereH
j is net input of input layer-hidden layer unit j,and Ik is the net input to unit k of the output layer, respectively.
a. Normalization of input data xi and target tk in form of (0, 1)
range
b. Randomize of weight wij and vjk using (–1, 1) value.
c. Initialize of thresholding unit activation, x0=1 and h0=1.
2. Activate of input layer-hidden layer units with:
i ijx w j
e
h
Σ+
=
1
1
………....… 2)
3. Activate of hidden layer-output layer units with:j jkh v k
e
y
Σ+
=
1
1
………. 3)4. To minimize error of weight, vjk must be adjusted. This
process is called ‘backward’ step. Adjustment of vjk is done by
computing error of the nodes in output layer, denotes
δ
kthenadjusts weight vjk:.
)
)(
1
(
k k kk
=
−
y
t
−
y
δ
... 4)
j k jk
jk
v
h
v
=
+
β
.
δ
.
... 5)
where: ββ is constant of momentum ,tk is prediction value.
5. Similar to step 4, the nodes can be backward stepped in
hidden layer to adjust wij:
jk k k j j
k
h
(
1
h
)
δ
.
v
τ
=
−
Σ
... 6)
i k ij
ij
w
x
6. Update all weight. Refining weight is needed when output has
significant difference from input. To minimize error, each layer
is refined using delta rule (Patterson, 1996):
j i
ij
h
w
=
α
.
δ
.
∆
... 8)
k j
jk
x
v
=
α
.
δ
.
∆
... 9)
where αα is learning speed constant
So, the refinement weight:
ij old
ij new
ij
w
w
w
=
+
∆
... 10)
jk old
jk new
jk
v
v
v
=
+
∆
... 11)
7. Return to step 2 and repeat each pattern p until the total error
has reached an acceptable level (iterative). Iteration process is
done to achieve the minimum error using the refinement
weight. The performance of neural network can be evaluated
based on the value of root mean square error (RMSE), using:
n t h
RMSError k k
2 ) ( − Σ =
……….. 12)
The trained neural network can be used to predict target (T) by
inputting values from input layer (X).
2.3. Land Suitability
Land evaluation is the process of assessing of land performance
when (the land is) used for specified purposes (FAO, 1985). The land is
appropriate and sustainable use of natural and human resources. Land
suitability represents a method of land evaluation.
Land suitability analysis estimates which areas are suitable or not suitable for certain development. The land suitability can be determined by using matching methods between land suitability criteria and land characteristics. The process of land suitability classification is the appraisal and grouping of specific areas of land in terms of their suitability for a defined use. The suitability is the aptitude of a given type of land to support a defined use.
To produce the land suitability, two concept of land evaluation are
known, i.e. physiographic approach and parametric approach.
Physiographic approach utilizes landform framework to identify the
natural land unit, while parametric approach divides the land following
the distinguish land value and its combination. Parametric approach is
more suitable for this research, due to all of parameters that are
quantized. In this study two categories are recognized: orders and
classes. The orders indicate whether or not given types of land are
suitable for the concerned land utilizations type and are expressed by
the symbols S and N (FAO, 1976):
S (suitable) : Land on which sustained use is expected to yield
benefits which justify the inputs, without
unacceptable risk of damage to land resources
N (not
suitable)
: Land whose qualities appear to preclude
sustainability for the considered land use
Classes reflect degrees of suitability within the order “suitable”.
S1 (highly
suitable)
: Land which has no significant or only minor
limitations to the sustained application of the given
land utilization
S2
(moderately
suitable)
: Land which has limitations that are moderately
severe for sustained application of the given land
utilization. The limitations will reduce productivity
or benefits and will increase the required inputs
S3
(marginally
suitable)
: Land which has severe limitations for sustained
application of the land utilization
Because it is based only on physical aspect of
suitability orders, there will be no differentiation
between N1 and N2. In this case, the ‘not suitability
’
of land for coastal aquaculture will be assumed as N
(not suitable).
N (not suitable)
: The limitations are so severe that they preclude the successful application of the given land utilization
2.4. Coastal-Aquaculture
2.4.1. Aquaculture System
Aquaculture is the farming of aquatic organisms, including fish,
molluscs, crustaceans and aquatic plants. The objectives of farming of
aquatic organism are to have control over their growth and propagation
or breeding by judicious rearing of these organisms. Rearing is
intended either increasing the quantity or improving the quality of
product, and make the process economically so that the farmers get
some profit.
(Scylla serrata). Shellfish is not true fish, it includes: crustaceans class
(shrimps, lobster, crab) and molluscs class (oyster, clam, mussel,
scallops, abalones, conch, squid). While Fin fish is true fish, includes:
mullets, milk fish, yellow-tail eel, pearlspot, red sea bream, grouper,
tilapia, plaice, salmon, pompano, etc (Bose, 1991)
The aquaculture system is distinguished to the level of
intervention applied. These three culture techniques can be applied to
increase the productivity of aquaculture system, i.e.: extensive,
semi-intensive and semi-intensive (Furey and Pitman, 2003). Extensive system
applied with low cost involved and minimum requirement of
management. The simplest form of extensive system is the natural
system, where it only utilizes the natural requirement. Types of
extensive system are low input, low capital and operating cost and low
level of management. Another aquaculture system such as semi
intensive and intensive is carried out by higher level of
intervention-applied, includes: input, cost, management aspects.
2.4.2. Cultivable Species
Based on the brackish water environment, these tiger shrimps and
crabs species survive with wide range of temperature and salinity. The
most consideration is economics value, which represents the mean
commodity of fish (or shell fish) commerce. Requirement of shrimp and
crab culture should involve some physical aspect such as: soil
characteristics, topographical, climate, hydrology and water quality
(Hardjowigeno et al, 1996). Kapetsky and Nath (1997) added and enrich
those criteria with support and input aspects, risk and natural
indicators. Both researchers use the similar criteria, but the second
• Shrimps. Shrimps or prawns represent one of food source
containing a high protein. Tiger shrimp (Penaeus monodon)
represent the important export commodity besides the petroleum.
Consumer request to mean prawn go up 11,5% per year (
Ministry
of Research and Technology
, 2005), therefore, this commodityrepresents the most species being cultured in Indonesia. The body
can attain the maximum size of 27 cm in length and 130 gram in
weight, however, the commercial size being above 12 to 13 cm in
body length and 20 gram in body weight. Culture of tiger shrimp in
brackish water very much depend on the technology aquaculture
system to be applied. The suitable water salinity for shrimp is 12 to
20 ppt.
• Crabs. The mangrove crabs (Scylla serrata), have long been an
incidental product of brackish water pond culture, and sometimes
even deliberately stocked in fishponds. The market of this
commodity is increasing, both for domestic and export needs. This
matter can not fulfill for natural arresting from brackish water only;
however, it is a challenge to meet the market through farming
system (Ministry of Fisheries and Marine, 2003). Commercial size
of crab body is 10 cm in length. Ponds of cultivated crab should be
0.8 to 1.0 meters deep, and the suitable water salinity is 15 – 30
ppt. Texture of pond soils is silty loam or sandy loam. The
preferred tidal difference for crab live is ranging from 1.5 – 2.0
Poly-culture can be applied in extensive aquaculture system, which
utilizes the natural feed of brackish water environment.
2.5. Previous Related-Researches
Site selection for development of shrimp and mud crab culture
have been assessed by Salam and Ross (1997), in Southwestern of
Bangladesh. Their models were developed using remote sensing and
GIS tool. Remote sensing data was used for obtaining water body, GIS
database incorporated the existing environmental layer such waters,
soil, land use, water temperature, rain fall, salinity and pH.
Infrastructure is also included, such as roads, market and processing
plant. From those factors, they developed sub model by defining
suitability classes: very suitable, moderately suitable, marginally
suitable and presently not suitable. Then, multi criteria evaluation was
applied to determine the weight of each parameter to produce the
suitable sites for shrimp and crab farming.
The use of remote sensing technique for shrimp farming site
suitable selection was conducted in coastal area of Bangladesh (Islam
et al, 1999). They used various types of data, including: different
satellite data, thematic map, field measured and other published
information. Six major works are construction of fisheries database,
test of GIS suitable site shrimp farming, implementation of model,
application and analysis of output model, socioeconomic assessment
of the site, and analysis of expansion impact and risk. Fishery
resources have been successfully analyzed in the areas using GIS
modeling of suitable site selection for shrimp farming.
Easson and Barr (1996) studied the integration of ANN and GIS to
of these two technologies has been proven in recent research and has
potential applications to other forms of geological and hydrological
interpretations.
Land evaluation expert systems, which is an automated land
evaluation system with the transformation of land suitability
classification expertise, following the FAO framework, into trained ANN
has been developed by Bandibas (1998). An error back-propagation
ANNs model was used. The trained ANNs were stored in a database,
representing the knowledge base. This knowledge base was used in a
land system successfully to determine the best land suitability class in
III. RESEARCH METHODOLOGY
3.1. Site Description
Administratively,Mahakam Delta is governed by Kutai Kertanegara
Regency, East Kalimantan Province - Indonesia. This area covers more
than 2000 km squares. Geographically, it is located between 117.320 –
117.610 E, and 0.310-0.920 S. This area represents the downstream of
Mahakam Rivers while upper course is in the Center of Borneo Island,
as shown in Figure 3.1.
3.2. Time and Location
The research was carried out in two separate locations.
Preparation, field data computation, application of data processing and
report writing were conducted in Bogor, West Java starting from
March-August, 2005. Meanwhile, field data acquisition was acquired in
Mahakam Delta and the Government of Kutai Kartanegara Regency -
East Kalimantan, from July 24 – 30, 2005.
Mahakam Delta
3.3. Data and Equipments
3.3.1. Data Acquisition
The main spatial data of Mahakam Delta to be implemented for
supporting the research objectives include soil characteristics, water
characteristics, climate characteristics, land use/land cover and spatial
plan. Another aspects involved in determining the site suitability are
rivers and risk factor. Supporting topographical and hydrological
aspects, in this research are very important. However, it is difficult to
distinguish the altitude on map in this area. This is because the area
being studied is tidal flat, where altitudes ranges from 0 – 3 meters
above the mean sea level. Also, it is difficult to determine which area is
covered by tidal zone due to the limitation of 1:50000 map scales, where
contour interval is drawn at 12.5 meter. Generally, the intertidal zone
range of 2-3 meters above the mean sea level and it amplitudes 1.1 - 2.1
meters is suitable for shrimp ponds development (Purnomo, 1992).
Based on the tidal requirement, Mahakam Deltas are inclusive of area
that are suitable for brackish water farming where the ranges of tidal
are 2.5 meters.
Most of the data for processing were secondary data, which were
taken from previous study and part of them were taken from field
survey. Secondary data include soil texture, soil drainage, land use,
spatial plan, gas pipelines and rivers map. That map represents
features being necessary to GIS processes.
observed in the field using ‘water quality checker’ instrument,
including:
• Salinity. Salinity represents the total concentration of dissolved
salt in the water that expressed in mg/l or ppt. Intertidal is an area
that represent the mixture of fresh and saline water that perform
the brackish water. Salinity of intertidal may differ between low and
high tides. Previous salinity map was utilized, and the new
observation is conducted to obtain the salinity on point data.
Measurement was held by points on rivers, ponds or channel and
[image:56.612.151.495.173.468.2]offshore.
• Dissolved Oxygen (DO). DO is one of water variables that is
significant for aquaculture. Dissolved of oxygen in the water was
influenced by other variable such as temperature, salinity, organic
matter and brightness.
• pH. Grade of acidity represents the alkaline intensity of hydrogen
ion of liquid. pH is very significant for brackish water aquaculture,
so that its concentration should be well balanced to take care of
cultured species
Referring to the suitability to be defined, then shrimp and crab
yield of pond in the field were recorded from fisherman. However, these
data of ponds-harvest were taken from previous report that studies the
productivity of ponds in Mahakam, it includes: shrimp, milkfish and
crabs (Total Indonesia, 2005b). The particular yield of shrimp and crab
in kg/ha/year of ponds will be used as comparator of the suitability map
which will be produced by GIS model.
3.3.2. Field Data Processing
Some of data obtained from field should be processed so that it
will be ready for next GIS and ANN processing, and these include water
salinity, water dissolved oxygen, water pH and rainfall intensity. Water
characteristics such as salinity, pH and dissolved oxygen need to be
computed and interpolated before drawn on reference map. Also, the
rainfall data in this area of 1994-2004 periods are necessary to compute
for getting the annual rainfall, and then interpolate the intensity to make
point data represents the matured data of field that observed using
water checker tool. For interpolation processes of all observed field
data, the kriging features in GIS functionalities were applied to create
isohyets map, including salinity, dissolved oxygen, pH of water
characteristic and the rainfall intensity. The thematic maps, which were