DOI: 10.12928/TELKOMNIKA.v14i1.3298 29
Power Quality Analysis of Integration Photovoltaic
Generator to Three Phase Grid under Variable Solar
Irradiance Level
Amirullah*1,4, Ontoseno Penangsang2, Adi Soeprijanto3
1,2,3
Electrical Engineering Department, Industrial Technology Faculty, Kampus Institut Teknologi Sepuluh Nopember (ITS) Sukolilo Surabaya Indonesia Jl. Arief Rahman Hakim Surabaya Indonesia 60111 Ph/Fax: +62-31-594 7302/+62-31-593 1237
4
Electrical Engineering Study Program, Engineering Faculty, University of Bhayangkara Surabaya
Jl. Ahmad Yani 114 Surabaya Indonesia, Ph/Fax: +62-31-8285602/+62-31-8285601 *Corresponding author, e-mail: [email protected],4, [email protected],4
[email protected], [email protected]
Abstract
Objective of research is to analyze the influence of solar irradiance and integration of photovoltaic (PV) generator to power quality of three phase grid on the constant temperature and load, based on changes in some level of integration of PV generator. Power quality aspects studied are fluctuation or changing, and harmonics of voltage and current on eight scenarios PV generator connected to three-phase grid, using passive filter circuit model double band pass (double tuned). Research shows that voltage and current values on the PCC bus before use double tuned passive filter on the condition only connect single generator is still stable. However, if the PV generator connected to the three phase grid, amounted to more than one generation, voltage and current grid becomes unstable (fluctuation). At the level of solar radiation remains, the greater number of PV generators connected to the grid three-phase, then the values of voltage and current THD increases. At the level of solar irradiance increases, average THD of voltage and current grid also increased. Avarage THD of voltage and current grid is reduced after double tuned passive filter installed. Therefore, double tuned passive filter able to improve profile of voltage and current THD grid as a result of the integration of a number of PV power generators in three-phase grid according IEEE Standard 519-1992.
Keywords: Power Quality, Total Harmonic Distortion, Photovoltaic Generator, Grid, Irradiance
Copyright © 2016 Universitas Ahmad Dahlan. All rights reserved.
1. Introduction
One important aspect of the integration of photovoltaic (PV) generator as part of distributed generation is the power quality generated from their operation for example voltage unbalance (fluctuation), voltage and current harmonics. A study to model and simulate residential grid connected solar photovoltaic system has been discussed. Mathematical modeling and simulation of PV generation systems has been conducted to determine the I-V, P-I, P-V characteristics [1]. Research of design and implementation of PV-based three phase four-wire series hybrid active power filter for power quality improvement have been conducted. This paper proposes a PV based three phase four wire series hybrid active power filter arranged by series active power filter and an LC shunt passive filter. The proposed model eliminates both the current and voltage harmonics and compensates reactive power, neutral current, and voltage interruption [2]. A study of power quality analysis of photovoltaic generation integrated in user grid. This paper analyzes impact of grid-connected photovoltaic power plant on harmonic in the power quality aspect of distribution network [3]. The weakness of three studies are number of PV generator used only a single PV generation and connected to single phase grid, so that current and voltage harmonics generated due to the presence of the inverter in PV generating system is not very significant.
research is to analyze the influence of solar irradiance and integration of PV generator to power quality of three phase grid on the constant temperature and load, based on changes in some level of integration of PV generator. Power quality aspects studied are fluctuation or changing, and harmonics of voltage and current on eight scenarios PV generator connected to three-phase grid. The rest of this paper is organized as follow. Section 2 shows proposed model of single and three PV generator system connected to three-phase grid, power quality and harmonic, photovoltaic system, mathematical model of PV cell and panel, and shunt passive filter. Section 3 describes influence of solar irradiance and integration of PV generator to voltage, current, voltage and current Total Harmonic Distortion (THD) of three phase grid on the constant temperature and load, based on changes in some level of integration of PV generator. In this section, example cases studied are presented and the results are verified with those of Matlab/Simulink. Finally, the paper in concluded in Section 4.
2. Proposed Model of PV Generator System Connected to Three Phase Grid
Figure 1 shows a model of a single PV power system connected three phase grid [6]. The series of DC/DC converter consists of a boost converter circuit that functions to raise the voltage of the DC output of the PV generator. DC output voltage of the boost converter circuit is then converted by the DC/AC inverter into a three-phase AC voltage to the three-phase grid. Single PV generator model is then used as a reference to create a model for many (multi) PV generators connected to the grid via a three-phase distribution transformer (Figure 1). The study used three groups of models of PV generators with the active power of 100 kW each. Besides connecting the three-phase grid, the PV generator is also connected to the three groups of three phase load with active power 20 kW respectively.
The objective of research is to analyze the influence of solar irradiance and integration of photovoltaic (PV) generator to power quality of three phase grid on the constant temperature and load, based on changes in some level of integration of PV generator. Power quality aspects studied is the fluctuation, and harmonics of voltage and current on eight scenarios PV generator connected to three phase grid (a) before and (b) after double tuned passive filter installed as follow four conditions respectively: (i) irradiance 400 W/m2, (ii) irradiance 600 W/m2, (iii) irradiance 800 W/m2, and (iv) irradiance 1000 W/m2 on the condition 1, 2, and 3 of model PV generator connected to three phase grid. The model of passive filter circuit is a double band pass (double tuned). The circuit model simulations conducted to determine the voltage and current curves of three phase grid. There are two scenarios simulations done that before and after the double tuned passive filter installed. Wherein each consisting of four scenarios for a total of eight scenarios integration of PV generators. The next stage is to determine the value of voltage and current THD on each scenario grid. The final step is to compare the value of voltage, current, voltage and current THD grid on point common coupling (PCC) bus refers to the IEEE Standard 519-1992. This standart is the basis for determining level of power quality at the eight scenarios radiation levels and integration of grid connected PV generator model three phase. Simulation and analysis of this research use Matlab/Simulink.
Figure 2. Proposed model of three PV generator system connected to three phase grid
2.1. Power Quality and Harmonic
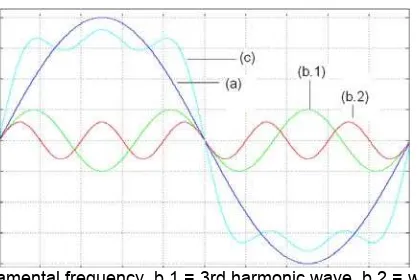
Power quality means the quality of voltage and current. Voltage and current quality is determined based on the value or the tolerance limit of the equipment used. In general, current and voltage wave form of the pure sinusoidal waveform. One problem that arises is the wave of current and voltage is not sinusoidal or defects caused by the emergence of harmonics generated by the power system [7]. The term used to describe deviations harmonics sinusoidal wave associated with the current and voltage of different amplitude and frequency. Changes in current and voltage waveforms caused by harmonics will disrupt the electrical distribution system and lower the quality of the system power. Figure 1 shows the signal waveform distortion due to harmonics. Harmonic distortion explained through several key parameters to describe the effects of harmonics on power system components. The first parameter is Total Harmonic Distortion (THD). THD is the ratio of the rms value of harmonic components to the rms value of the fundamental component and is commonly expressed in percent (%). This index is used to measure deviations periodic waveforms containing harmonics of a perfect sine wave [7]. On a perfect sine wave THD value is zero percent. THDV value is expressed in Equation 1.
a = wave at the fundamental frequency, b.1 = 3rd harmonic wave, b.2 = wave harmonics 5th, c. = Distorted Wave
Figure 3. Distorted Wave resulted by Harmonics.
% 100 1
2 2
U U THD
k
n n
V (1)
Description: Un = harmonic component; U1 = the fundamental component; K = maximum
harmonic components.
The second parameter is the Individual Harmonic Distortion (IHD) is the ratio of rms value of individual harmonics to rms value of the fundamental component. The third parameter is the Total Demand Distortion (TDD) or THDI is amount of current harmonic distortion and
the PCC, calculated from the average current of the maximum load of 12 months earlier. THD value of the maximum allowable for each country is different depending on the standard used. THD standards most often used in electric power system is the IEEE Standard 519-1992 [8]. There are two criteria that are used in the analysis of harmonic distortion that limits voltage distortion and current distortion limits.
2.2. Photovoltaic System
The working principle of PV panel is when sunlight reaches the surface of the solar panel, then the photons with a certain energy level will be absorbed, thus freeing electrons from their atomic bonds and the flow of electric current. The solar panels generate the current that varies depending on the voltage of it. Current-voltage characteristics show the relationship. When the voltage of the solar panel is equal to zero, short circuit current (ISC), which is
proportional to the amount of solar radiation on the solar panel can be measured. ISC value rises
with increasing temperature, although the standard temperature recorded for the short circuit current is 250 C. If the current solar panel is equal to zero, the solar panel is described as an open circuit. The voltage on open circuit or open-circuit voltage (VOC), depending on the amount
of solar radiation. This dependence is logarithmic, and decline more rapidly with increased temperatures exceeding the speed increase in Isc. The maximum power of solar panels and
solar panel efficiency will decrease with increasing temperature. Solar panels, increasing the temperature of 250C resulted in a decrease of about 10% power. Figure 4 shows the curve of the PV panel karakteristisk [9].
(a) I-V Curve on fixed temperature and irradiance
change
(b) I-V curve on fixed irradiance and temperature change
(c) P-V curve on temperature change
Figure 4. Characteristic Curve of Panel PV (Tipe MSX-60)
2.3. Mathematical Model of PV Cell and Panel
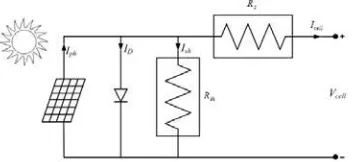
PV cell equivalent circuit shown in Figure 5 [6] consists of a power supply and a diode. Current photo (Iph) depending on solar radiation (G), and temperature (T) environment.
The conditions described in the Equation 3. Iph (Tref) is the photo stream at a nominal
temperature Tref. On the other hand, Equation 4 gives the formula of photo current at a nominal
temperature K0 is a constant that is expressed in Equation 5. Gref and Isc respectively nominal
radiation provided by the factory short-circuit current. This equation refers to Figure 2 for a single PV cell [6].
Taking into account that the environment temperature is set at a certain nominal value, then the next PV flow only depends on solar irradiace expressed in Equation 6.
)
Characteristics of diode current (ID) is expressed in Equation 7, where the value of saturation
current IO is a diode, where VT represents the thermal voltage.
Furthermore, by using the Kirchoff Law, shunt current Ish is defined in the following
equation:
By calculating Equation 3 and 8, and applying current Kirchoff's Law, I-V characteristics PV shown in Equation 9.
sh
2.4. Shunt Passive Filter
Passive filter consists of passive elements such as resistors, capacitors and inductors. This filter is permanent and once installed they become part of the network and need to be redesigned to obtain different filter frequencies. Passive filter is still considered the best in the network system of three-phase four-wire. The majority of them are low-pass filter that is tuned to the desired frequency. Shunt filter using passive components and offer better harmonics reduction, especially in the harmonic 3, 5, and 7. Some models include a passive filter are band pass filter (single atau double tuned), high pass filters (first, second, third-order or C-type), and composite filter [10]. Figure 6 shows models of filter [11].
Tabel 1. Simulation Parameter
Equipment Parameters Value
PV Generator
Length of Low Voltage Distribution Line DC Link Kapasitor PWM Generator For each PV Generator Double Tuned Filter
Table 2. Nominal of phase and average voltage harmonic (THDV) grid
No. Irradiance
(W/m2) PV Integration
Phase Voltage (V) THDV THDV
Avarage (%) A B C A B C
Before using Double Tuned Passive Fiter
1 400 PV1 220 220 220 0.54 0.51 0.49 0.52
After using Double Tuned Passive Fiter
Table 3. Nominal of phase and average current harmonic (THDI) grid on three models of
integration of PV generators connected to the three phase grid
No. Irradiance
(W/m2) PV Integration
Phase Current (A) THDI THDI
Avarage (%) A B C A B C
Before using Passive Double Tuned
1 400 PV1 6.8 6.8 6.8 0.07 0.08 0.06 0.07
PV1 + PV2 6.8 6.8 6.8 0.24 0.24 0.35 0.28
PV1 + PV2 + PV3 6.8 8.6 6.8 2.10 1.27 1.69 1.69
2 600 PV1 6.8 6.8 6.8 0.10 0.12 0.10 0.11
PV1 + PV2 6.8 6.8 6.8 0.35 0.24 0.39 0.33
PV1 + PV2 + PV3 7.1 9.2 7.1 2.24 1.48 1.83 1.86
3 800 PV1 6.8 6.8 6.8 0.13 0.13 0.13 0.13
PV1 + PV2 6.8 6.8 6.8 0.44 0.30 0.40 0.38
PV1 + PV2 + PV3 7.1 9.2 7.1 2.28 1.56 1.93 1.93
4 1000 PV1 6.8 6.8 6.8 0.12 0.13 0.14 0.13
PV1 + PV2 6.8 6.8 6.8 0.39 0.32 0.41 0.38
PV1 + PV2 + PV3 7.1 9.2 7.1 2.31 1.61 1.85 1.93
After Using Filter Pasif Double Tuned
1 400 PV1 6.8 6.8 6.8 0.01 0.00 0.00 0.00
PV1 + PV2 6.8 6.8 6.8 0.01 0.01 0.01 0.01
PV1 + PV2 + PV3 7.5 7.5 7.5 0.03 0.02 0.03 0.03
2 600 PV1 6.8 6.8 6.8 0.01 0.01 0.01 0.01
PV1 + PV2 6.8 6.8 6.8 0.01 0.01 0.01 0.01
PV1 + PV2 + PV3 7.5 7.5 7.5 0.04 0.03 0.04 0.04
3 800 PV1 6.8 6.8 6.8 0.01 0.01 0.01 0.01
PV1 + PV2 6.8 6.8 6.8 0.01 0.02 0.02 0.02
PV1 + PV2 + PV3 7.5 7.5 7.5 0.05 0.04 0.06 0.05
4 1000 PV1 6.8 6.8 6.8 0.01 0.01 0.01 0.01
PV1 + PV2 6.8 6.8 6.8 0.01 0.02 0.02 0.02
PV1 + PV2 + PV3 7.5 7.5 7.5 0.07 0.04 0.05 0.05
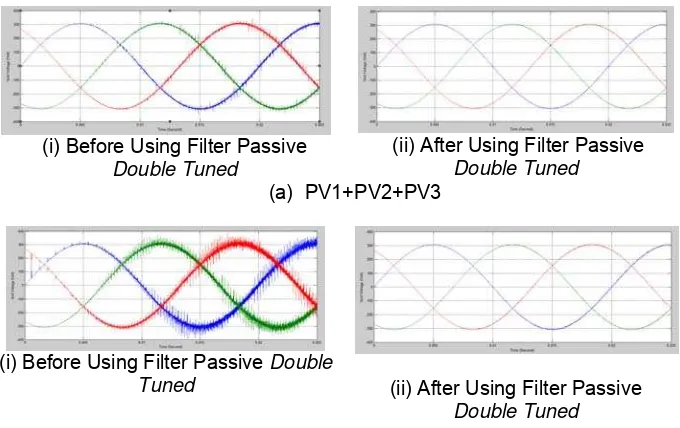
Figure 7 shows the curve of grid voltage on two models of integration of PV generators connected to the grid three-phase (solar radiation of 1000 W / m2) on the PCC bus.
(i) Before Using Filter Passive
Double Tuned
(ii) After Using Filter Passive
Double Tuned
(a) PV1+PV2+PV3
(i) Before Using Filter Passive Double
Tuned (ii) After Using Filter Passive Double Tuned
Figure 7. Simulation results grid voltage on integration of two models of three-phase grid connected PV under solar irradiance level of 1000 W/m2
Figure 8 shows the spectrum of THDV grid at phase A in two models of integration of PV
(i) Before Filter Passive Double Tuned (ii) After Using Filter Passive
Double Tuned
(b) PV1+PV2+PV3
(i) Before Filter Passive Double Tuned (ii ) After Using Filter Passive
Double Tuned
Figure 8. Harmonic spectrum of phase A grid voltage on two models of integration of PV connected grid under solar irradiation of 1000 W/m2
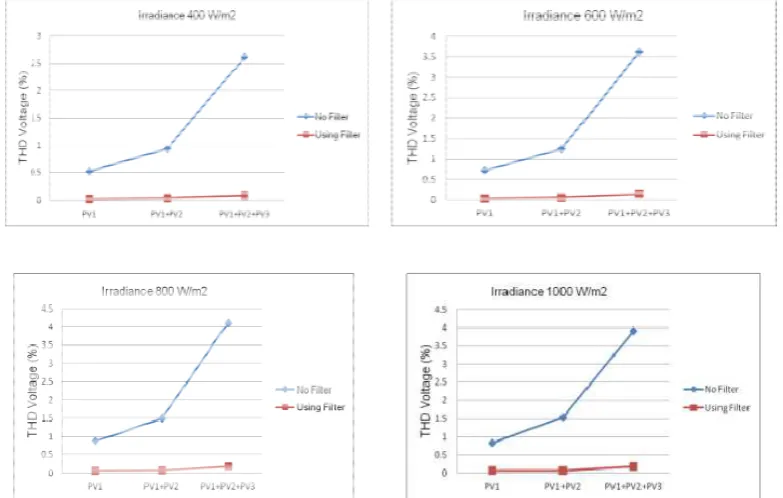
Figure 9 shows curve of average THDV on three models of integration of generation PV
and four levels of solar irradiance connected to the three-phase grid on PCC bus.
Figure 9. Avarage harmonic of voltage grid in three models of integration PV connected to three phase grid under solar irradiance level of 400 to 1000 W/m2
filter, the largest THD average of grid voltage is generated on the condition of all PV generators connected to the three phase grid (PV1 + PV2 + PV3) and the irradiance level of 800 W/m2 at 4.11%. The smallest value of average grid voltage THD is produced on the condition of only single PV generators connected to the grid three-phase (PV1) and the radiation level of 400 W/m2 at 0.52%. On the condition of using double tuned passive filter, the largest THD average of grid voltage is generated on the condition of all PV generators connected to the three phase grid (PV1 + PV2 + PV3) and the irradiance level of 800 W/m2 at 0.19%. The smallest average of grid voltage THD produced on the condition of the PV generators connected to the grid three-phase (PV1) and the radiation level of 400 W / m2 of 0.03%. Figure 7 and 8 shows that at the level of solar irradiance remains, the greater number of PV generators connected to three-phase grid, then the greater the value of the voltage THD. Figure 9 also shows that the level of solar irradiace increases, THD average of voltage grid will also increase. THD average of grid voltage is reduced after double tuned passive filter installed.
Table 3 shows that the current value of grid before use double tuned passive filter on the condition only connect one and two generators (PV1 and PV1+PV1) was stable (6.8 Volt). However, if the PV generator connected to the three phase grid is three generators (PV1+PV2+PV3), the current grid in Bus PCC appears unbalanced currents between 6.8 up to 9.2 Ampere. After using double tuned passive filter, grid current value on the condition only connect one and two generators (PV1 and PV1+ PV2 ) was stable (6.8 Ampere). However, if all PV generators connected to the three phase grid (PV1 + PV2 + PV3), the current grid PCC bus increase to 7.5 Ampere or 10.29%. Without double tuned passive filter, the largest average THD current grid is generated by the condition of three PV generators connected to the grid three-phase (PV1+PV2+PV3) and the irradiance level of 800 W/m2 at 1.93%. The smallest THD avarage of grid current is produced by only single PV generators connected to three phase grid (PV1) and irradiance level of 400 W/m2 at 0.07%. On the condition of using double tuned passive filter, the largest of THD average grid voltage is generated of all PV generators connected to three phase grid (PV1 + PV2 + PV3) and irradiance level of 800 W/m2 of 0.05%. The smallest average THD of grid current is produced on the condition of the PV generators connected to the grid three-phase (PV1) and the radiation level of 400 W/m2 at 0.00%.
4. Conclusion
The nominal of voltage and current on the PCC bus of three phase grid before use double tuned passive filter on the condition only connect single generator (PV1) is still stable. However, if the PV generator connected to the three phase grid, amounted to more than one generation (PV1+PV2 and PV1+PV2+ PV3), voltage and current grid becomes unstable (fluctuation). At the level of solar radiation remains, the greater number of PV generators connected to the three phase grid, then the nominal of voltage and current THD also increase. At the level of solar irradiance increases, average THD of voltage and current grid also increased. Avarage THD of voltage and current grid is reduced after double tuned passive filter installed in three phase grid. Therefore double tuned passive filter able to improve profile of voltage and current THD grid, as a result of the integration of a number of PV power generators in three-phase grid according with IEEE Standard 519-1992.
Acknowledgements
Authors would like to acknowledge to Ministry of Research, Technology, and Higher Education, Republic of Indonesia, for financial support by BPP-DN Scholarships to pursue Doktoral Program in Electrical Engineering ITS Surabaya.
References
[1] L Siva Chaitanya Kumar, K Padma. Matlab/Simulink Based Modelling and Simulation of Residential Grid Connected Solar Photovoltaic System. International Journal of Engineering Research and Technology (IJERT). 2014; 3(3).
Generation to Power Quality in Industrial and Residential Customers Distribution Network.
International Seminar Intelligent Technology and Its Application (ISITIA) ITS Surabaya. 2015.
[6] AS Abu Hasim, Z Ibrahim, MH Nizam Talib, SN Mat Isa, J Mat Lazi, N Mohd Yakop. Photovoltaic System Connected to Three Phase Grid Connected System Incorporating With Active Filter.
Australian Journal of Basic and Applied Sciences. 2012; 6(7): 345-358.
[7] Arrilaga, Jos, Watson, Neville. Power System Harmonics. Chicester: John Willey and Sons. 2003. [8] Thomas M Bloming PE, Daniel J Carnovale PE. Application of IEEE Standar 519-1992 Harmonic
Limits. The 2005 IEEE IAS Pulp and Paper Industry Conf. in Appleton. WI.
[9] Francisco M González-Longatt. Model of Photovoltaic Module in Matlab™. 2DO CONGRESO IBEROAMERICANO DE ESTUDIANTES DE INGENIERÍA ELÉCTRICA, ELECTRÓNICA Y COMPUTACIÓN (II CIBELEC 2005). 2005.
[10] Mouna Tali, Abdellatif Obbadi, Abdelkrim Elfajri, Youssef Errami. Passive Filter for Harmonics Migitation In Standalone PV System for Non Linier Load. Laboratory: Electronics, Instrumentation and Energy Team: Exploitation and Processing of Renewable Energy, Faculty of Science University Chouaib Doukalli Department of Physics Route Ben Maachou, 24000 El-Jadida, Marocco, IRSEC 2014.