© 2009, INSInet Publication
Lean Behavior in Implementing Lean Process Management
A.P. Puvanasvaran, M.H.M.A. Megat, S.H.Tang, Muhamad, M.R, A.M.S. Hamouda
1 2 2 1 3
Faculty of Manufacturing Engineering, University Technical Malaysia, Karung Berkunci 1200, 1
Ayer Keroh, 75450 Melaka, Malaysia
Department of Manufacturing Engineering, University Putra Malaysia, 43400 Serdang, Selangor, 2
Malaysia
Mechanical and Industrial Systems Engineering, Qatar University, Doha, Qatar. 3
Abstract: Lean is one of the popular concept has been practiced in most company. However, there are
a lot of companies who implement lean are not realized whether lean level of company is improve or relegate .Thus, it is important to inspect the lean result after implementation of lean. So, this study presents to make the result comparison for lean behavior after implement lean for one year thru People development system which improves problem solving capabilities of people in eliminating wastages. Furthermore, the importance of problem solving capabilities of people in implementing lean process management also will be discussed. The survey was conduct in an aero composite manufacturer kitting department. Self-administered questionnaire has been selected to be the survey instrument. These questionnaires were distributed to 45 employees work in the kitting department. Results of feedback are collected and analyzed by using the Statistical Package for Social Science (SPSS) software version 13. The outputs of the analysis were in the form of index values, percentages and hypothesis testing.The result showed the improvement on lean behavior with the help of people development system implementation which enhance the people capabilities in eliminating wastages. These are supported by comparing the survey results on lean behavior for beginning and end of the year with the monitoring of real life data on the case study.
Key w ords: Lean Behavior, Lean Process M anagement, People Development System, Aerospace Company
INTRODUCTION
Lean is a philosophy of manufacturing that incorporates a collection of tools and technique into the business processes to optimize time, human resources, assets, and productivity, while improving the quality level of products and services to their customers Ronald, [18 ]. Although a lot of companies started implementing lean concept, according to Bhasin and Burcher [5 ], only 10 percent or less of the companies succeed in implementing lean manufacturing practices. Even though number of lean tools, techniques and techno lo gies available to improve operational performance is growing rapidly, however a few companies that put effort to use them failed to produce significant results.
One of the major reasons for unsuccessful implementing lean manufacturing is the typical behaviors exhibited by people in the workplace, which are known to be deficient trust and gain commitment. Orr [1 7 ]. stated that the term “Lean” manufacturing seems to have forgotten the debate on human motivation, and has focused on techniques, where the emphasis has been on deploying new methods, rather than understanding how work is organized and lead.
The practice of lean behavior is shown to be an essential element for producing healthy work environments that can lead to economic lean produces Emiliani, [1 0 ]. Emiliani and Stec . stated lean behavior[9 ]
practices must apply all the lean principles where most companies failed to apply all the lean principles together to get significance result. In order for the business to enjoy the full benefits of lean, it is essential for the right behavior to exist amongst the organization’s employees Sanjay and Peter, [1 9 ]. Implementation lean is a long journey process and not easy implemented. To fully benefit the company for Lean implementation, both the concept and techniques should be considered. Lean behaviors typically are essential factor should be assessed for a successful and complete implementation.
In this paper, the Lean Behaviour at an aerospace environment are evaluated to assess the success of Lean implementation thru a year. The specific objectives of this study are to compare the result lean after implement lean process management after one year and identify how the problem solving capability to make the improvement of the lean behavior of kitting department.
Corresponding Auhtor:A.P. Puvanasvaran, Faculty of Manufacturing Engineering, University Technical Malaysia,
The result will determine the main factor influence for the leanness of studied cased. It will make the company more understand; which is most important part in lean to increase the problem solving of employees? W hich part is not done well for increase the problem solving capabilities? How important of problem solving cap ab ilities? After that, the organization is able to improve and sustain the lean manufacturing. Besides that, the problem solving capabilities of employees will help the company to overcome the obstacle; it can let company become an energetic organization. For the long term, it will be a strongly weapon for company can competitive at international.
Lean Behavior: Lean behavior is defined as behaviors
that add or create value. It is the minimization of waste associated with arbitrary or contradictory thought and actions that leads to defensive behavior, ineffective relationship, poor co-operation, and negative attitudes Emiliani, [10 ]. According to case study on M otorola, variables impact on lean implementation which is m anagem ent sup p o rt and communication. F o r management support, top management should not only demonstrate commitment and leadership, it must also work to create interest in the implementation and communicate the change to everyone within the organization.
Comm [7 ]. states that five best practiced components must present in order to apply lean. The five best practiced components are environment change, leadership, culture, employee empowerment, and communication. The management is required to have these lean behaviors which will influence the employees to practice the five components.
Orr [1 7 ]. stated that leadership is the fundamental aspect in engaging this different approach in thinking. Leaders are not necessarily top and senior management. Leaders are employees with influence on the work, at whatever level of seniority and responsibility. A leadership must have nine lean behaviors. The nine lean behaviors are teaches and engages workgroups, Respect For people, Process Focus, Support and recognition, Lead by example, Deploy policy and objectives, Commitment to standards, Understand lean vision and principles and Support the change process. M eanwhile, there are other findings on factors that act as barrier for implementing lean concept. Emiliani [1 0 ]. stated four primary causes that management lack
influence over employees; the four components are the barrier for the commitment of whole employees to implement lean concept. The four components are Trust, Communication, Processes and Environment.
Even a case study was conducted by O'hEocha [1 6 ]. on Cooke Brother Ltd manufacturing company about the influence of employee’s attitudes on the use of 5S which is one of the lean tools for improvement environment management. After the company applies the lean tool in their company, employees were asked to identify the potential issues that may act as barriers to effective implementation. A survey was done by interviewing on the top management, middle management and shop floor. The top management barrier to implement the tool related to issues of communication and power. T here were concerns that middle managers and supervisors may feel threatened by the perceived loss of control as shop floor staffs gain more power to use initiatives and make certain changes without consultation with line managers. Even they felt that there were difficulties when it came to making decisions regarding throwing away certain pieces of equipment and machinery that are very old, do not work and take up valuable space.
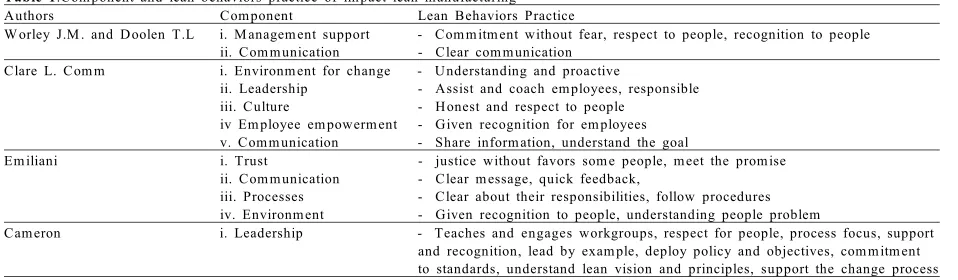
M iddle management representatives commented that the 5Ss started off well but dwindled in certain areas. It was because they lost interest and it fell down on custom and practice/self-discipline. They also felt that they should have more power to make decisions relating to their positions. Shop floor felt that some employees had attitude problems, and put minimum effort into their jobs and were not bothered to use or implement the 5Ss, while others were actively involved. Besides, they also comment that their initiative was sometimes held back by their line managers. It was felt that certain line managers were fearful of their subordinates shining and potentially threatening their position. As a result, they did minimum and took no interest in the initiatives of 5S that were likely to be protected by their line managers. From the survey, it was clear to show that the management behavior is the important barrier to implement the lean tool. In Table 1, lean behaviors practices of impact lean manufacturing are highlighted.
Background of Study: The Company where the case
study was conducted was incorporated on 16th August 1994. Currently, numbers of employees are 1155 person. The nature of business for this company is to manufacture composites components for aero and non-aero structures. The name of this company is changed to ABC in terms of confidential issues.
T able 1.C om ponent and lean behaviors practice of im pact lean m anufacturing
Authors C om ponent Lean Behaviors Practice
W orley J.M . and D oolen T.L i. M anagem ent support - C om m itm ent without fear, respect to people, recognition to people
iii. Processes - C lear about their responsibilities, follow procedures
iv. Environm ent - Given recognition to people, understanding people problem
C am eron i. Leadership - Teaches and engages workgroups, respect for people, process focus, support
and recognition, lead by exam ple, deploy policy and objectives, com m itm ent to standards, understand lean vision and principles, support the change process
The objective of the establishment of ABC is to become the manufacturing arm for ABC’s work cluster. ABC created the work cluster with the aim to provide design, manufacturing and aircraft production services to relevant industries. This company fits into the business plan by participating in manufacturing activities for sub-contract work. To date, ABC has succeeded in securing major wing manufacturing programmed with leading aerospace companies, BAE systems, specifically for the manufacture of Airbus A300, A320 and A380 range of aircrafts. The company has also secured non-aerospace composites component manufacturing of the Alvis Bridging Launch Rail in Advance Composites. W ithin a short span of time since its formation, ABC has emerged as a leading aerospace company in the region and a known industry player in the world.
Though ABC having start to implement Lean M anufacturing System since 2004, but there are some m istakes and frailness due to the lack o f implementation which is observed as in production system, where the knowledge and understanding of lean manufacturing system as common and primary root cause problem. The whole of problems occurred throughout from the top level to the bottom. Due to this, the top management commitment, teamwork, and people capabilities in eliminating wastages are also lacking.
Furthermore, the problems occurred due to the lean implementation was not linking to the individual, department, and company’s key performance indicator which was unmotivated the total employees of the lean implementation by developing the integration and heuristic approach of lean concepts as a new strategy that involve all the company aspects in their operation that correlated to the KPI. The scope of study for this project is conducted only at kitting department.
Developing a New System to Enhance Problem
Solving Capability: In today’s competitive world, no
company can afford to waste resources. The most underutilized resource of most manufacturing company is their people assets. The number one asset of any organization is also its people. In fact, people are one of the few appreciating asset an organization has. The real advantages of employee’s involvement are to focus a group of employees with different perspective on a single objective that support the organization’s strategic focus. The companies that develop and leverage the capabilities of all their employees will achieve better performance than those that do not. The companies that fail to unlock the potential of their workforce will be eliminate wastages by removing non value added activities. People management systems need to provide the capability for rapid improvement and adoption to change. Here, again, we must accept the fact that change is inevitable and that the speed with which the necessary modification are made is the deciding factor in our survival. The objective of the business management system is to apply carefully the organization’s limited resources, including capital and hard assets as well as time and human assets.
Lean process management system are integrated by principles that, in a sense, hold them together. These principles are meant to provide a framework (Figure.1) to focus the direction in enhancing problem solving capability among employees by forming as people d e v e lo p m ent system (P D S ) in le a n p r o c e ss management. They are:
• Key performance indicator - KPI for every level such as company, department, section and individual levels which is link towards organization goal.
• Respect for people – Respect for people which mainly focuses on the lean behaviors that each employee in organization should build in their mind.
• Skill and Knowledge – Skill and Knowledge for employees will support them in practicing lean concept effectively and efficiently by utilizing the lean tool and techniques.
Another important element incorporated with this people development system framework is teamwork of top, middle and bottom management. The total commitment of all these three levels will enhance of problem solving capability in lean process management among employees.
Fig. 1: PDS Framework for Enhance Problem Solving
Capabilities among Employees source: A.P. Puvanasvaran et al., [2 ].
Key Characteristic, Critical Success Factors (CSF)
and Related Performance M atrix: The following key
characteristics, CSFs and related performance metrics are identified A.P. Puvanasvaran et al., .as crucial in[1 ]
p eo p le d evelo p m ent system o f lean p ro cess management and are highlighted in Table 2.
• KPI in lean process management determination thro ugh M issio n, C o re V alue, V isio n, Objective, Strategy, Strategy Initiative and
Personal Objective for people development system is crucial. This will align overall workforce of the company to follow for one common goal. Each level has its own portion of contribution towards the target. The results are compared with the target or goal used to measure the success of KPI. The accumulation of success from each portion will reflect the overall achievement of the company goal. • Respect for people in lean process management
is another crucial factor in developing the lean culture throughout organization. In order to measure the lean behaviors, top management commitment, leanness level of the company and perception of team member’s capability, Likert-type scale is used to get the responses from respondent. For example, one can ask managers to rate the degree of support by top management on five-point scale from no support (1) to total support (5). Beside this, the problem solving capability also can be measured by counting the number of ideas generated, Level of people involved and the total cost of the project.
• Skill and Knowledge in lean process management is the fundamental requirement for employees to equip themselves. W ithout this they can’t perform well in solving problem to identify and eliminate wastages. Lean tools and assessment techniques by using assessment c r i t e r i a t o d e t e r m i n e t h e l e v e l o f implementation using spider web chart with rating of 1 (beginning to introduce) to 5 (practice with excellent). Another measurement on employee skill metric will emphasize on employees skill and their cross functionality.
M ETHODOLOGY
T able 2: An analytical fram ework for m easuring problem solving capability in lean process m anagem ent (Source : A.P.Puvanasvaran et al., .[2 ]
Key characteristics of C ritical success factors (C SF) Perform ance M atrix
integration elem ents of People D evelopm ent System (PD S)
KPI
C ustom er Satisfaction Achievem ents of KPI for each
M ission O n Tim e D elivery level versus goal/target.
C ore Value Zero D efect Productivity
Vision C ost reduction C ustom er com plain
O bjective Effective O peration C ost Scrap/N um ber of reject
Strategy Attendance/ Absenteeism
Strategy Initiative Tardiness (Schedule tim e)
Personal O bjective U sing Q C D AC principles
R espect for people
Team Environm ent Top M anagem ent C om m itm ent N um ber of ideas generated
Self D irected Team effectiveness/form ation Level of people involvem ent
C om m unication Ideas cost or value U sage of lean tools
C ontinuous im provem ents Total cost saving projects
Lean B ehaviors M easured by Likert-type scale on the following item s:
R ewarding system Top M anagem ent C om m itm ent
Lean behaviors
Achievem ent of Leanness level Skill and Knowledge
Technical R equirem ents Produce skilled, knowledgeable Lean tools and techniques assessm ent
and innovative em ployees
C ross Functionality Em ployee skill m etric
Training N eeds & Effectiveness Audit by 3 party or custom ers on lean practicerd where below 0.2 represent minimum strength and above 0.8 represents maximum strength Nesan and Holt, [15 ].
For the second analysis is to determine the relationship or mean score of each level of management for each practice. Analysis of variance (ANOV A) is used to analyses situations in which there are several independent variables and how these independent variables interact with each other Field, . Before calculating the ANOVA, one assumption
[1 1 ]
must be considered is the score of variable is normal distributed.
For the third analysis, correlation is used to measure how between each principle variables are related. Before calculating a correlation coefficient, there are a few assumptions for correlation analysis which are normality and linearity Coakes, . Pearson’s[7 ]
correlation coefficient is a measure of linear association with the score for each variables are normal distributed. If the relationship is not linear and normal distributed, Spearman’s rho will be used to measure the correlation between the variables Coakes, [7 ]. Opinion was given which help researcher to modify the questionnaire. Besides that, from the pre-test, the total time spend to answer the questionnaire also can be identified.
S en d in g a n d R eceiv in g Q u estio n n aire: T he
Analysis Using SPSS: After get the result from company, authors will use the software SPSS version 13 to make the analysis.In the 2 part of the questionn d
(about lean behaviour), the outputs of the analysis were in the form of index values, percentages and hypothesis testing. In the literature review state that Emiliani and Stec [9 ]. explain lean behavior is applying lean principles and tools to improve leadership behaviors and eliminate behavioral waste.
RESULTS AND DISCUSSION
In order to assess the lean behavior before and after the lean implementation, a questionnaire was distributed and then an internal consistency analysis was used to evaluate the reliability of questionnaire.
Respondent Rate: The questionnaire distributed
directly to the employees to do the survey. The beginning of the year (January) questionnaire was distributed to 45 employees of the kitting department. However, 3 employees already resign. Thus, the questionnaire only assigned by 42 people and the feedback collected exactly 42 respondent results. End of the year questionnaire was distributed to 44 people and collected back exactly 44 responds.
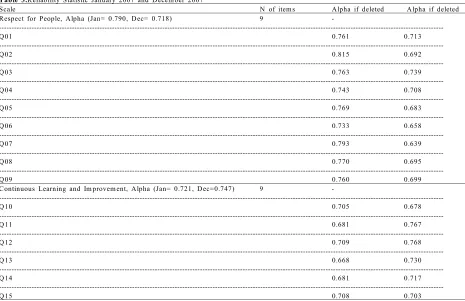
Reliability Test: Internal Consistency Analysis: An
internal consistency analysis was used to assess the reliability of questionnaire. It is an indicator of how well the different items measure the same issue. The measurement of internal consistency involve for calculation of Cronbanch’s coefficient alpha. The values of alpha range from 0 to 1where the value close to 1 indicate higher reliability. Alpha value should be positive and usually greater than 0.7 are considered acceptable for testing the reliability of factors.
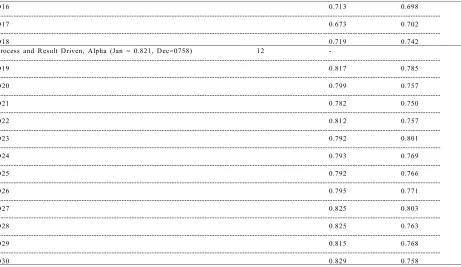
As shown in table 3, the alpha value for the January 2007 in the three categories is range from 0.721 to 0.821. For respect for People, the scale reliability can be increase by eliminate Q02 which s h o w 0 .8 1 5 . F o r C o n tin u o u s L e a r n in g a n d Improvement, the scale reliability is better include all of the nine questions where any questions were eliminated will reduce the scale reliability. Last but not least for Process and Result Drive, the scale reliability can be improved by eliminate Q30 which show 0.829. For the December 2007 the alpha value in three categories is range from 0.718 to 0.758. For respect for People, the scale reliability can be increase by eliminate Q03 which show 0.739. For Continuous Learning and Improvement & Process and Result Driven the scale reliability is better were reduced Q12 and Q23,which show 0.768 and 0.801.
T able 3.R eliability Statistic January 2007 and D ecem ber 2007
Scale N of item s Alpha if deleted Alpha if deleted
R espect for People, Alpha (Jan= 0.790, D ec= 0.718) 9
-
---Q 01 0.761 0.713
---Q 02 0.815 0.692
---Q 03 0.763 0.739
---Q 04 0.743 0.708
---Q 05 0.769 0.683
---Q 06 0.733 0.658
---Q 07 0.793 0.639
---Q 08 0.770 0.695
---Q 09 0.760 0.699
C ontinuous Learning and Im provem ent, Alpha (Jan= 0.721, D ec=0.747) 9
-
---Q 10 0.705 0.678
---Q 11 0.681 0.767
---Q 12 0.709 0.768
---Q 13 0.668 0.730
---Q 14 0.681 0.717
T able 3: C ontinui instrument are consider acceptable. Furthermore, elimination questions also not necessary as the alpha value is just increase slightly after eliminating. Since the alpha value are greater than 0.7, it can conclude that this instrument is reliable.
A nalysis and R esults: T he structured postal
questionnaire survey was designed to assess initial literature search finding concerning the 30 practices, in two different dimensions. Dimension 1 investigated the strength and weakness of lean behavior practices within the organization. Dimension 2 explored the relationship between the lean principles. For each dimension, four Likert scales ranging from 1 to 4 were provided and the scale was used is agreement scale. Agreement scale is used to determine agreement on of the 30 lean behaviors practices, the scale ranged from 1 (strongly disagree) to 4 (strongly agree).
Analysis of Strength and W eakness of the Lean
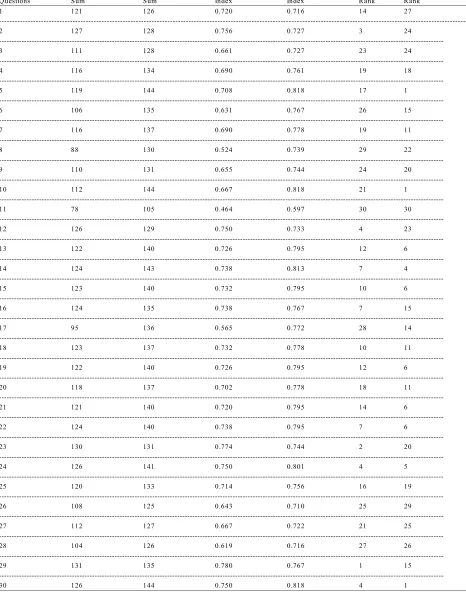
Behaviors Practice: Data obtained from the survey
were subjected to relative index calculations for agreement factor. The relative index was calculated by using the formula: where below 0.2 represent minimum strength and above 0.8 represents maximum strength Nesan and Holt, [15 ].
• People share ideas and knowledge.+0.151
However, there is also some practices need to be
Basically, for the new result, many practices were
• Before making decisions, people gather the information –from 0.708 to 0.818
• People share ideas and knowledge-from 0.667 to 0.818
• People are encouraged to improve their knowledge and skills at work -0.738 to 0.813 need pay more attention where the indices showed very low. The practices are:
• Plant leadership is on the plant floor daily to provide assistance and improve the business is 0.597. However; the index also improved already, for the Jan 2007 just 0.464.
Beside the index, after compare the 2 group of ranking authors found that the ranking for the practices also change a lot. Such are: meeting will give employees operational autonomy encouraged an innovative culture and let employee more contribute ideas to solving problem. Furthermore, the practices “people can participate in decision their job and focus on the problem” in RFP also got strong relationship with PSC. In a study among the employees of a manufacturing plant, found a positive relationship between participation and employees' innovative behavior, measured using self-ratings of employees' suggestions and implementation efforts will contribute the idea of solving problem.
The Figure 3 shows that index value of three main categories which all have significant increase. Especially, respect for people, which is increase from 0.67 to 0.773. This is followed by continuous learning and improvement raise from 0.679 to 0.763 and the process and results driven shows improvement from 0.653 to 0.698 in each. Overall the results shows the company improve in all 3 construct, Thus, we can say, the company really put a lot of effort in practices lean behavior. In conclusion, authors found that most practices of the lean behavior will improve the PSC of the employee. Thus, after implementing lean process after one year, problem solving capability of employee had been increase and make the lean result of company increase.
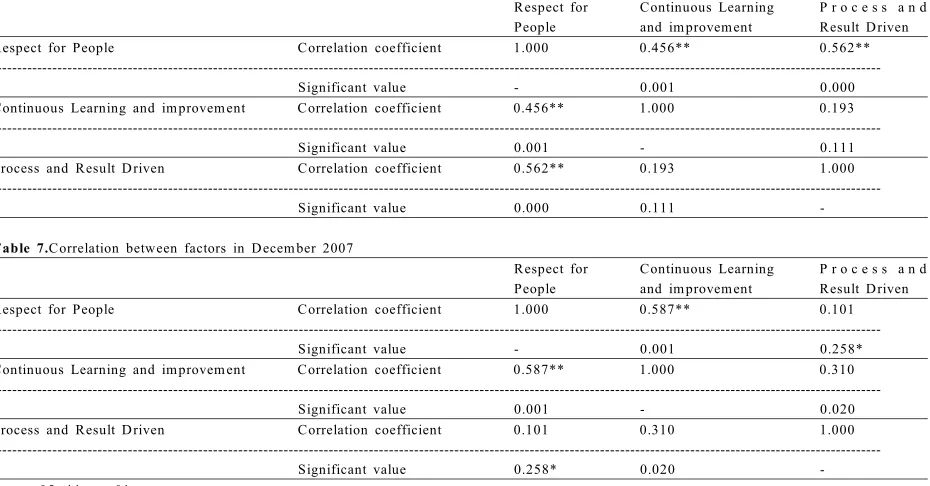
Analysis of the Relationship betw een the Lean
Principles: Correlation between Respect for People,
Continuous Learning and improvement and Process and Result Driven are shown in Table 6 and Table 7.
The data obtained was analyzed by using Statistical Package for Social Science (SPSS) software version 13. Correlation method was used where correlation is a measure of relationship between variables Field, [1 1 ]. Table 6 and Table 7 show a matrix is displayed giving the correlation between the three variables. For the January 2007correlation coefficient 0.587between Respect for People and Continuous Learning and Improvement is 0.456, and the significance value of this coefficient is 0.001. But for December 2007, the values become 0.129, and significance value is 0.202 while the correlation coefficient between Respect for People and Process and Result Driven is 0.526 with the significance value is 0. But for new result is 0.101 and the significance value 0.258.last but no least, correlation coefficient between Continuous Learning and improvement and Process and Result Driven is 0.193 with the significance value is 0.111. For new result is 0.310 and 0.020.
Success of People Development System in Case
Study Company:The importance of problem solving
T able 4.Strength values for January 2007 and D ecem ber 2007
Q uestions Sum Sum Index Index R ank R ank
1 121 126 0.720 0.716 14 27
---2 127 128 0.756 0.727 3 24
---3 111 128 0.661 0.727 23 24
---4 116 134 0.690 0.761 19 18
---5 119 144 0.708 0.818 17 1
---6 106 135 0.631 0.767 26 15
---7 116 137 0.690 0.778 19 11
---8 88 130 0.524 0.739 29 22
---9 110 131 0.655 0.744 24 20
---10 112 144 0.667 0.818 21 1
---11 78 105 0.464 0.597 30 30
---12 126 129 0.750 0.733 4 23
---13 122 140 0.726 0.795 12 6
---14 124 143 0.738 0.813 7 4
---15 123 140 0.732 0.795 10 6
---16 124 135 0.738 0.767 7 15
---17 95 136 0.565 0.772 28 14
---18 123 137 0.732 0.778 10 11
---19 122 140 0.726 0.795 12 6
---20 118 137 0.702 0.778 18 11
---21 121 140 0.720 0.795 14 6
---22 124 140 0.738 0.795 7 6
---23 130 131 0.774 0.744 2 20
---24 126 141 0.750 0.801 4 5
---25 120 133 0.714 0.756 16 19
---26 108 125 0.643 0.710 25 29
---27 112 127 0.667 0.722 21 25
---28 104 126 0.619 0.716 27 26
---29 131 135 0.780 0.767 1 15
Fig. 2: Strength of lean practices.
T able 5.Analysis m ean value index R FP, C LAI, PARD
C onstruct Jan 2007 D ec 2007
R espect for people ( R FP) 0.67 0.773
C ontinuous learning and im provem ent (C LAI) 0.679 0.763
Process and result D riven (PARD ) 0.653 0.698
F ig. 3: Lean behaviors index value
T able 6.C orrelation between factors in January 2007
R espect for C ontinuous Learning P r o c e s s a n d
People and im provem ent R esult D riven
R espect for People C orrelation coefficient 1.000 0.456** 0.562**
---Significant value - 0.001 0.000
C ontinuous Learning and im provem ent C orrelation coefficient 0.456** 1.000 0.193
---Significant value 0.001 - 0.111
Process and R esult D riven C orrelation coefficient 0.562** 0.193 1.000
---Significant value 0.000 0.111
-T able 7.C orrelation between factors in D ecem ber 2007
R espect for C ontinuous Learning P r o c e s s a n d
People and im provem ent R esult D riven
R espect for People C orrelation coefficient 1.000 0.587** 0.101
---Significant value - 0.001 0.258*
C ontinuous Learning and im provem ent C orrelation coefficient 0.587** 1.000 0.310
---Significant value 0.001 - 0.020
Process and R esult D riven C orrelation coefficient 0.101 0.310 1.000
---Significant value 0.258* 0.020
T able 8: Index value of lean behavior in January 2007 and D ecem ber 2007
Variable Index (Jan) Index (D ec)
D O B 0.691 0.7164.
Fig. 4: Comparison for lean behaviors.
been generated in kitting department, and highest is 5 ideas generated per week. In past one year, total of 139 ideas have been generated .It is proved that kitting department proactively and continually sought ideas to solve problems, and indicates employee have capability to solve problem to become a central tenet of lean manufacturing best practice Kerrin, [1 4 ].
The employee involvement is categorized according to three main levels which are top, middle and bottom management. The Figure 6 below shows the level of involvement of employees by generating ideas for the year 2007. The highest contribution is coming from bottom level which is 38 and followed by middle level with 12 top level is 2. Besides this, there is also a combination level involvement in idea generated. Bottom-middle level is 52, middle-top is 35 and bottom-top is 1. Furthermore, total idea generated for group combination level is 87 and single group level is 52. Percentage for combination level is 63% for total ideas generated and 3 type levels is 37%. However if we compare 2 groups, the result shows that total idea generated by group combination level is 35 more than single group level. Thus, the result indicates the teamwork of bottom; middle and top management in both sharing and applying knowledge for generated idea to solving problem are important Delbridge
et al., . [8 ]
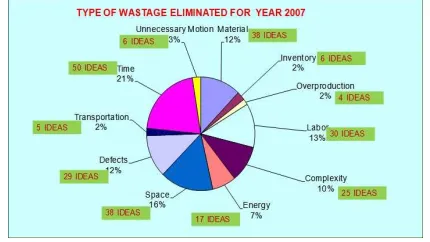
Total of W astages: The graph at Figure 7 gives us an
idea about type of wastages identified at the kitting department, where it is classified into 9 categories. It is obviously noted that the highest waste for company is space waste which is 39, second is time waste at 21, and the lowest waste of transportation which is at 5. W ithout classification of any wastage into performance measurement, no monitoring can be made and no problem solving can be done to reduce the waste, which the impact is the failure of lean process
management implementation A.P. Puvanasvaran
et al.,[2 ]. It indicates employee of the company have capabilities to solve waste problem using the performance measurement.
Fig. 5: Level of employee's involvement for year 2007
Fig. 6: Type of wastage eliminated for year 2007.
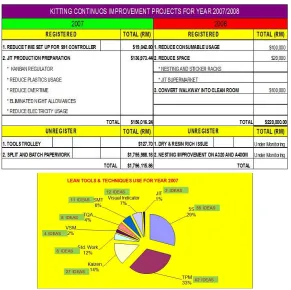
Cost Saving: Cost saving is an important standard to
indicate the problem solving capability of organization. The aim of lean manufacturing is elimination of waste in every area of production and includes customer relations, product design, supplier networks, and factory management. To meet the objectives of saving cost W omack and Jones [2 0 ]. Kitting department ran a Kaizen Project in 2007, and the total amount saving for reduces wastages in past one year is RM 1, 952,617.98. Thus, achievement of cost saving for company indicates employee had contributed much solution to solve problem waste. So, it can be construed that problem solving capability of employees actually improved significantly. The table 9 indicates total cost savings of the kitting department with the reference to their kaizen project generated form the problem solving activities.
Lean Tools U sed in Problem Solving: In general, lean
work chart. The most common tool used by kitting department is TPM , which is 62 times, followed by 5s by 55 time and mean values of using lean tool is 21 times. In past one year, the kitting department total used 189 times of lean tool. In order to introduce lean thinking within manufacturing environment, the philosophy relies on the identification and elimination of the waste problem, which have effectively targeted and applied the various lean tools B.J. Hicks, [12 ]. Thus, the frequency of employee using the lean tool indicates employee understanding identification and elimination waste problem. In deduction, the employees have capability of problem solving.
KPI Achievement: K PI is an important element that
enables the achievement of vision, mission, core value, strategy, and the personnel objective for people development is crucial. Achievement of KPI shows the evidence of people involvement to drive high performance to gain stakeholder and customer satisfaction. M onitoring on each performance, measurement and counter-measurement taken to solve any problem occurring have contributed to the achievement of KPI.
The table 10 shows total monthly man hours percentage of Overtime at kitting department has set the limit to below 12% for the year 07. During PDS implementation, overtime are controllable all the time; not even a month exceeded the limit of overtime, which eventually gave a value of 11.5% for the whole year. It indicates the company has save considerably on labors cost in the past one year. The cost saving is due to employee success in lowering the stop time for the machine DCS 1, DCS 2, DCS 3.
The table also shows the achievement for the value scrap is 1.97% which achieved the goal of 2.6%. The reason why the value is achieved is because the employees use the PDS methods to solve many scrap problems such as material dry and ply damage for the whole year. Besides this, complains on product produce from internal and external customer shows null. It shows that quality of kitting department undergone significant upgrading due to problem solving capability of employees.
Kitting department of the Company has gained benefits from many elements that have not been monitored before, the implementation of PDS. W astages have reduced dramatically. Thus, the achievement KPI proves that problem solving capability has increased.
Table 9: Continuous improvement projects for the year 2007 and 2008.
Table10: KPI Achievement..
Conclusion: The purpose of this project has been to
evaluate the improvement for the lean behavior possessed by the company in past one year. The result show practices lean practices had been make improvement of the company in lean direction and important of problem solving capabilities in eliminating waste and saving cost. The results have provided support to the two proposed hypotheses. B esides that, evidence was found to support the relation between improvements of kitting department with problem solving capability.
The main findings show that the company is improving in past one year. Initial result of the kitting department was in moderate level stage to become lean, but result end of year show that they had nearly meet the high level stage of lean they need to keep their efforts in order to success in lean manufacturing implementation. It is also help the company to recognize the important of increase problem solving capability for employee to eliminating waste.
ACKNOW LEDGEM ENT
The authors wish to acknowledge the assistance and support of the collaborative company to allow for testing the model in real life. Besides that, the authors would like to acknowledge the University Technical M alaysia M elaka for the scholarship granted for his doctoral study.
REFERENCES
1. Puvanasvaran, A.P., B.H. Tan, M .H.M .A. M egat, Tang S.H, M uhamad, M .R, A.M .S. Hamouda, 2008c. “Degree Of Leanness And M anagerial Commitment In An Aerospace Company” Journal
of Statistics and M anagement System, Vol. 11, No. 4 , pp. 6 5 3 – 6 7 3 , IS S N 0 9 7 2 -0 5 1 0, T aru Publications, India.
2. Puvanasvaran, A.P., M .H.M .A. Megat, Tang S.H, M uhamad, M .R, A.M .S. Hamouda, 2008a. “A Review of Problem Solving Capabilities in Lean Process M anagement”American Journal of Applied Sciences Vol.5 No. 5, 2008,ISSN 1546-9239 © 2008 Science Publications, pp: 504-511.
3. Puvanasvaran, A.P., M .H.M .A. Ooi, Megat, S.H. Tang, M .R. M uhamad, A.M.S. Hamouda, 2008b. “Lean B ehavior Among Employees In Aerospace Company” Journal of Productivity, National Productivity Centre, Petaling Jaya, M alaysia, 25 pp: 29-44.
4. Anon, 1997. “Case study: Guiding cultural change at M otorola”, M anagement Development Review, 10(4/5): 185–187.
5. Bhasin, S. and P. Burcher, 2006. “Lean viewed as a p h ilo so p hy”, Jo urnal o f M anufacturing Technology M anagement, 17(1): 56-72.
6. Coakes, S.J., 2005. SPSS: Analysis without Anguish-version 12.0 for W indows, John W iley & Sons Australia. Ltd, Queensland.
7. Comm, C.L., 2005. “A case study in applying lean sustainability concepts to universities”, International Journal of Sustainability in Higher Education, 6(2): 134-146.
8. D elbridge, R., 1998. “Life on the Line in Contemporary Manufacturing,” International Journal of operation & Production M anagement, Oxford University Press, Oxford.
10. Emiliani, M .L., 1998. “Lean behaviors”, Management Decision, 36/9, pp: 615–631. 11. Field, A., 2005. “Discovering Statistics Using
SPSS”, Sage Publications, pp: 107.
12. Hicks, B.J., 2007. “Understanding and eliminating waste” international Journal of information Management.
13. Jeroen, P.J. and N.D.H. Deanne, 2007. “How l e a d e r s i n f l u e n c e e m p l o y e e s ' i n n o v a t i v e behaviour”.Emerald Group Publishing Limited, pp: 761-771.
14. Kerrin, N., 1999. M anaging Innovation and Change: A Critical Guide for Organizations, Thomson, London.
15. Nesan, L., Jawahar and D. Holt Gary, 2002. “Assessment of organizational involvement in i m p l e m e n t i n g e m p o w e r m e n t ” , I n t e g r a t e d Manufacturing Systems, 13/4, pp: 201-211. 16. O'hEocha, C., 2000. “Case studies: A study of the
influence of company culture, communications and employee attitudes on the use of 5Ss for environmental management at Cooke Brothers Ltd”, The TQM Magazine, 12.(5): 321±330.
17. Orr, C., 2005. “Lean Leadership in Construction”, M anagement of People and Team, Proceedings IGLC-13.
18. R o nald, M . B ecker, 2001. “A utomo tive M a n u f a c t u r i n g a n d P r o d u c t i o n ” , http://www.findarticles.com/p/articles/mi_m0FW H /is_6_113/ai_76445159 (accessed on June 2001). 19. Sanjay Bhasin & Peter Burcher, 2006. “Lean
viewed as a philosophy”, Journal of M anufacturing Technology M anagement, 17 (1): 56-72.
![Fig. 1: PDS Framework for Enhance Problem SolvingCapabilities among Employees source: A.P.Puvanasvaran et al., [2].](https://thumb-ap.123doks.com/thumbv2/123dok/622246.75041/4.612.83.286.398.548/fig-framework-enhance-problem-solvingcapabilities-employees-source-puvanasvaran.webp)
![Table 2: An analytical framework for measuring problem solving capability in lean process management (Source : A.P.Puvanasvaran et al.,[2].](https://thumb-ap.123doks.com/thumbv2/123dok/622246.75041/5.612.73.540.99.344/analytical-framework-measuring-problem-solving-capability-management-puvanasvaran.webp)