Australian Journal of Basic and Applied Sciences
Journal home page
Corresponding Author: Mohd Saifuzam Jamri, Universiti Teknikal Malaysia Melaka, Department of Power Electronics & Drives, Faculty of Electrical Engineering, Durian Tunggal. Melaka. Malaysia.
Ph:(+606) 5552315 E-mail: [email protected]
Control of Maximum Power Point Tracking for Stand-Alond Photovoltaic System
Using Voltage Comparison Technique
Jamri M.S and Kassim A.M.
Universiti Teknikal Malaysia Melaka, Faculty of Electrical Engineering, Durian Tunggal Melaka
A R T I C L E I N F O A B S T R A C T
Article history:
Received 15 October 2013 Received in revised form 20 December 2013
Accepted 23 December 2013 Available online 1 February 2014
Keywords:
Photovoltaic, voltage mode control DC-DC converter, maximum power point tracking
This paper proposed the other method to control of maximum power point tracker for stand- alone photovoltaic system using closed-loop voltage mode control algorithm. Approach: The PV module was modeled based on the parameters obtained from a commercial PV data sheet while voltage mode control was modeled using simulink block model. A DC-DC boost converter was chosen to regulate the DC voltage from the PV module. The voltage mode control maximum power point tracking model was simulated under a constant and a variable change of solar irradiance and temperature. The perturb and observe maximum power point tracker model was developed and compared with this proposed method in order to validate the performance of output results. Results: Results showed that the voltage mode control maximum power point tracking model yields the similar performance as produced by the photovoltaic system controlled by perturb and observe maximum power point tracking algorithm simulation in terms of the voltage, current and power generated under the changing irradiant and temperature condition. Conclusion/Recommendations: The voltage mode control technique is possible to be implemented which yields the similar performance as the results from conventional MPPT method.
© 2013 AENSI Publisher All rights reserved. To Cite This Article: Jamri M.S., Kassim A.M.., Control of Maximum Power Point Tracking for Stand-Alond Photovoltaic System Using Voltage Comparison Technique. Aust. J. Basic & Appl. Sci., 7(14): 229-236, 2013
INTRODUCTION
The sun light is one of the most important things that very useful for human and nature. It is important in sustaining the way of human nature life. Besides that, it is a very useful to harvest in generating of electricity through the contribution of concentration light. Photovoltaic is a part of renewable energy element which is act as a medium in converting the light into electricity energy. There a few types of photovoltaic system such as grid connected hybrid system photovoltaic, stand-alone photovoltaic system and direct coupled system. Besides, many research and studies had done in term of enhancement of photovoltaic system.
The stand-alone PV system is defined as an autonomous system that supplies the electricity without being connected to the utility grid. The installation of the system may include PV array, DC-DC converter, energy storage device, DC-AC inverter and an electrical load. The energy storage device is used to maintain the desired output during the low irradiance or during the night time. Many works have been done in the PV system simulation and modeling.
The issue of PV modeling has been discussed in (Armstrong, S. and W.G. Hurley, 2004; Baeet, H.S., 2005; Chen, C.T., 1999; Femiaet, N., 2005; Ito, R., 2003). This study focus on modeling and control of a stand-alone photovoltaic system using voltage mode control DC-DC converter method without the connection with energy storage device. This study is only to know the performance of proposed method instead of using maximum power point tracker algorithm to optimize the use of photovoltaic module.
The voltage mode control DC-DC converter is the one method to control in close-loop operation. The main principle of this method is to regulate the variation of input DC to the constant output DC. In order to integrate this method into the photovoltaic system, the reference of output DC-DC converter voltage is always refer to the output of photovoltaic module. As in MPPT approach, the DC-DC boost converter was chosen in order to step-up the DC voltage and it’s operated under automatic control duty cycle switching. Compare to the voltage mode control method, the value of duty cycle is determined by the basic mathematical equation.
simulation results are showed and discussion of the results is made. In addition, a similar proposed PV system which is control by MPPT algorithm using Simulink / MATLAB is used to compare with the results obtained from the proposed voltage mode control PV system. Finally, conclusion is made.
Modeling and Simulation:
Modeling of photovoltaic module generation:
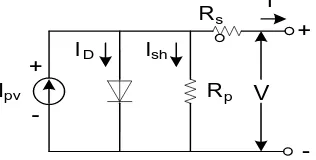
Photovoltaic module is build with multiple of cell consist of combination of solar cells connected in series or parallel configuration. The energy that produces from the concentration of solar cell and light will generate electricity that can be used directly by stand-alone photovoltaic direct coupled system. As well known photovoltaic is a non linear device and can be signify using a current source in parallel with diode as shown as figure 1 (Kassim, A.M., 2013).
Fig. 1: The electrical equivalent circuit of a PV cell.
There are two types of photovoltaic cell represent in electrical equivalent circuit which are, single diode connection and two diode connections. But in these studies, the single diode connection had been used to define the characteristic of PV module. The single diode connection includes a connection of series and parallel internal resistance which represent as Rp and Rs as shown in Fig 1. The value of Rp can be neglected due to very low resistance so it not to consider in the equation.
By applying the current Kirchhoff law:
I = IPV −ID (1)
Where IPV is refer to the light generated current produced by the photovoltaic cell which has a linear
relationship with the solar irradiance and temperature, as shown in the following equation:
IPV = (IPVn+ Ki∆T)
G Gn
(2)
The IPVnis the light generated current at the nominal condition.While∆T is the variation of temperature and
expressed by ∆T = T−Tnwhere and Tnis the actual and nominal temperature which is 25℃and it convert to unit Kelvin, K respectively. While G is the solar irradiation by the PV surface and Gnis the nominal solar
irradiation which is 1000Wm−2(Kassim, A.M.,2013). IDis the current flow through the diode as shown in Fig. 1
and it saturated as dependence on the temperature and nominal photovoltaic current and voltage. The full expression of this dependence diode is:
ID= Io[exp� V+RsI
Vta � −1]
(3)
Where:
= The photovoltaic circuit output current = The photovoltaic output voltage
Vt= NsKT/q = The thermal voltage of array with Ns cells connected in series
= The electron charge (1.60217646e−19C) = The Boltzmann constant (1.3806503e−23JK−1)
= The temperature of the p-n junction in the unit of Kelvin = The diode ideality constant
Table 1: The electrical characteristic of BP340 PV module.
Parameter Variable Value
Maximum power Pmpp 40 W
Voltage at Pmax Vmpp 17.3 V
Current at Pmax Impp 2.31 A
Short-circuit current ISC 2.54 A
Open-circuit voltage VOC 21.8 V
Temperature coefficient of open-circuit voltage Kv -(80±10) mV/°C
Temperature coefficient of short-circuit current Ki (0.065±0.015)%/°C
0 5 10 15 20 25
The diode saturation currentIo is expressed by:
Io=
ISC n+Ki∆T
exp�V OC n +KV∆T
a V t �−1
(4)
Where KV is the temperature coefficient of open-circuit voltage while Kiis the temperature coefficient of short-circuit current. ISCnandVOCnare the short-circuit current and open-circuit voltage under the nominal condition respectively. The BP340 solar module is chosen for the PV module modeling. The electrical characteristics given by datasheet are shown in Table 1. All the nominal value as mentioned for IPVn, ISCn and
VOCn are refer from this table.This module consisting of 36 cells connected in two parallel strings. The PV model was developed in Simulink/MATLAB using combination of eq. 1-4.
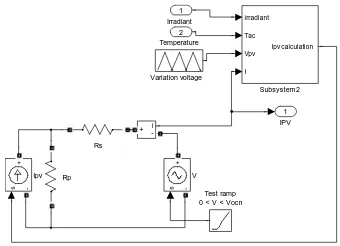
The model yields the PV current , using the electrical parameter of the module (ISC, VOC)and the variables
Voltage, Irradiation (G) and Temperature (T) as the inputs to the model as shown in Fig. 2. In order to validate the functionality of model, it simulated under variation of irradiances and temperatures. The simulated I-V and P-V characteristic curves are shown in the Fig. 3 and 4 respectively. The results show that the PV module is capable of reproducing the electrical characteristics as mentioned in Table 1.
Fig. 2: PV module model using MATLAB/Simulink.
Fig. 3: PV module characteristics curves plotted under changing irradiances.
Fig. 4: PV module characteristics curves plotted under changing temperatures.
Modeling of Maximum power point tracker:
The photovoltaic module yields the current-voltage characteristic with a unique point which is known as the Maximum Power Point (MPP)
generate the maximum voltage on its operating point while the current is depends on the load supply. The higher the load supply, the higher the current value would generated by the photovoltaic cell. There are several MPP tracking control methods in the literature, such as fuzzy logic control, neural network control, pilot cells and digital signal processor based implementation. Nevertheless, Perturb and Observe (P and O) and Incremental Conductance (INC) algorithms are most widely used, especially for low-cost implementations 2013; Mahmoud, A.M.A., 2000; Marouani, R. and F. Bacha, 2009). As shown in the Fig. 3 and 4 in the previous part, the MPP changes as a consequence of the variation of the irradiance and temperature level. Therefore, it is necessary to ensure that the PV system always operates at the MPP under uniform irradiance in order to maximize the power harvesting the prevailing environmental conditions.
Perturb and observe maximum power point tracker:
In P and O MPP algorithm, a small perturbation is introduced for every iteration to alter the duty cycle value in order to force the operating point to move near the maximum power point. This algorithm compares the power measured in the previous cycle with the power of the current cycle to determine the next perturbation direction. If the power increases due to the perturbation then the perturbation will remain in the same direction. If the operating point exceeds the peak power and deviate to the right side of the P-V characteristic curve, the power at the next instant will decrease, thus, the direction of the perturbation reverses. When the steady-state is reached, the operating point oscillates around the peak power as the MPP will perturb continuously. In order to keep the power variation small, the perturbation size is kept very small yet this will cause the system to respond slowly during transients. The operation of P&O MPPT algorithm is illustrated in the Fig. 5 (a) while the modeling using Simulink /MATLAB is shown in Fig. 5 (b).
(a) (b)
Fig. 5: The Pertube and observe P&O illustration. (a) P&O Algorithm (b) Implementation into Simulink
/MATLAB.
The proposed MPPT control using voltage mode control, VMC approach:
In VMC method, the DC-DC boost converter was operated in closed-loop condition. It uses the value of output voltage from photovoltaic module as a reference and sense the output voltage of DC-DC boost converter as a current voltage. These two values are then used to calculate the value of duty cycle by using the basic input/output DC-DC boost converter equation.
D = 1−Vref
Vo
(5)
Fig. 6: The proposed MPPT control illustration. (a) Proposed Algorithm (b) Implementation into Simulink
/MATLAB.
Simulation Setup:
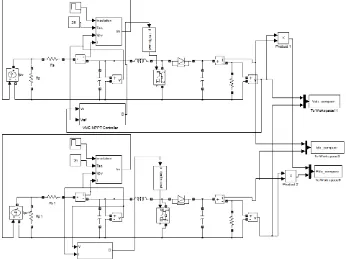
In order to validate the proposed MPPT model, a circuitry simulation of the proposed PV system is performed. With using the same parameters, this circuit is connected in parallel with the conventional PV system model which used the P&O MPPT controller. Both the proposed MPPT model and conventional MPPT models were developed in Simulink /MATLAB as shown in Fig. 7. The DC-DC boost converter was designed to operate at the switching frequency of 20 kHz, the inductor of 20 mH to ensure DC-DC converter operating under continuous current mode and the output capacitor of 2 mF to generate small output ripple which is less
than 1%. The load is a pure resistive load of 10 Ω.
Fig. 7: The experimental setup in Simulink /MATLAB.
Wm−2and temperature was set to be constant as 25°C. On the other hand, it was also tested under a sudden
change of temperature from T = 25 to 75°C and constant solar irradiance of G = 1000 Wm−2.
Results & Analysis:
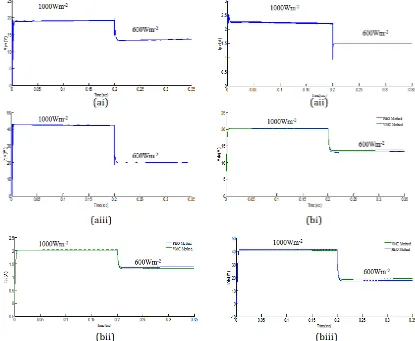
The simulation results show that the photovoltaic module generates an average of 43 W, 18 V of voltage and 2.3 A of current under the nominal irradiance and temperature. This output may change as the irradiance and temperature level changes as shown in Fig. 8a. Due to the fixed step-size used in the MPPT, the maximum power point tracking controller brings the photovoltaic module output continuously oscillates around the maximum power point. The oscillation occurs during the transient as shown in Fig. 8(ai), (aii) and (aiii) and Fig. 9 (ai), (aii) and (aiii) are attributed to the switching action of the boost converter and the fixed step size of the MPPT algorithm.
The results show that the system operated with proposed MPPT model yields the similar waveform shape with the one produced by the system combined with perturb and observe MPPT model. The amplitude of the output waveform decreases when the irradiance and temperature of PV array decreased due to the voltage drop of the DC voltage of the boost converter. It can be noticed that the voltage mode control MPPT method make the output voltage and output power of boost converter are slightly higher than perturb and observe MPPT method. This is because the algorithm of voltage mode control MPPT method is only measured the step size of output voltage between the photovoltaic module and boost converter. Compare to perturb and observe MPPT algorithm which measured the current value to calculate power and make the output current of boost converter slightly higher.
Fig. 9: The simulation output with the step of Temperature: (a) PV side, (b) Boost converter side.
Conclusion:
This paper has presented the modeling of a standalone PV system using voltage mode control MPPT method. The details of the modeling technique and circuitry simulation were described and comparisons were made with the conventional perturb and observe MPPT technique. The objective of this method is to controland optimize the output of photovoltaic system and validate with theone of conventional MPPT technique simulation. Analysis of the results shows that the model yields the similar performance.
The voltage mode control MPPT method is possible to implement in a modeling and control of photovoltaic system because the model yields the similar performance as the results from perturb and observe MPPT method which may help to reduce the overall complexity of conventional MPPT algorithm.
ACKNOWLEDGEMENT
This research was supported by grant from Universiti Teknikal Malaysia Melaka award no. PJP/2012/FKE(6A)/S01091.
REFERENCES
Armstrong, S. and W.G. Hurley, 2004. Self-regulating maximum power point tracking for solar energy systems. Proceeding of the 39th International Universities Power Engineering Conference, Sept. 6-8, University of the West of England (UWE), Bristol, UK., pp: 1339-1350.
Baeet, H.S., J.H. Park, B.H. Cho and G.J. Yu, 2005. New control strategy for 2-stage utility-connected photovoltaic power conditioning system with a low cost digital processor. Proceedings of the IEEE 36th Power Electronics Specialists Conference, June 16-16, IEEE Xplore Press, pp: 2925-2929.
Chen, C.T., 1999. Linear System Theory. 3rd Edn, pp: 86-98.
Femiaet, N., G. Petrone, G. Spagnuolo and M. Vitelli, 2005. Optimization of perturb and observe maximum power point tracking method. IEEE Trans. Power Elect., 20: 963-973.
Kassim, A.M., M.S. Jamri, M.R. Hashim, 2013.
Research, 748: 1125-1129.
Mahmoud, A.M.A., H.M. Mashaly, S.A. Kandil, H. El Khashab and M.N.F. Nashed, 2000. Fuzzy logic implementation for photovoltaic maximum power tracking. Proceeding of the 26th Annual Conference of the IEEE International Workshop on Robot and Human Interactive Communication, Oct. 22-28, IEEE Computer Society, pp: 735-740. Am. J. Applied Sci., 7(5): 682-691, 2010691.
Marouani, R. and F. Bacha, 2009. A maximum-power point tracking algorithm applied to a photovoltaic water-pumping system. Proceeding of the 8thInternational Symposium on Advanced Electromechanical Motion Systems and Electric Drives Joint Symposium, Sept. 2009, IEEE Computer Society, pp: 16.
Moussa, W.M. and J.E. Morris, 1990. Comparison between state-space averaging and PWM switch for switch mode power supply analysis. Proceedings of the 1990 IEEE Southern Tier Technical Conference, Apr. 25-25, IEEE Xplore Press, Binghamton, NY., pp: 15-21.
Rashid, M.H., 2004. Power Electronics Circuits, Devices and Application. 3th Edn. Pearson/Prentice Hall, pp: 880.
Ropp, M.E. and S. Gonzalez, 2009. Development of a MATLAB/simulink model of a single-phase grid connected photovoltaic system. IEEE Trans. Energy Converter, 24: 195-202.
Salhi, R.E.B.M., 2009. Maximum power point tracking controller for PV systems using a PI regulator with boost DC/DC converter. ICGST-ACSE J., 8: 21-27.
Theocharis, A.D., A. Menti, J. Milias-Argitis and T. Zacharias, 2005. Modeling and simulation of a single-phase residential photovoltaic system. Proceeding of the IEEE Russia Power Tech, June27-30, IEEE Computer Society, St. Petersburg, pp: 1-7.