DOI: 10.12928/TELKOMNIKA.v14i4.4177 1313
Laser-Induced Color Marking of Titanium Alloy
Li Chunling*1, Lu Changhou2 1,2
Key Laboratory of High-efficiency and Clean Mechanical Manufacture, Ministry of Education, School of Mechanical Engineering, Shandong University,
17923 Jingshi Road, Jinan, Shandong Province, China, 0531-88392118
1
School of Mechanical and Automotive Engineering, Qilu University of Technology 3501 Daxue Road, Jinan, Shandong Province, China, 0531-89631132 *Corresponding author, e-mail: [email protected], [email protected]
Abstract
A Nd:YAG nanosecond laser was utilized in the laser color marking of titanium alloy substrates. It was focused on how several laser parameters, such as pumping current, delay between the effective vector step, laser line spacing, Q-switch frequency and focal plane offset, affected the resulting colors, and the influence of the resulting colors on the substrate. Firstly, single-factor experiments were carried out. Then the dark blue square pattern and two samples were analyzed using an environmental scanning electron microscope (ESEM) and X-ray diffractometer (XRD) respectively. Results clearly showed that the Nd:YAG nanosecond laser can induce multiple colors on titanium alloy substrates and all the five parameters had an effect on the resulting colors significantly. The dark blue square pattern didn’t induce internal stresses within the substrate material, so the influence of the resulting colors on the substrate is negligible.
Keywords: laser color marking, titanium alloy, surface oxidation, laser processing parameter
Copyright © 2016 Universitas Ahmad Dahlan. All rights reserved.
1. Introduction
Color markings on metal surfaces are made by the traditional technologies such as printing, electroplating, painting and so on. However, these processes have some limitations in practical applications [1]. The poor scratch and wear of printing coatings and complexity of electroplating processes and high cost of paintings are recognized problems. So the traditional color marking technologies are gradually replaced by the laser color marking technology which requires a laser to scan the metal surface and give rise to surface oxidation to create a permanent color marking on a metal surface and does not use any chemicals, coatings or tools [2]. The laser-induced color patterns can make the metal surface visually more attractive and are gaining interest for consumer products [3, 4].
A lot of investigations have been carried out to better understand the laser color marking process. The color patterns were marked on stainless steel by an infrared laser [5,6], or fiber laser [7-12] or KrF excimer laser [13] or UV laser [14] and marked on titanium by a fiber laser [15, 16]. These studies mainly focused on the influence of laser processing parameters on the resulting colors and the analysis of laser induced oxide films on metal surfaces. It has been proved that the laser-induced colors are sensitive to laser processing parameters which consistently appear in these studies are laser power, scanning speed, and focal plane offset. But the controlled parameters differ in various laser marking systems. The effect of other parameters on the laser-induced colors was not reported, such as pumping current, Q-switch frequency, laser line spacing, Q release time etc. Regarding the analysis of oxide films, the surface morphology and optical properties of the oxide films and their thickness were mainly studied. But as the laser beam generates intense heat, internal stresses may occur, which may cause distortion of the substrates outside its limits. It is must be avoided in industrial applications of laser coloring marking technology. So far the related researches haven’t been reported.
explored by analyzing the laser treated area and two samples using an environmental scanning electron microscope (ESEM) and X-ray diffractometer (XRD) respectively. The researches have greatly improved the industrial applications of laser color marking technology.
2. Research Method 2.1. Experimental Setup
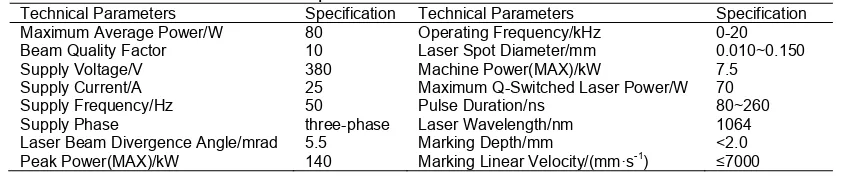
A HAN’S Q-switched lamp pumped neodymium-doped, yittrium-aluminium-garnet (Nd :YAG) laser was used in the laser color marking process of titanium alloy. The technical parameters of the laser are shown in Table 1.
Table 1. Technical parameters of the HAN’S YAG-T80C laser
Technical Parameters Specification Technical Parameters Specification Maximum Average Power/W 80 Operating Frequency/kHz 0-20 Beam Quality Factor 10 Laser Spot Diameter/mm 0.010~0.150
Supply Voltage/V 380 Machine Power(MAX)/kW 7.5
Supply Current/A 25 Maximum Q-Switched Laser Power/W 70
Supply Frequency/Hz 50 Pulse Duration/ns 80~260
Supply Phase three-phase Laser Wavelength/nm 1064 Laser Beam Divergence Angle/mrad 5.5 Marking Depth/mm <2.0 Peak Power(MAX)/kW 140 Marking Linear Velocity/(mm·s-1) ≤7000
The laser-induced colors were analyzed by means of a Quanta 200 environmental scanning electron microscope (ESEM) whose resolution is 3.5nm. The internal micro-stresses of the laser marked blue area were analyzed using a D8-ADVANCE X-ray diffractometer (XRD) which is copper (Cu) target X-ray tube. The XRD was equiped with a θ/θ goniometer whose angle repeatability is 0.0001º and degree of accuracy is ±0.001º [17].
2.2. Substrate Materials
Experiments were conducted for plates of commonly used TC4 titanium alloy (chemical composition Fe=0.3%max, C=0.1%max, N=0.05%max, H=0.015%max, O=0.2%max, Al=5.5%~6.8%, V=3.5%~4.5%, the rest is Ti) with thickness of 2mm. The plates were rinsed using ethyl alcohol to remove any oil and dust residues before the experiments.
2.3. Experimental Procedure
The laser tool path pattern was one-way raster scanning which was depicted in Figure 1. The triangle and circle represented the starting and ending point of laser beam respectively. The laser scanned the first line along the x direction, then waited for the galvanometric scanner back to the starting point of the second line. The dotted line represented the return route where no laser was emited. The worktable was adjustable in three dimension.
be burned at the focal plane owing to the high laser power density [21], so the focal plane offset had an important impact on the laser-induced colors.
On the basis of above analysis, the 5 processing parameters (i.e. pumping current, delay between the effective vector step, Q-switch frequency, laser line spacing, focal plane offset) were selected to carry out the laser color marking experiments. Many color square patterns of 5mm×5mm were marked on titanium alloy substrates by OFAT experiments. In addition, two samples with the same dimensions were analyzed by the X-ray diffractometer (XRD). One was unmaked sample, the other was maked a dark blue square pattern.
Table 2. Controlled processing parameters in HAN’S laser marking system 2000 Controlled Processing Effective Vector Step/mm 0.001~0.03 0.01 Empty Vector Step/mm 0.03~0.08 0.06 Delay between the
Table 3. Relationship between pumping current and output power Pumping
Laser-induced color patterns on the titanium alloy are shown in Figure 2, Figure 3, Figure 4, Figure 5 and Figure 6 by varying some parameters as indicated in the figure, and the values of other parameters are taken in Table 4. The ESEM analysis results of Figure 6 are shown in Figure 7. The XRD analysis results of the two samples are shown in Figure 8.
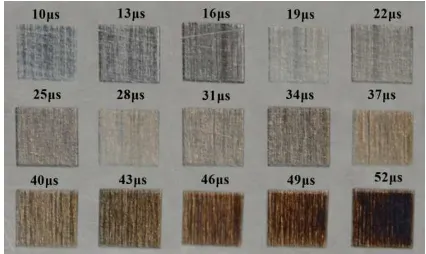
Figure 1. One-way raster scanning Figure 2. Effect of delay between the effective vector step on the laser-induced colors
(a) (b) (c)
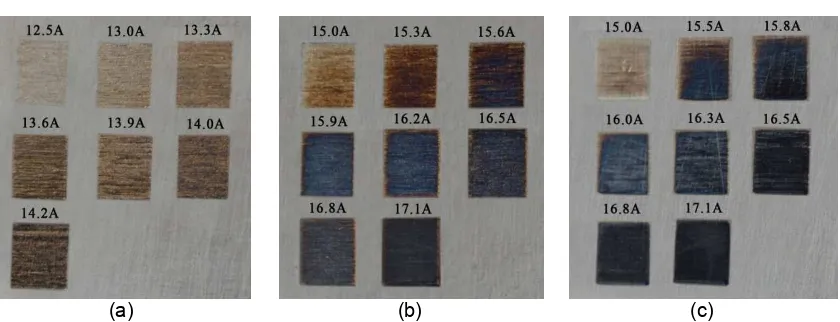
Figure 3. Effect of pumping current and focal plane offset on the laser-induced colors: (a) focal plane offset 3.0, (b) focal plane offset 4.6mm, (c) focal plane offset 5.9mm
(a) (b)
Figure 4. Effect of laser line spacing on the laser-induced colors
Figure 5. Effect of Q-switch frequency on the colors
Figure 6. The blue pattern
Figure 7. ESEM photographs of the blue pattern
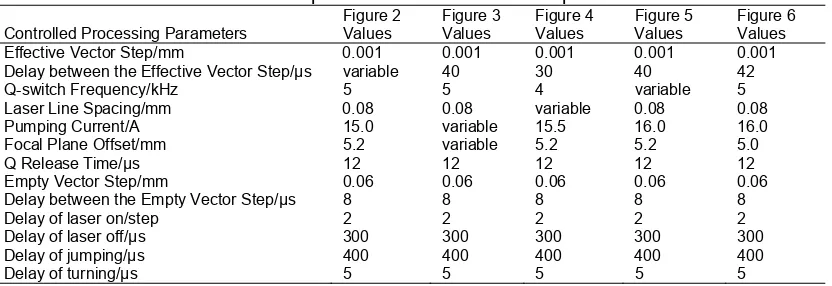
Table 4. Laser parameter values in each experiment
Figure 2 Figure 3 Figure 4 Figure 5 Figure 6 Controlled Processing Parameters Values Values Values Values Values Effective Vector Step/mm 0.001 0.001 0.001 0.001 0.001
On the whole, the laser-induced colors gradually deepen even burning black with the increase in the delay between the effective vector step, pumping current, and Q-switch frequency as shown in Figure 2, Figure 3, and Figure 5 respectively, while the colors became light gradually with the increase in the laser line spacing and focal plane offset as shown in Figure 4 and Figure 3 respectively. The reason may be as follows. When a color square pattern was being marked, a transparent oxide film was formed on the surface of the titanium alloy [13]. The resulting colors were formed owing to the interference effect in the thin film, so the thickness of the film determined the colors. The accumulated laser heat determined the thickness of the film, because the influence of the parameters on the obtained colors are based on heat treatment.
The output power increases with the increase of pumping current as shown in Table 3, so the laser power density in the laser treated area increases correspondingly when the focal plane offset is kept constant. The focal plane offset is also closely related to the laser power density in the laser treated area. The smaller the focal plane offset, the smaller the laser spot radius on the substrate, the higher the laser power density, so the deeper the resulting colors. It can be seen from Figure 3 that there is a suitable laser power density range, some colors cann’t be obtained if the laser power density is too high or too low.
The delay between the effective vector step refers to the preset time for each effective vector step. The laser scanning speed decreases gradually with the increase of the delay between the effective vector step. When laser scanned on the metal surface due to the movement of the galvanometer, many continuous linear markings were obtained as a result of the overlap of laser pulse spot. The distance between the two adjacent laser linear markings is called laser line spacing, namely the s in Figure 1. The wider the laser line spacing, the less the laser line needed for marking a square pattern, the less the laser heat accumulation, and so the lighter the obtained colors. The fact that the resultant colors produced by the same processing parameters exist color difference are also observed in Figure 4. It is mainly caused by the instability of the laser color marking process.
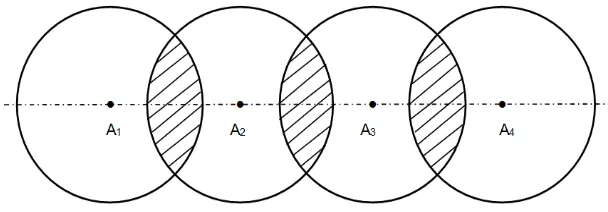
Figure 10 indicates two adjacent pulses are marking on metal surface at a certain time interval and spacing. The relationship between them is to be:
f
Where: ∆t is the time interval of two adjacent pulses ∆s is the spacing of two adjacent pulses f is the Q-switch frequency
v is the laser scanning speed
bigger the Q-switch frequency, the deeper the colors. But Figure 5 shows that there is little color difference when the Q-switch frequency is more than 10kHz. The phenomena are caused by the change of laser output power and pulse width. Obviously, effective vector step and Q release time also significantly affect the obtained colors, but they were kept constant in experiments. In practice, the influence of the two processing parameters on the resulting colors can be derived from delay between the effective vector step and Q-switch frequency respectively. The influence of laser processing parameters on the obtained colors was based on the combination of heat accumulation and oxidation of substrate materials. So the same color can be marked by different sets of parameters.
Figure 10. Schematic diagram of laser pulse overlap regions
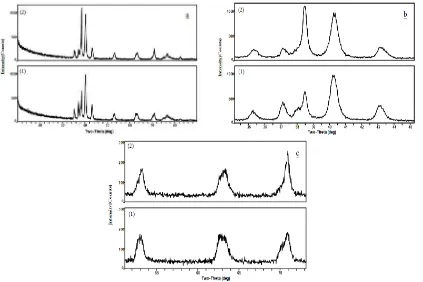
The blue square in Figure 6 isn’t a flush or smooth mark and there are many obvious continuous linear markings and circular dents under ESEM with 100 and 400 times magnification respectively as shown in Figure 7. These circular dents can be seen clearly under ESEM with 800 and 1600 times magnification. This illustrates that the surface of the laser marked blue square has been molten and resolidified to form larger clusters of crystals. As can be seen in Figure 8 (a), (b) and (c), within the range of diffraction angle between 10° and 90°, there is no evident increase in the width of the diffraction peak for the laser color marked sample and no appearance of new diffraction peak or the displacement of those initially recorded on the unmarked sample. So the nature of the phases and the structure of the substrate haven’t been modified, then one can say laser color marking didn’t induce internal stresses within the substrate material.
5. Conclusion
Based on the obtained results and discussions, the main conclusions are: The Nd:YAG nanosecond laser can induce several colors on titanium alloy substrates, such as yellow, gray, blue and so on. The same color can be marked by different sets of parameters; All the selected parameters (i.e. pumping current, delay between the effective vector step, Q-switch frequency, laser line spacing, focal plane offset) had an effect on the resulting colors significantly. But the resultant colors produced by the same parameters exist color difference owing to the instability of the laser color marking process; There is a suitable laser power density range, some colors cann’t be obtained if the laser power density is too high or too low; and The surface of the laser marked blue square has been molten, but laser color marking didn’t induce internal stresses within the substrate material.
Acknowledgments
References
[1] Huang TQ, Li JM, Lu CH, et al. Laser-induced color marking on 304 stainless steel by Nd:YAG nanosecond laser. Applied Laser. 2013; 33(6): 586-590.
[2] Dusser B, Sagan Z, Foucou A, et al. News applications in authentication and traceability using ultrafast laser marking. Proceedings of SPIE-The International Society for Optical Engineering. 2009; 7201(24): 3605-3605.
[3] Gabzdyl J. Ornamental color laser marking of metals. Industrial Laser Solutions. 2008.
[4] Ng TW, Yeo SC. Aesthetic laser marking assessment using luminance ratios. Optics & Lasers in Engineering. 2001; 35(3): 177-186.
[5] Liu ZM, Zhang QM, et al. Influence of Laser Process Parameters on Color Obtained by Marking.
Chinese Journals of Lasers. 2014; 41(4): 121-127.
[6] Arkadiusz J. Antończak, Bogusz Stępak, Paweł E. Kozioł, et al. The influence of process parameters on the laser-induced coloring of titanium. Applied Physics A. 2014; 115(3): 1003-1013.
[7] Laakso P, Ruotsalainen S, Pantsar H, et al. Relation of laser parameters in color marking of stainless steel. Physica B Condensed Matter. 2009; 380: 563-564.
[8] Amara EH, Haïd F, Noukaz A. Experimental investigations on fiber laser color marking of steels.
Applied Surface Science. 2015; 351: 1-12.
[9] Li G, Li J, Hu Y, et al. Femtosecond laser color marking stainless steel surface with different wavelengths. Applied Physics A. 2015; 118(4): 1189-1196.
[10] Veiko V, Odintsova G, Gorbunova E, Ageev E, Shimko A, Karlagina Y, et al. Development of complete color palette based on spectrophotometric measurements of steel oxidation results for enhancement of color laser marking technology. Materials and Design. 2016; 89(1): 684-688.
[11] Antonczak AJ, Nowak M, Koziol P, et al. Laser-induced color marking of stainless steel. Proc Spie. 2013; 8703(3): 343-348.
[12] Lawrence SK, Adams DP, Bahr DF, et al. Mechanical and electromechanical behavior of oxide coatings grown on stainless steel 304L by nanosecond pulsed laser irradiation. Surface & Coatings Technology. 2013; 235(12): 860-866.
[13] Zheng HY, Lim GC, Wang XC, et al. Process study for laser-induced surface coloration. Journal of Laser Applications. 2002; 14(4): 215-220.
[14] Li ZL, Zheng HY, Teh KM, et al. Analysis of oxide formation induced by UV laser coloration of stainless steel. Applied Surface Science. 2009; 256(5): 1582-1588.
[15] Adams DP, Hodges VC, Hirschfeld DA, et al. Nanosecond pulsed laser irradiation of stainless steel 304L: Oxide growth and effects on underlying metal. Surface & Coatings Technology. 2013; 222(6): 1-8.
[16] Vadim V, Galina O, Eduard A, et al. Controlled oxide films formation by nanosecond laser pulses for color marking. Optics Express. 2014; 22(20): 24342-24347.
[17] Li CL. Study of effect of laser marking Data Matrix symbols on titanium alloy sheets using Nd:YAG laser. 2014 International Conference on Manufacturing Science and Engineering.Shanghai. 2014: 941-944.
[18] Ghodsi Nahri D, Arabshahi H. Static characterization of InAs/AlGaAs broadband self-assembled quantum dot lasers. TELKOMNIKA Telecommunication Computing Electronics and Control. 2012; 10(1): 55-60.
[19] Li CL, Lu CH, Li JM. Laser Direct Part Marking parameters based on 2D-barcodes quality. Journal of Central South University (Science and Technology). 2015; 46(12): 4488-4496.
[20] Li JM, Lu CH, Wang AQ, Wu YS, Ma Z, Fang XX, et al. Experimental investigation and mathematical modeling of laser marking two-dimensional barcodes on surfaces of aluminum alloy. Journal of Manufacturing Processes. 2016; 21(1): 141-152.