ETASR Engineering, Technology & Applied Science Research Vol. 2, o. 3, 2012, 221 225
Cloud Masking for Remotely Sensed Data Using
Spectral and Principal Components Analysis
Asmala Ahmad
Faculty of Information and Communication Technology Universiti Teknikal Malaysia Melaka
Melaka, Malaysia [email protected]
Shaun Quegan
School of Mathematics and Statistics University of Sheffield Sheffield, United Kingdom
Abstract
! " # $ % "&'$%! ( $
) *! + ) ) ! , + ) (
-(
"&'$% (
Keywords cloud masking; spectral analysis; principal components analysis; reflectance; brightness temperature
I. INTRODUCTION
Typically, 50% of the Earth’s surface is covered by clouds at any given time, where a cloud is defined as a visible mass of condensed water droplets or ice crystals suspended in the atmosphere above the Earth's surface. In remote sensing, clouds are generally characterized by higher reflectance and lower temperature than the background. A thick opaque cloud blocks almost all information from the surface or near surface, while a thin cloud has some physical characteristics similar to other atmospheric constituents. Misinterpretation of clouds may result in inaccuracy of various remote sensing applications, ranging from land cover classification to retrieval of atmospheric constituents (e.g. in air pollution studies).
Several cloud detection and masking studies have been reported in the literature. However, most of these algorithms were designed for a global scale [172], and little effort has been devoted to optimising regional methods. Some regional cloud masking algorithms have been designed for high, low and mid latitude regions, and these customised cloud masking algorithms tend to work best for such regions [374]. Little serious effort has been applied to the equatorial regions, especially South7east Asia [576]. This study considers this issue for the particular case of Malaysia. It uses MODIS Terra data to examine the spectral behaviour of cloud, identify effective MODIS bands for cloud detection and determine suitable cloud detection and masking methods in this region.
II. MATERIALS AND METHODS
This study is based on the MOD021KM product from MODIS Terra. A major advantage of MODIS is its wide range of spectral bands, with 36 spectral bands covering the visible, near infrared and thermal infrared wavelengths. In addition, MODIS, with its swath width of 2330 km, is capable of recording every point on the Earth at least once every two days and has an equatorial crossing time of 10:30 a.m. local time. Thus, it can cover the whole study area (Peninsular Malaysia) in a single day pass with a high frequency of revisit.
MOD021KM contains data in the form of: (1) radiance (Wm7
2 m71sr71) for reflective bands; (2) radiances (Wm72 m71sr71) for
emissive bands; and (3) reflectance (dimensionless) for
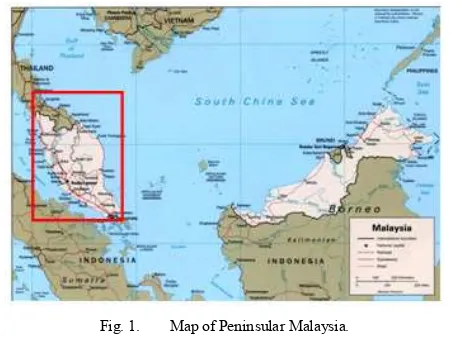
reflective bands. Peninsular Malaysia is located within 6o47’ N,
88o25’ E (upper left), and 1o21’ N, 106o20’ E (lower right) as shown in Figure 1. The haze7free data used in this study is
within the South7east Monsoon season dated 30th January 2004.
Visual analysis was carried out on individual bands and on band combinations (i.e. three bands displayed simultaneously in the red, green and blue channels) prior to further processing. Cloud appears brighter than the surrounding background in the visible spectral region, while it appears darker in the thermal spectral region because of its low cloud7top temperature. This guided the development of cloud detection methods based on spectral analysis; principal component analysis (PCA) was also assessed. The results were then compared with the standard MODIS cloud mask.
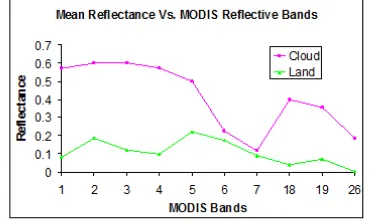
ETASR Engineering, Technology & Applied Science Research Vol. 2, o. 3, 2012, 221 225 was based on their spectral response to cloud, their separability efficiency (the capability of discriminating cloud and other features based on means) and their data quality. The spectral response to cloud and separability efficiency are interrelated as they provide information on the contrast between clouds and other features [2, 7]. Band data quality refers to the radiometric aspects of the data recorded by the bands. From these selection criteria, bands 174 were found to be the most useful for our purpose. An outcome from the separability analysis for the selected MODIS bands is shown in Figure 2 7 cloud exhibits much higher reflectance than land for bands 174; therefore has a high capability of discriminating cloud and land compared to bands 577.
Fig. 2. Plot of mean reflectance versus selected MODIS reflective bands dated 30 January 2004
For each band, visual discrimination of clouds allowed the histogram of their reflectance values to be determined. A preliminary threshold to separate cloud from land and ocean features was determined based on the minimum reflectance value of the cloud histogram. The cloud, land and ocean histograms for band 2 are shown in Figure 3. In the corresponding image, pixels with reflectance larger than the threshold were labelled as cloud and masked in red; the cloud threshold is 0.36. This analysis was repeated for band 1 (0.31), band 3 (0.35) and band 4 (0.32).
Fig. 3. Histogram of cloud, land and ocean reflectance values and the corresponding cloud mask (masked in red).
For clouds, the band 1/band 2 ratio tends to be close to unity [2], and applying a pair of thresholds to this ratio is a widely used method of detecting clouds [778]. Based on histograms of this ratio for cloud, land and ocean pixels, determination of a suitable threshold and generation of the cloud mask were carried out as in the previous section. It was found that cloud pixels have reflectance ratio values from 0.87 to 1.34.
Detection of clouds using satellite thermal infrared measurements has been used as a gross cloud check in the past [3, 8]. It has been shown to perform well at equatorial latitudes because of the low average variation of air temperature [5] and of the fact that there are few high altitude areas in these regions [6]. The cloud threshold and cloud mask were determined after converting the radiance data to brightness temperature for all 16 thermal bands (band 20 to 25 and band 27 to 36) using:
correlated variables into a set of uncorrelated variables called principal components (PCs). It can simplify multivariate data by reducing its dimensionality and bringing out hidden features in the original datasets [9]. It makes use of statistical quantities known as eigenvectors which are derived from the covariance matrix of the original datasets. Each PC is a linear combination of the original variables (typically in remote sensing, spectral bands). The PCs are ordered by the amount of variance they explain in the data, with successive PCs having progressively lower variation [10].
ETASR Engineering, Technology & Applied Science Research Vol. 2, o. 3, 2012, 221 225
)
Fig. 4. Histogram of cloud, land and ocean reflectance values and the corresponding cloud mask (marked in red).
III. EXPERIMENTS AND RESULTS
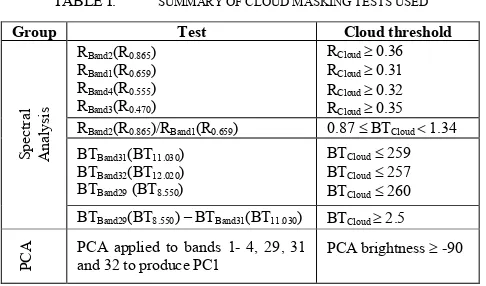
The thresholds applied to bands 174, 29, 31, 32, the band 1/band 2 ratio, the brightness temperature difference band 29 – band 31 and the first principal component (PC1) are shown in Table I. A pixel was labelled as cloudy if it was identified as cloud by at least one of these tests.
IV. ACCURACY ASSESSMENT
The standard MODIS algorithms for detecting daytime cloud over land involves bands 1, 26, 27, 35, the ratio of band 2 and 1, the ratio of band 18 and 2, the difference of band 29 and 31, the difference of band 31 and 32, the difference of band 22 and 31 and the difference of band 20 and 22 [2].
TABLE I. SUMMARY OF CLOUD MASKING TESTS USED
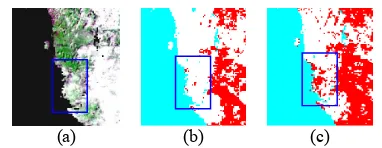
. land7water mask [13], so the following analysis is for the land areas only. The results of the spectral analysis were compared with those from the standard MODIS algorithm by categorising pixels into four types: (1) detected as cloud by both approaches; (2) detected as cloud by the spectral analysis but noncloud by the MODIS standard cloud mask; (3) detected as cloud by the standard MODIS cloud mask but noncloud by the spectral analysis; and (4) not detected as cloud by both. The results are summarised in Table II. 20.8% of the pixels over land were detected as cloud and 69.1% as noncloud pixels by both the spectral analysis and the MODIS cloud mask. Results are also depicted in Figure 5. 9.5% of the pixels were detected as cloud by the spectral analysis but noncloud by the MODIS analyses are not available, so we have based our assessment of the different methods on visual inspection of reference images containing sparse cloud patches (an example is shown in Figure 7a; bands 1, 2 and 3 displayed in channels red, green and blue respectively). It was found that in most places, the spectral analysis (shown in Figure 7c) is capable of detecting more cloud than the standard MODIS cloud mask (shown in Figure 7b) and yields a better match to the reference image. This is easily seen in the blue rectangle in Figure 7, where the clearly visible cloud cover is detected by the spectral analysis but missed by the MODIS cloud mask. This area consists of a mountainous range known as the Kledang Range, where conditions are suitable for the development of stratus and lenticular cloud. When the mountain is warmer than the surrounding air, cumulonimbus and cumulus clouds also tend to form.
Subsequently, we compared our analysis with a cloud mask produced using a supervised classification algorithm (maximum likelihood). Training pixels were obtained by manually delineating cloud and cloud free polygons within the scene [14]. Undeniably, this cloud mask cannot be considered as a reference cloud mask per se, since it does not necessarily possess a better precision than our cloud mask and its accuracy is unknown. However the level of agreement of two cloud masks created with different approaches provides valuable information about the performance of both cloud masks. The agreement between both cloud masks was described by a confusion matrix (for cloud and non cloud), in which classification accuracy and kappa coefficient were used as performance indicator [15]. The spectral analysis produced classification accuracy of 98% with kappa coefficient 0.95, whereas the MODIS cloud mask yielded classification accuracy of 87% with kappa coefficient of 0.75. Hence, the spectral analysis is seen to perform better than the MODIS cloud mask.
V. DISCUSSION
ETASR Engineering, Technology & Applied Science Research Vol. 2, o. 3, 2012, 221 225
*
The spectral analysis and the MODIS cloud mask disagree on 10.1% of the pixels because of differences between the individual tests used in both methods and how they are combined. Consequently, they tend to be sensitive to different types of clouds. Unlike the spectral analysis, the MODIS cloud mask does not use band 2 to 4 (for low cloud) and band 29 to 32 (for high cloud), which has a high separability between cloud and noncloud features, thus tend to miss certain types of clouds.
TABLE II. CONFUSION MATRIX OF MODIS CLOUD MASK AND SPECTRAL ANALYSIS
Detected as cloud by both spectral/PCA mask and MODIS Cloud Mask Detected as cloud by spectral/PCA mask but not cloud by M ODIS Cloud Mask Detected as cloud by M ODIS Cloud Mask but not cloud by spectral/PCA mask Not detected as cloud in both spectral/PCA mask and MOD IS Cloud Mask
Fig. 5. Comparison between cloud cover detected by the standard MODIS cloud mask and by the spectral analysis.
TABLE III. CONFUSION MATRIX OF MODIS CLOUD MASK AND PCA
PCA (%)
Fig. 6. Comparison between clouds detected by the standard MODIS cloud mask and the PCA.
(a) (b) (c)
Fig. 7. Reference image (a), the MODIS cloud mask (b) and the mask derived from the spectral analysis (c). Cloud is indicated by bright areas in (a)
and red areas in (b) and (c).
The MODIS cloud mask is designed for global applications, and hence contains features that are irrelevant in tropical latitudes (e.g., tests to distinguish cloud from snow cover). Thus it may not be well suited to such regions, with their special geographical (location and topography), weather (atmospheric water vapor and aerosol concentrations) and radiative transfer conditions (variable path length, emissivity and reflectance) [11712]. Consequently, the optimal spectral thresholds for tropical areas do not necessarily serve for other latitudes [5].
Despite the quite different approach used in the PCA, surprisingly good agreement (91.7%) with the MODIS cloud mask was found. This indicates that cloud and noncloud have distinct signatures that emerge in the statistical data7based approach of PCA, as well as in the rule7based approach of the spectral analysis. Further work is needed to investigate the weightings of the channels in the PCA analysis, and to compare them with how information is exploited in the spectral rule7 based approach.
The comparison of the spectral analysis and PCA with the standard MODIS cloud mask shows that the spectral analysis is more reliable when assessed against reference images. The spectral analysis is simpler than the MODIS cloud mask because contains fewer tests, yet gives a higher agreement when compared against the mask produced using a supervised classification algorithm.
VI. CONCLUSION
A spectral analysis based on histogram analysis to set thresholds for detection of clouds is found to be more suitable for tropical conditions than the global MODIS cloud mask, due its implicit allowance for local conditions. Cloud detection by the use of the PCA indicates that cloud regions have distinct statistical signatures, but the spectral analysis is more reliable.
ACKNOWLEDGMENT
The authors would like to thank the Malaysian Ministry of Higher Education for funding this study.
REFERENCES
[1] W. B. Rossow, Gardner, “Cloud detection using satellite measurement of infrared and visible radiances for ISCCP”. Journal of Climate, Vol. 6, pp. 2341 – 2369, 1993
ETASR Engineering, Technology & Applied Science Research Vol. 2, o. 3, 2012, 221 225
/
Discriminating Clear7Sky from Cloud with MODIS 7 Algorithm Theoretical Basis Document. Products: MOD35. ATBD Reference Number: ATBD7MOD706, Greenbelt: MODIS Cloud Mask Team, 2002 [3] R. W. Saunders, “An automated scheme for the removal of cloud
contamination form AVHRR radiances over Western Europe”, International Journal of Remote Sensing, Vol. 7, pp.867 – 886, 1986 [4] A. M. Logar, D. E. Lloyd, E. M. Corwin, M. L. Penaloza, R. E. Feind,
T. A. Berendes, K. Kuo, R. M. Welch, “The ASTER polar cloud mask”, IEEE Transactions on Geoscience and Remote Sensing, Vol. 36, No. 4, pp. 1302 – 1312, 1998
[5] G. B. Franya, A. P. Cracknell, “A simple cloud masking approach using NOAA AVHRR daytime data for tropical areas”, International Journal of Remote Sensing, Vol. 16, No. 9, pp.1697–1705, 1995
[6] J. Bendix, R. Rollenbeck, W. E. Palacios, “Cloud detection in the Tropics – a suitable tool for climate – ecological studies in the high mountains of Equador”, International Journal of Remote Sensing, Vol. 25, No. 21, pp.4521 – 4540, 2004
[7] P. H. Swain, S. M. Davis, 1978. Remote Sensing: The Quantitative Approach. New York: McGraw7Hill.
[8] R. W. Saunders, K. T. Kriebel, “An improved method for detecting clear sky and cloudy radiances from AVHRR data”, International Journal of Remote Sensing, Vol. 9, No. 1, pp.123 –150, 1988
[9] W. P. Loughlin, “Principal component analysis for alteration mapping”, Photogrammetry Engineering and Remote Sensing, Vol. 57, No. 9, pp.116371169, 1991
[10] D. W. Hillger, J. D. Clark, “Principal component image analysis of MODIS for volcanic ash. Part 1: Most important bands and implications
for future GOES imagers”, Journal of Applied Meteorology, Vol. 41, No. 10, pp. 98571001, 2002
[11] A. T. A Jose, G. R. Francisco, P. L. Mercedes, M. Canton, “An automatic cloud7masking system using backpro neural nets for AVHRR scenes”, IEEE Transactions on Geoscience and Remote Sensing, Vol. 41, No. 4, pp. 8267831, 2003
[12] S. R. Yhann, J. J. Simpson, “Application of neural networks to AVHRR cloud segmentation”, IEEE Transactions on Geoscience and Remote Sensing, Vol. 33, No. 3, pp. 5907604, 1995
[13] C. O. Justice, E. Vermote, J. R. G. Townshend, R. Defries, D. P. Roy, D. K. Hall, V. V. Salomonson, J. L. Privette, G. Riggs, A. Strahler, W. Lucht, R. B. Myneni, Y. Knyazikhin, S. W. Running, R. R Nemani, W. Zhengming, A. R. Huete, W. Van Leeuwen, R. E. Wolfe, L. Giglio, Muller, P. Lewis, M. J. Barnsley, “The Moderate Resolution Imaging Spectroradiometer (MODIS): land remote sensing for global change research”, IEEE Transactions on Geoscience and Remote Sensing, Vol. 36, No. 4, pp.122871249, 1998
[14] F. Sedano, P. Kempeneers, P. Strobl, J. Kucera, P. Vogt, L. Seebach, J. San7Miguel7Ayanz, “A cloud mask methodology for high resolution remote sensing data combining information from high and medium resolution optical sensors”, ISPRS Journal of Photogrammetry and Remote Sensing, Vol. 66, pp. 5887596, 2011