::s:n
DJ
:r
,....m
tD
3
...
,...
,..."'
DJ ...
,....
...
"''<
fm
"'
セ@
tD
c.
DJ
...
ISSN 2224- 3224 (Print) ISSN 2225-0956 (Online)
Vo1.7 No.7, 2015
Synthesis Of Fe
30
4Nanoparticles Of Iron Sand Coprecipitation Method
With Polyethylene Glycol 6000
Nurdin Bukit1*l,Erna Frida2,Pintor Simamora1 Tresia Sinaga1
1
Departement of Physics Faculty ofMatematics and Natural Sciences State University ofMedan
2
University Quality Medan ABSTRACT
This study aimed to obtain a particle size-based nano Fe304 iron sand, determine the effect of Polyethylene
Glycol (PEG) -6000 to be produced from iron sand in synthetic by using coprecipitation method and the nature of magnetization. Synthetic done by mixing natural sand with HCl as solvent and NH40H as a precipitant, as
templates are added PEG-6000 .. Then, characterized by using X-Ray Diffractometer (XRD). Vibrating Sample Magnetometer (VSM) and Fourier Transform Infra Red (FTIR).
From the test results (XRD) shows the crystal size Preparation Fe304 nanoparticles with PEG 6000 (1: 3), (1: 4),
(1: 5) in a sequence that is 14.90 nm, 22:16 nm, 33.11 nm while without PEG 6000 29.08 nm,
Vibrating Sample Magnetometer measurement results (VSM) shows that the value of Ms saturation field for without PEG-6000 Fe304, Fe304 with PEG-6000 (1: 3), (1: 4), (1: 5) respectively 27.9 emu I g, 47.4 emu I g,
35.3 emu I g, 51.7 emu I g and field coercivity (He), each for 0,013 Tesla, 0.022 Tesla, Tesla 0.14, 0.009 Tesla. FTIR results showed that there was a shift peaks indicating increased number of PEG. From each sample came the peak of Fe-0 owned by Fe304 where the wavelength of Fe-0 at sample PEG has a lower value than the
wavelength Fe304 caused the PEG
Key words: Nanoparticles Fe304 , PEG 600, particle size, magnetic properties
1.
INTRODUCTION .Nanoparticles are particles with a size of nanometers, which is approximately 1-100 nm. Nanoparticles into a very interesting study, because of the material that is in nano size particles typically have chemical or physical properties that are superior to large-sized material (bulk). In this case these properties can be altered by controlling the size of the material, setting the chemical composition, surface modification and control of the interactions between the particles.
The magnetic nanoparticles has been developed recently is Fe304, is one phase of the iron oxide is
amphoteric and has a high absorption, (Abdillah, G., 2013) . Compounds Fe304 (FeO.Fe203), black with spinel
inversion shaped structure and containing Fe2 +and Fe3 +, (Gubin, S. F., 2007).
Fe304 last few years has been widely used in various applications, such as a store of information with a
high density, magnetic resonance image formation, delivery systems for medicines, cosmetics, dyes, inks as well as play a role in various separation processes, including adsorption (Y. Wei et al,2011).
The research nanoscale magnetic particles have been carried out, among others, Malik, A., Baqiya, et al , (2007), with PEG-400 and without PEG, (Perdana, F.A. et al , 2013), synthetic Fe304 with template PEG-1000,
using coprecipitation method. (Putri, S.T., 2011), (Nuzzuly, S,et al, 2013), template PEG-4000,(Astuti Geby ,et al,2013 ),iron stone Fe304 using templates PEG-4000.
Fe304 nanoparticles usually can with some chemical synthesis method, such as, reverse micelle method,
microwave plasma synthesis technique sol - gel, freeze drying, irradiaton ultrasound, hydrothermal method, technique of laser pyrolysis, coprecipitation method, and others .
In this study the method to be used is the method of coprecipitation. This method is considered more suitable because it is easier to be done, the materials and procedures used is also much simpler. The advantage of this method is the process uses low temperatures and is easy to control the particle size so that it takes a relatively short time. adapaun purpose of this study to determine the particle size of nano Fe304 made from iron sand,
determine the effect of Polyethylene Glycol (PEG) 6000 and magnetic properties.
2.
METHODS 2.1 Tools and materialsMaterials; Iron sand, HCL, nセohL@ Filter paper. PEG 6000
Chemistry and Materials Research
ISSN 2224- 3224 (Print) ISSN 2225-0956 (Online)
Vol.? No.7, 2015
2.2. Synthesis process Fe304 Method Using coprecipitation
www.iiste.org
istE
Sand iron (Fe304) is obtained from separation using a magnet, then sieved to 200 mesh size. then weighed 20 g
and inserted with a glass beaker to be mixed with 37% HCl 40 ml. The mixture was stirred at 70 o C for 30
minutes in a magnetic stirrer. After stirring process is completed, do the filtering with filter paper PEG-6000 melted by heating at 50
°
C for 15 minutes. PEG-6000 which has been melted added to the resulting solution was the variation Fe304 volume ratio of 1: 3; 1: 4; 1: 5 The results are mixed with a solution ofPEG-6000 conducted by stirring by using (magnetic stirrer), at a temperature of 70 o C for 40 minutes. Then 25% nセoh@ added 30 mlin Fe304 mixture while stirring and. heated by using a magnetic stirrer for 40 minutes at a temperature of 70°C.
Results precipitate formed Fe304 (solid black) separated from the solution which was then washed
repeatedly using distilled water until clean of impurities then filtered .To obtain nano Fe304 powder particles,
sediment is dried in an oven at a temperature of about 70 o C for 2 hours.
2.3 Characterization XRD
Characterization X-Ray Diffractometry (XRD), which is used in room temperature by using a Shimadzu XRD 6100 X-ray diffractometer (40 kV, 30 rnA), Cu Ka radiation which is used scanning rate of 2° I min in the range of29 =5° -70°
2.4 Characterization Vibrating Sample Magnetometer (VSM)
By using Vibrating Sample Magnetometer (VSM) can show the relationship magnetization (M) with an external magnetic field (H) obtained from the hysteresis curve. Characterization is done at the Laboratory of Magnetic -PT BIN-BAT AN using Vibrating Sample Magnetometer (VSM) Oxford types VSM 1.2H
2.5 Characterization FTIR
Characterization by using the tool Bruker FTIR Spectrometer ALPHA of spectroscopy was obtained graph of transmittance against the wavelength, the wave crests obtained from functional groups.
3 RESULTS AND DISCUSSION 3.1 Analysis XRD
XRD characterization performed to analyze the crystal structure of the sample Fe304 • From the XRD data
obtained, to identify peaks of XRD chart by matching the existing peak on the graph with the ICDD database. After that, the XRD data refinement using Rietveld analysis contained in Rietan program. Through the refinement, and its phase structure and lattice parameters that exist in the sample are known. Through the XRD chart, grain size of the sample can also be estimated. Grain size is calculated using the Scherrer. of the x-ray diffraction pattern.
XRD characterization performed to analyze the crystal structure of the sample Fe304• From the XRD data
obtained, to identify peaks of XRD chart by matching the existing peak on the graph with the ICDD database. After that, the data from XRD refinement using Rietveld analysis contained in Rietan program. Through the refinement, and its phase structure and lattice parameters that exist in the sample are known. Through the XRD chart, grain size of the sample can also be estimated. Grain size is calculated using the Scherrer. from ray diffraction pattern
D
=
(kA.)/(BrCose) (1)With Br, K, A. and D, respectively half peak width (FWHM) in radians, Scherrer constant (0.9), the wavelength of the x-ray (1.5406 A), and the diameter of crystallites in the size of nanometers (nm). to determine: (%) Volume fraction of magnetite (Fe304) = (intensity phase sought) I (number-intensity x-ray detectable phase) x
100% (2)
ISSN 2224-3224 (Print) ISSN 2225-0956 (Online)
iStr
Vo1.7 No.7, 2015Table 1 .Analysis Data with XRD
Samples Size (nm) Density Phases other Cubic crystal (g/cm3) Fe304(%) Phases structure with (%) parameters a
(A
Fe304 Non PEG 6000 29.08 5,181 38,47 61,53 8.4045
Fe304 With PEG 1:3 14.90 5,219 48,39 51,61 8.3837
Fe30 4 With PEG 1:4 22.16 5,272 44,41 55,59 8.3557
Fe304 With PEG 1:5 33.11 5,200 53,2 46,8 8.3557
(131
1000
l.S®
...,_
iセL@
•. , ...
(e)..
· r•wssJV...,.
"!
...,...._ (b).•
0
0 20 40
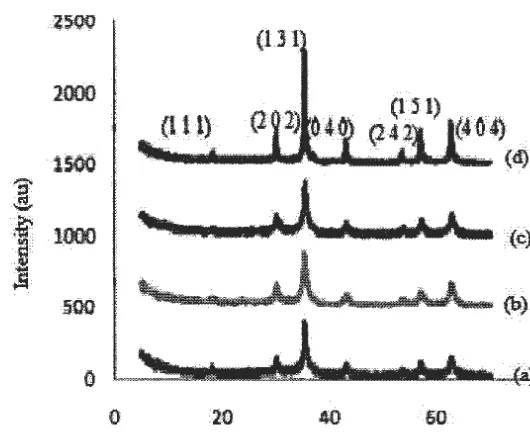
Figure. 1. Pattern XRD for Fe304 samples with multiple treatment,(a) non PEG, (b)with PEG (1:3) ,(c) with
PEG (1:4), (d) with PEG (1 :5)
From Figure l shows the X-ray diffraction pattern of the sample with a variation ratio of PEG-6000 and without PEG-6000. From the figure it can be seen that the peak formed a widening with increasing volume expansion ratio variation PEG-6000 which indicates the size of the crystals get smaller. Based on the analysis using search programs match and qualitative analysis using the method Hanawalt, that the sample containing 100% Fe304
phase. Not found also the PEG phase in the sample. This means that PEG-6000 did not come to react and simply act as a template only. as well as the results of the study (Perdana, F.A. et al, 2013).
3.2. Analysis Vibrating Sample Magnetometer (VSM) .
Magnitudes important in determining the magnetic properties by magnetic hysteresis curve is the saturation (Ms), field coercivity (He) and the remanent magnetization (Mr). The value of saturation magnetization, known as saturated magnetization demonstrate the ability of nanoparticles to maintain irreversibility magnetic domains when they are known outside the magnet. Coercivity field is a field magnitude needed to make the magnetization is zero. The greater the value the stronger is the nature of magnetism. While the remanent magnetic material showed ability when given external field.
[image:4.612.54.495.86.201.2] [image:4.612.147.412.252.475.2]Chemistry and Materials Research
ISSN 2224- 3224 (Print) ISSN 2225-0956 (Online)
Vo1.7 No.7, 2015
-1 .80
60.00
-60.DO
] H(fesla)
(a)
[image:5.612.118.445.82.300.2]0.50
1 .(JO1 . SO
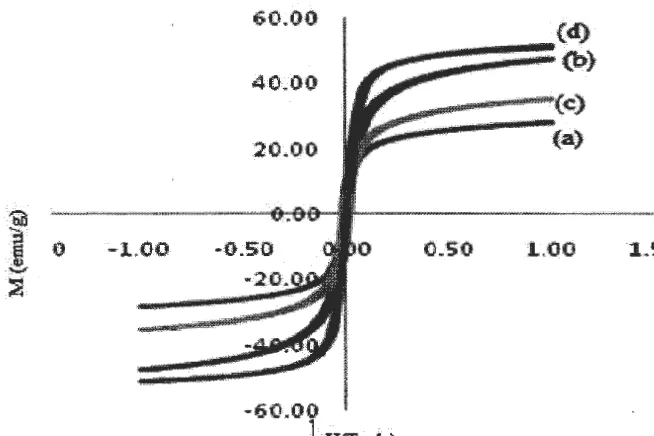
Figure 2 VSM images of Fe304, wit Diffrent Ratios of Fe304 and PEG 6000
(a) Without PEG 6000, (b) 1:3 ,(c) 1:4 ,and (d) 1:5
www.iiste.org
For more details, the value of saturation magnetization, coercivity field and remanent magnetization of each sample are shown in Table 4.2.
Table 2. The Data Analysis Results VSM
Samples
Size
Ms
He
Mr
(nm)
(emu/g)
(Tesla)
(emu/g)
Fe30 4 non PEG 29.08 27,9 0,013 10.3
Fe304 with PEG 1:3 14.90 47,4 0,022 11,7
Fe304 with PEG 1:4 22.16 35,3 0,14 12,3
Fe304 with PEG 1:5 33.11 51,7 0,009 18,1
From Table 2 it can be seen also that the value of He (coercivity field) Fe304 without PEG-6000 obtained around
0,033Tesla while Fe304 with the addition ofPEG-6000 (1: 3), (1: 4), (1 : 5) consecutive which is about 0,022 T,
0.14 T, 0,009 T. From Table .2 shows a strong relationship between the size of the crystals with magnetic properties.
This research is in accordance with previous studies which, saturation magnetization (Ms) for Fe304 powder
with PEG-400 higher compared without PEG-400 (Malik, et al., 2007) but not in accordance with research that
states the value of remanent magnetization of Fe304 without PEG-I 000 higher than Fe304 with the addition of
PEG-1000. In other words, the value of He (coercivity field) and Mr (remanent magnetization) tends to decrease with the decrease of crystal size (Perdana, et al. , 2013).
[image:5.612.58.441.412.513.2]ISSN 2224-3224 (Print) ISSN 2225-0956 (Online) Vol.? No.7, 2015
It can be concluded that the samples Fe304 with Peg-6000 (1: 3), which has the smallest size and has a
larger magnetic properties compared to other large particle size resulting from Fe304 with Peg-6000 (1: 4), Fe304
with Peg-6000 (1 : 5) and Fe304 without PEG-6000.
100
90
....
80セ@
--....
G)
70
0
c m
--
E 60en
c
セ@
I'- 50
40
30
a. n ano:particte non IPE G
4000 3000 2000
-1
Waven umber (om )
b. 1:3
1000
b
d
c
a
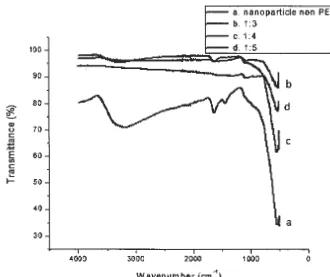
Figure 3 . The results Fe304 Characterization Using FTIR (a) Without PEG 6000, (b) 1:3 ,(c) 1:4 ,and (d) 1:5
0
3.3 Analysis Fourier Transform Infra Red ( FTIR)
FTIR results on a sample Figure 3 showed the presence of peaks 3172.64 which showed the presence of OH
groups. 540.38 peak showed the presence of clusters Fe- 0
In the sample b shows the peak 3114.13 which is the OH group which indicate the presence of PEG. 1613.78 peaks showed the presence of carboxylic groups that are building blocks of PEG . Peak of 1077.53 is a hydroxyl group bonded to hydrogen in the surface of the iron oxide, as well as water molecules adsorbed on the surface of the magnetic particles 513.21 peak shows the Fe group- 0.
At the peak of 3229.15 sample c shows that an OH group which indicate the presence of PEG. 1640.04 peaks showed the presence of carboxylic groups that are building blocks of PEG. peak of 529.84 showed the presence of clusters Fe - 0 owned by Fe304
At the peak of 3819.90 sample d appears that the OH group which indicate the presence of PEG . Peak of 1069.13 is a hydroxyl group bonded to hydrogen in the surface of the iron oxide, as well as water molecules adsorbed on the surface of the magnetic particles . 529.38 peak shows the Fe group - 0 . (Zhao, et al., 2010) (Lopez, et al.2010).
From the results of FTIR showed that there was a shift peaks indicating increased number of PEG. From each sample came the peak of Fe-0 owned by Fe304 where the wavelength of Fe-0 at sample PEG has a lower value
than the wavelength Fe304 caused the PEG . 4. CONCLUSION
Chemistry and Materials Research
ISSN 2224- 3224 (Print) ISSN 2225-0956 <Online)
Vol.? No.7, 2015
www.iiste.org
Vibrating Sample Magnetometer measurement results (VSM) shows that the value of Ms saturation field for without PEG-6000 Fe304, Fe304 with PEG-6000 (1: 3), (1: 4), (1 : 5) respectively 27.9 emu I g, 47.4 emu I g, 35.3 emu I g, 51.7 emu I g and field coercivity (He), each for 0,013 Tesla, Tesla 0.022, 0.14 Tesla, Tesla 0,009 FTIR results showed that there was a shift peaks indicating increased number of PEG. From each sample came the peak of Fe-0 owned by f・ SP セ@ where the wavelength of Fe-0 at sample PEG has a lower value than the wavelength Fe304 caused the PEG
ACKNOWLEDGMENTS
The author would like to thank the Ministry the Higher Education research and technology at the expense of fundamental research grant budget year 2015 with contract: 016A I UN33.8 I KU I 2015 and Laboratory of Physics and Chemistry Laboratory facility Unimed
S._REFERENCES •
A.Yan ,Xliu,G.Qiu,H.Wu,R.Yi,N.Zhang,J.Xu ,2008 , Solvothermal Synthesis and charactherization of size controlled Fe304 nanoparticles,Journal Alloys and Coumpound, 458, 487-491.
Abdillah, G., 2013, Sintetis, Karakterisasi dan Uji Stabilitas Fe304 Asam Askorbat, Skripsi,
Fakultas Sain dan Teknologi, Universitas Islam Negeri Sunan Kalijaga, Yogyakarta. Astuti Geby Claudia, Noraida, and Melvira Ramadhani, (2013), Synthesis of Fe304
Nanoparticles from Ironstone Prepared by Polyethylene Glycol 4000 journal makara of scince series 17 ,2 ,.58-62.
Gubin, S. F., (2007) . Magnetic Nanoparticles, Russian Academy of Sciences, Wiley-VCH Verlag GmBH , Co.KgaA
Javier A. Lopez, Ferney Gonzalez, Flavio A. Bonilla, Gustavo Zambrano , Maria E. G6mez ,(2010 ),Synthesis And Characterization Of Fe304 magnetic Nanofluid ,Revista
Latinoamericana de Metalurgia y Materiales; 30 (1): 60-66
Malik, A., Baqiya dan Darminto, (2007), Penggunaaan Polietilenglikol-400 pada sintetis nanopartikel Fe304
dan Karakterisasi struktur serta kemagnetannya, Jurnal Sains Material Indonesia, , 102-105
Nuzzuly, S., Kato, T., Iwata, S., dan Suharyadi, E., (2013), Pengaruh Konsentrasi Polyethylene Glycol (PEG)
pada Sifat Kemagnetan Nanopartikel Magnetik Peg-Coated Fe304• jurnal fisika Indonesia, 50,(XVII)
,(35-40).
Perdana, F.A., Malik.,A.B ., Mashuri., Triwikantoro, dan Darrninto, (2013) . Sintetis Nanopartikel Fe304 dengan
Template PEG-1000 dan Karakterisasi Sifat Magnetiknya, Jurnal Material dan Energi Indonesia .1, No.Ol ,.1-6.
Putri, S.T., (2011), Pengaruh Temperatur Sintering Terhadap Ukuran Nanopartikel Fe304 menggunakan
template PEG-4000, Skripsi.FMIPA, Universitas Andalas.
Zhao Dong-Lin., Pan Teng, Ying Xu, Qi-Sheng Xia, Jin-Tian Tang ,(2010) ,Magnetic and inductive heating properties of Fe304 /polyethylene glycol composite nanoparticles
with core-shell structure, Journal of Alloys and Compounds 502 , 392-395.