ANGGA YUDHISTIRA
GRADUATE SCHOOL
BOGOR AGRICULTURAL UNIVERSITY
BOGOR
STATEMENT OF THESIS, SOURCE OF INFORMATION
AND COPYRIGHT*
I hereby declare that thesis titled Analysis of the Competitiveness of Pangasius Fish Farming in Kota Gajah Sub-District, Lampung Tengah District, Lampung Province, was independently composed by me under the advisory committee supervision and has not been submitted to any other universities. Source of information derived or quoted from works published and unpublished from other writers have been mentioned in the text and listed in the bibliography at the end of this thesis.
I hereby assign the copyright of my thesis to the Bogor Agricultural University.
Bogor, May 2015
Angga Yudhistira
H451110511
SUMMARY
ANGGA YUDHISTIRA. Analysis of the Competitiveness of Pangasius Fish Farming in Kota Gajah Sub-District, Lampung Tengah District, Lampung Province. Supervised by HARIANTO, NUNUNG KUSNADI, STEPHAN WESSELS and BERNHARD BRÜMMER.
This study examines data on pangasius fish grow-out business as practiced through earthen pond aquaculture system in Kota Gajah (KoGa) Sub-District, Lampung Tengah District, Lampung Province, Indonesia. KoGa is famous in the utilization of local resources as cheap and sustainable input for pangasius fish farming business. The study estimates the competitive and comparative advantages of the pangasius fish farming business using the Policy Analysis Matrix (PAM) method to determine the Private Cost Ratio (PCR) and Domestic Resource Cost Ratio (DRC). Sensitivity analysis was performed to measures the responsiveness of the PCR and DRC to the changes of key parameters in pangasius fish farming.
The result shows that pangasius fish farming in KoGa has competitive and comparative advantage, as confirmed by PCR and DRC that less than one. Trade policy on output, especially policy on controlling the imported pangasius fish and the feed pellet machine subsidy, has given the local pangasius fish farmer an opportunity to sell their product 12.34 percent higher than its world market price. Policy on inputs is not really providing protection to the pangasius fish farmers but still generate positive private and social profits. Divergences in domestic factors are limited to feed pellet machine subsidy that really helps the farmer to produce low cost fish feed with local sustainable ingredients. Comparative advantage of pangasius fish farming in KoGa is sensitive to the change in pangasius fish fillet FOB price and alternative fish feed price. Whilst the competitive advantage is sensitive only to the changes in the alternative fish feed price.
RINGKASAN
ANGGA YUDHISTIRA. Analisis Daya Saing Peternakan Ikan Patin di Kecamatan Kota Gajah, Kabupaten Lampung Tengah, Provinsi Lampung. Dibimbing oleh HARIANTO, NUNUNG KUSNADI, STEPHAN WESSELS, dan BERNHARD BRÜMMER.
Studi ini menguji data usaha pembesaran ikan patin yang dilakukan dengan menggunakan sistem budidaya ikan di kolam tanah di Kecamatan Kota Gajah (KoGa), Kabupaten Lampung Tengah, Provinsi Lampung, Indonesia. KoGa terkenal akan keberhasilannya dalam pemanfaatan sumberdaya lokal sebagai input yang murah dan berkelanjutan untuk usaha budidaya ikan patin. Studi ini memperkirakan keunggulan kompetitif dan komparatif usaha budidaya ikan patin dengan menggunakan metode Policy Analysis Matrix (PAM) untuk menentukan Private Cost Ratio (PCR) dan Domestic Resource Cost Ratio (DRC). Analisis sensitivitas dilakukan untuk mengukur responsivitas dari PCR dan DRC terhadap perubahan parameter kunci dalam usaha budidaya ikan patin.
Hasil studi ini menunjukkan bahwa usaha budidaya ikan patin di KoGa memiliki keunggulan kompetitif dan komparatif yang ditujukkan dengan nilai PCR dan DRC yang kurang dari satu. Kebijakan perdagangan yang kuat pada output telah memberikan kesempatan kepada petani pembudidaya ikan patin untuk menjual outputnya dengan harga 12.34 persen lebih tinggi dari harga yang berlaku di pasar dunia. Kebijakan perdagangan pada input belum benar-benar memberikan perlindungan terhadap petani pembudidaya ikan patin namun tetap memberikan keuntungan privat dan sosial yang positif. Selisih di faktor domestik terbatas pada subsidi mesin pembuat pakan yang mana sangat membantu petani ikan patin untuk membuat pakan ikan murah dengan menggunakan sumberdaya lokal yang berkelanjutan. Keunggulan komparatif pada usaha budidaya ikan patin di KoGa sensitif terhadap perubahan harga FOB fillet ikan patin dan harga pakan alternatif. Sedangkan keunggulan kompetitif sensitif hanya terhadap perubahan harga pakan alternatif.
© All Rights Reserved by Bogor Agricultural University, 2015
Copyright Reserved
It is prohibited to quote part or all of this paper without including or citing the source. Quotations are only for purposes of education, research, scientific writing, preparation of reports, critics, or review an issue; and those are not detrimental to the interest of the Bogor Agricultural University.
ANALYSIS OF THE COMPETITIVENESS OF PANGASIUS
FISH FARMING IN KOTA GAJAH SUB-DISTRICT,
LAMPUNG TENGAH DISTRICT, LAMPUNG PROVINCE
ANGGA YUDHISTIRA
Thesis
as one of requirements to obtain a degree of
Magister Sains in
the Study Program of Agribusiness
GRADUATE SCHOOL
BOGOR AGRICULTURAL UNIVERSITY
BOGOR
ACKNOWLEDGMENT
All praise to Allah, the Almighty God, for His blessing. For helping and supporting me in finishing this research, I would like to thank many people. I would like to express my special thanks of gratitude to my first supervisors, Dr Ir Harianto MS. Without his guidance and full support, this thesis would not have been possible. I also would like to thank my second supervisor, Dr Ir Nunung Kusnadi MS for helping me with the substance in my research. My grateful thanks are also extended to Prof Dr Bernhard Brümmer and Dr Stephan Wessels as my supervisors in Göttingen University, Germany.
I would like to offer my special thanks to Prof Dr Rita Nurmalina MS as the coordinator of Magister Sains Agribisnis program and Prof Dr Stephan von Cramon-Taubadel as the program coordinator for the specialization in
“International Agribusiness and Rural Development Economics” in respect of
Sustainable International Agriculture, the joint degree program between the Magister Sains Agribisnis, Bogor Agricultural University and Master of International Agribusiness and Rural Development, Georg August Universität Göttingen.
I also wish to thank H. Wahidin, as Chairman of GAPOKDAKAN Karya Mina Manunggal, Kota Gajah Sub-District; Toha Mohtar, S.St.Pi., as the fisheries instructor at Balai Penyuluhan Pertanian, Perikanan, dan Kehutanan (BP3K), Kota Gajah Sub-District; and Dedi Anwar Sipayung, S.Pi., as Pelaksana Tugas Kepala Seksi Pembenihan Ikan, Dinas Peternakan dan Perikanan, Pringsewu District, for providing me the pangasius data.
I would like to express my special appreciation to Beasiswa Kalimantan Timur Cemerlang - Pemerintah Daerah Kalimantan Timur and Beasiswa Unggulan - Biro Perencanaan dan Kerjasama Luar Negeri Kementerian Pendidikan Nasional for funding my study.
Moreover, special thanks to my friends in SIA program, BDP 42, MSA IPB and PPI Göttingen for supporting me in my study. Finally, I would like to thank my family, my parents for their support and encouragement throughout my study.
Bogor, May 2015
CONTENTS
CONTENT S viii
LIST OF TABLES ix
LIST OF FIGURES ix
LIST OF APPENDICES ix
LIST OF ABBREVIATIONS x
1 INTRODUCTION 1
Background 1
Problem Statement 5
Research Objectives 6
Benefits of the Study 6
Scope and Limitation of the study 6
2 LITERATURE REVIEW 7
Production Technology of Pangasius Fish 7 World Market of Pangasius Fish 9 Indonesia's Market of Pangasius Fish 11 Government policies related to pangasius fish farming in KoGa 11
3 FRAMEWORK 12
Comparative and Competitive Advantages 12 Agricultural Policy Analysis 13 Classification of Price Policies 13
Output Policy 14
Trade Policy 15
Tradable Input Policy 16
Non-tradable Input Policy 17
Policy Analysis Matrix 18
Previous Research 18
Operational Framework 19
4 RESEARCH METHODOLOGY 21
Location and time 21
Types and Sources of Data 21
Empirical Analysis 21
Identities of PAM Analysis 22 Input and Output Social Prices Determination 25
Sensitivity Analysis 29
5 RESULTS 29
Private and Social Profitability 29 Competitive and comparative advantages 31
Input-Output Transfers 33
Sensitivity Analysis 35
Discussion 36
6 CONCLUSIONS AND RECOMMENDATIONS 41
Conclusions 41
REFERENCES 43
APPENDICES 48
BIOGRAPHY 57
LIST OF TABLES
1. Aquaculture production by major commodity, 2008-2012 2 2. Volume and value of fishmeal export-import 3 3. Volume and target production of pangasius fish in Indonesia 4 4. Volume of pangasius fish culture production by province in Sumatera 5 5. World pangasius fish producers 9 6. Minapolitan and Fisheries Industrialization programs related to
pangasius fish farming in KoGa 12 7. Classification of commodity price policy 13
8. Policy Analysis Matrix 18
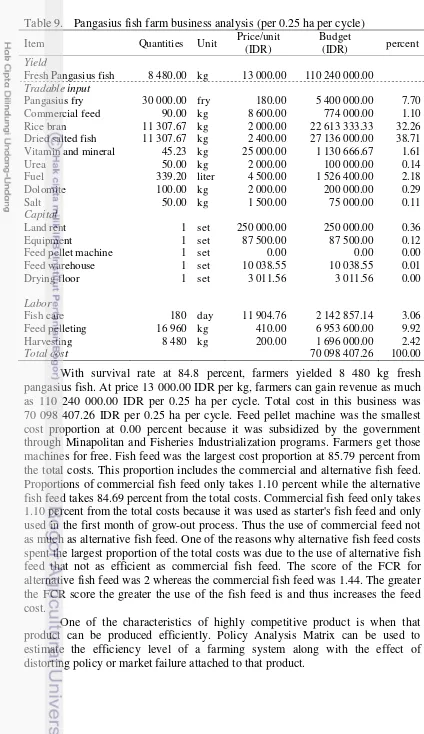
9. Pangasius fish farm business analysis (per 0.25 ha per cycle) 30 10. Policy Analysis Matrix analysis (IDR) 31 11. Identities of Policy Analysis Matrix 31 12. PAM sensitivity analysis results for pangasius fish fillet FOB price 35 13. PAM sensitivity analysis results for alternative fish feed prices 36
LIST OF FIGURES
1. Fisheries production by volume in Indonesia 1
2. Pangasius fish 7
3. Positive subsidy policy on output 15
4. Trade policy on output 16
5. Tradable input policy 17
6. Non-tradable input policy 17
7. Operational framework 20
LIST OF APPENDICES
1. Social valuation of pangasius fish 48 2. Calculation of alternative fish feed production per 0.25 ha per cycle 48
3. Social valuation of urea 49
4. Social valuation of salt 49
5. Shadow exchange rate 2012 49
LIST OF ABBREVIATIONS
BAP : Best Aquaculture Practices (issued by FAO)
BP3K : Balai Penyuluhan Pertanian, Perikanan, dan Kehutanan
/ Agricultural, Fishery and Forestry Extension Centers BPS : Badan Pusat Statistik / Statistics Indonesia
CBIB : Cara Budidaya Ikan yang Baik / Best Aquaculture Practices (issued by Ministry of Marine Affairs and Fisheries)
CIF : Cost, Insurance and Freight
DJP2HP : Direktorat Jendral Pengolahan dan Pemasaran Hasil Perikanan / Directorate General of Fisheries Product
Marketing and Processing
DJPB : Direktorat Jenderal Perikanan Budidaya / Directorate General of Aquaculture
FAO : Food and Agriculture Organization
FAS-USDA : Foreign Agricultural Service - United States Department of Agriculture
FOB : Free on board
GAPOKDAKAN : Gabungan Kelompok Pembudidaya Ikan / Joint-Group of Fish Farmers
IDR : Indonesian Rupiah
KJA HDPE : Keramba Jaring Apung HDPE / High-Density Poly
Ethylene floating net cage
KKP : Kementerian Kelautan dan Perikanan / Ministry of
Marine Affairs and Fisheries KoGa : Kota Gajah Sub-District MT : Metric Ton
PAM : Policy Analysis Matrix
POKDAKAN : Kelompok Pembudidaya Ikan / Group of Fish Farmers PUMP : Pengembangan Usaha Mina Pedesaan / Fisheries rural
business development
SNI : Standar Nasional Indonesia / National Standardization
Agency of Indonesia
UPI : Unit Pengolahan Ikan / fish processing unit
UN COMTRADE : The United Nations Commodity Trade Statistics Database
1 INTRODUCTION
Background
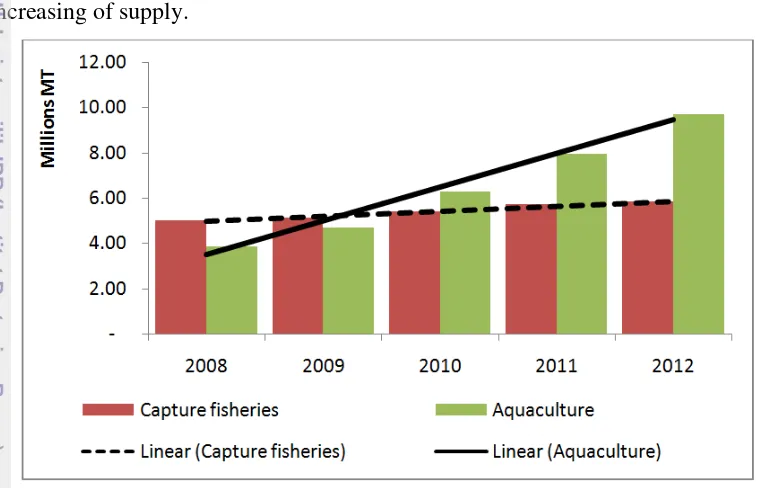
Demand for fisheries commodities as a source of animal protein is expected to rise due to the increase of population and people's awareness of high quality nutritional needs. In 2004, fish consumption per capita in Indonesia reached 22.58 kg per capita per year. In 2012, it increased to 33.89 kg per capita per year. The average growth of fish consumption is 5.21 percent per year (KKP, 2013b). The increasing demand of fisheries product should be followed by the increasing of supply.
Figure 1. Fisheries production by volume in Indonesia
Source: KKP (2012)
Table 1. Aquaculture production by major commodity, 2008-2012 highest production growth in Indonesia. The average production growth of pangasius fish reached 53.19 percent per year from 2010-2012 which followed by walking catfish and seaweed at 34.86 and 29.03 percent per year respectively. The high production growth allows Indonesia to produce pangasius fish from 147 888 MT per year in 2010 to 347 000 MT per year in 2012. The increase of pangasius fish production cannot be achieved without supports from the government through Minapolitan and Fisheries Industrialization programs. It is one of the ten leading aquaculture commodity in Minapolitan program and one of the seven main commodities in the Fisheries Industrialization program.
Based on the Regulation of the Minister of Marine Affairs and Fisheries PERMEN-KP No.12/MEN/2010 about "Minapolitan", the definition of Minapolitan program is a region-based economic development concept. It is built upon the principles of integration, efficiency, quality and acceleration of the fisheries production. Minapolitan area is a part of region that has primary function as the center of economic growth, which consists of production center, processing center, marketing, services and/or other supporting activities. Fisheries Industrialization program is an advanced program of Minapolitan. Regulation of the Minister of Marine Affairs and Fisheries PERMEN-KP No.27/MEN/2012 about "General Guidelines of Fisheries Industrialization Program" stated that the definition of Fisheries Industrialization program is an integrated production systems of fisheries commodities from the upstream to the downstream in order to improve the scale and quality of production, productivity, competitiveness and value-added of marine and fisheries resources in a sustainable manner.
Ministry of Marine Affairs and Fisheries makes a collaboration work with various organizations, institutes and ministries in order to achieve those targets. Minapolitan and Fisheries Industrialization programs policies are applied nationally and locally. It covers fisheries in general and to some specific leading commodities. Some of Minapolitan and Fisheries Industrialization programs in general at national level in aquaculture sector are synergy and collaboration across sectors between Ministry of Marine Affairs and Fisheries with Ministry of Public Work, Directorate General of Electricity Ministry of Energy and Mineral Resources, National Land Agency and the banking sector. Ministry of Marine Affairs and Fisheries also delegating the authority of certification to 15 provinces in order to accelerate Best Aquaculture Practice (BAP or CBIB - Cara Budidaya Ikan yang Baik) certification through the Regulation of the Directorate General of Aquaculture, Ministry of Marine Affairs and Fisheries, No.30/PER-DJPB/2013 (DJPB, 2013b).
In 2013, Ministry of Marine Affairs and Fisheries issued a variety of programs that supporting the production of pangasius fish. For example: monitoring the availability of pangasius fish fry, providing high quality pangasius fish brood stock, applying the BAP/CBIB in pangasius fish production, developing certified and registered fish feed, forming the group of fish farmers, developing pilot project of fish ponds, procuring of KJA HDPE (high-density poly ethylene floating net cage), providing excavator, providing feed pellet machine, granting PUMP (fisheries rural business development), providing fish vaccine and developing integrated fish health service post, fish vaccine training, developing UPI (fish processing unit) and fishmeal processing unit for pangasius fish and maintaining cooperation and support from various parties such as associations and fish feed producers (DJPB, 2013b). Despite of the rise of aquaculture production the import of its input is also increased, in this case fishmeal as fish feed main other aquatic invertebrates, unfit for human consumption; greaves. Table 2 shows us the volume and value of fishmeal export and import from 2009 to 2013.
Table 2. Volume and value of fishmeal export-import
Fishmeal (HS-230120) Year Source: UN COMTRADE (2015); *) re-imports are excluded
fishmeal was charged by value added tax of 10 percent. However, since the late of 2010, the value added tax for imported fishmeal had been deleted. The deletion of this policy has risen up the import of fishmeal in the next year up to 65 percent from 61 036 MT in 2010 to 100 720 MT in 2011.
According to the Joint of Animal Feed Company (Gabungan Perusahaan Makanan Ternak, GPMT), which is now known as the Association of Animal
Feed Manufacturer Indonesia (Asosiasi Produsen Pakan Indonesia, APPI) in
GPMT (2013), 75 percent of the national requirement of fishmeal met from imports. GPMT data mention, fishmeal demand in Indonesia is 100 000-120 000 MT per year, where a total of 75 000-80 000 MT of which met from imports. The use of local fishmeal is maximum of 50 000 MT per year due to the failure to meet the required quality specifications of feed manufacturers. Although the price of local fishmeal with imported fishmeal are not much different.
Although the pangasius fish production volume is increasing but it cannot meet its annual target production. This shows that the increasing of pangasius fish production volume has not been able to suffice its domestic demand. Table 3 show the volume and target production of pangasius fish in Indonesia.
Table 3. Volume and target production of pangasius fish in Indonesia
Pangasius fish Year (MT)
2008 2009 2010 2011 2012 2013 Production 102 021 109 685 147 888 229 267 347 000 n/a Target Production n/a 132 600 225 000 383 000 651 000 1 107 000 Source: KKP (2012); DJPB (2013b)
Table 3 shows the gap between the production and the target production of pangasius fish. Pangasius fish production only met 82.72, 65.73, 59.86 and 53.30 percent of its target production from 2009 to 2012 respectively. The gap between pangasius fish demand and production are fulfilled by import, mainly from Vietnam. Indonesia imported 2 453.41 MT of pangasius fish fillet in 2010 (DJP2HP, 2012) and 600 MT per month in 2011 (DJP2HP, 2011). In 2011, pangasius fish from Indonesia was sold at the price of 17 000.00 IDR per kg while imported pangasius fish from Vietnam was only 9 000.00 IDR per kg (DJPB, 2011). Price differences make local pangasius fish farmer cannot compete with imported pangasius fish.To save local pangasius fish farmer, the Indonesian government stopped importing pangasius fish fillet through Regulation of the Minister of Marine Affairs and Fisheries PERMEN-KP No.15/MEN/2011 about "Quality Control and Safety of Fisheries Product Entry into the Republic of Indonesia". By this policy, local pangasius fish are prioritized and hopefully it can increase local pangasius fish farmer competitiveness.
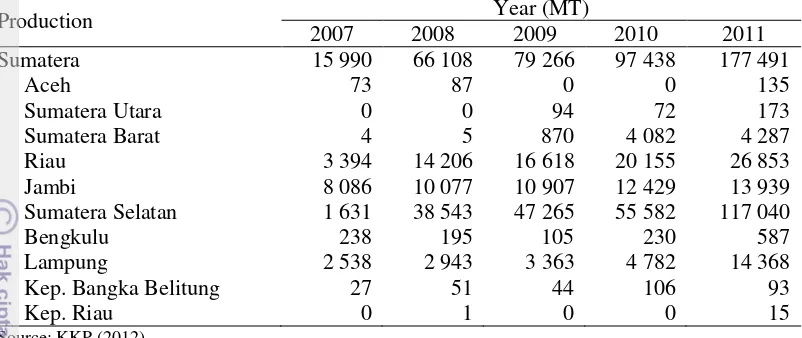
Table 4. Volume of pangasius fish culture production by province in Sumatera
Kota Gajah Sub-District (KoGa), Lampung Tengah District, Lampung Province set as Minapolitan Aquaculture Area based on the Decision of the Minister of Marine Affairs and Fisheries of the Republic of Indonesia No.35/KEPMEN-KP/2013 concerning "Establishment of the Minapolitan Area". KoGa famous for its success as an efficient and low costs pangasius fish producer by using local resources as their alternative fish feed to reduce the use of high priced commercial fish feed (DJPB, 2013a). KoGa is able to use the side catch product of capture fisheries in its surrounding area as sustainable and cheap fishmeal ingredients to be used as the alternative fish feed. KoGa is also using rice bran as its sustainable and cheap fishmeal ingredients.
The success in Pangasius fish farming in KoGa cannot be separated from the help and support from the government. Some Minapolitan and Fisheries Industrialization programs are conducted in KoGa which include expansion and development of fish farming area, formation of The Group of Fish Farmers (Kelompok Pembudidaya Ikan, POKDAKAN) and The Joint-Group of Fish Farmers (Gabungan Kelompok Pembudidaya Ikan, GAPOKDAKAN), provision of capital such as irrigation canals, subsidy in capital such as feed pellet machines subsidy, Best Aquaculture Practices training and counseling and other programs that support the aquaculture business, especially Pangasius fish farming business (BP3K, 2012). Although pangasius farming is encouraged by the government, some policies are distorting and reduce the competitiveness and comparativeness of pangasius fish farming such as value added tax and import tariff on the inputs.
Problem Statement
1. Is Pangasius fish farming in KoGa has comparative and competitive advantages?
2. Is Minapolitan and Fisheries Industrialization programs on the input and output of pangasius fish farming in KoGa have positive effect to its competitive advantage?
Research Objectives
The Objectives of the study are:
1. To analyze the level of comparative and competitive advantages of pangasius fish farming business.
2. To analyze the impact of Minapolitan and Fisheries Industrialization programs to the comparative and competitive advantages of pangasius fish farming business.
3. To define key factors affecting the level of comparative and competitive advantages of pangasius fish farming business.
4. To identify the effect of changes in key factor affecting the level of comparative and competitive advantages of pangasius fish farming business.
Benefits of the Study
The benefits of this study are:
1. As a reference and consideration in setting policy related to pangasius fish farming business for central and local government, particularly in terms of increasing its comparative and competitive advantages.
2. As information in order to improve production efficiency and competitiveness of pangasius fish farming business.
3. As a reference and information for further study in more depth approach or different production technology for academics and researchers.
Scope and Limitation of the study
This research was conducted in Kota Gajah Sub-District, as one of the areas designated as Minapolitan Aquaculture Area for pangasius fish farming business. The scope of the discussion in this study includes a comparative and competitive analysis of pangasius fish farming business using the Policy Analysis Matrix (PAM) method. This analysis will also provide information of economic efficiency and the impact of Minapolitan and Fisheries Industrialization programs on pangasius fish farming business in KoGa.
2 LITERATURE REVIEW
Production Technology of Pangasius Fish
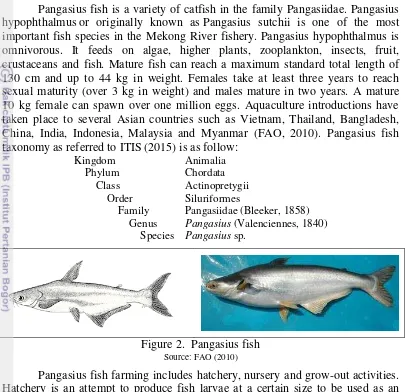
Pangasius fish is a variety of catfish in the family Pangasiidae. Pangasius hypophthalmus or originally known as Pangasius sutchii is one of the most important fish species in the Mekong River fishery. Pangasius hypophthalmus is omnivorous. It feeds on algae, higher plants, zooplankton, insects, fruit, crustaceans and fish. Mature fish can reach a maximum standard total length of 130 cm and up to 44 kg in weight. Females take at least three years to reach sexual maturity (over 3 kg in weight) and males mature in two years. A mature 10 kg female can spawn over one million eggs. Aquaculture introductions have taken place to several Asian countries such as Vietnam, Thailand, Bangladesh, China, India, Indonesia, Malaysia and Myanmar (FAO, 2010). Pangasius fish taxonomy as referred to ITIS (2015) is as follow:
Kingdom Animalia
Phylum Chordata Class Actinopretygii Order Siluriformes
Family Pangasiidae (Bleeker, 1858) Genus Pangasius (Valenciennes, 1840)
Species Pangasius sp.
Figure 2. Pangasius fish
Source: FAO (2010)
Pangasius fish farming includes hatchery, nursery and grow-out activities. Hatchery is an attempt to produce fish larvae at a certain size to be used as an input in pangasius fish nursery. Nursery is an attempt to produce fish fry at a certain size to be used as an input in pangasius fish grow-out. Pangasius fish grow-out is an activity of producing fish in its commercial consumption size. Pangasius fish grow-out in Indonesia is generally conducted in earthen fish ponds, floating nets, pens or cages (Susanto, 2009).
produce sperm if its stomach is stripped (Khairuman and Sudenda, 2009; FAO, 2010). The third stage is spawning. Spawning is done by induced breeding because pangasius fish cannot spawn naturally outside their natural habitat. The success rate of this technique depends on the level of gonad maturity, water quality, feed quality in brood stock feeding and brood stock handling when the induced breeding applied. Induced breeding is completed by using artificial hormones or other fish pituitary gland to stimulate brood stock spawning. The fourth stages are stripping and fertilization. Stripping is performed to get the eggs and sperm from the brood stock. The fertilized eggs are placed in an egg incubator to keep the eggs in suspension. The eggs hatch into larvae after 28 hours. Then the larvae is transferred to larval tanks or sold to the pangasius fish nursery business (Khairuman and Sudenda, 2009; FAO, 2010).
Pangasius fish nursery aims to produce pangasius fish fry at the size of 1-2 inch that is ready to be used as input in pangasius fish grow-out system (Rolin, 2013). An indoor fish tank is used for pangasius fish nursery. Since pangasius fish larvae are sensitive to the temperature changes, the use of indoor fish tank will ease the water temperature control. The indoor fish tank should be kept at the range of 27-30o C. Tanks that are used for pangasius fish nursery are concrete tank, bamboo tank, fiber tank, or aquariums. According to the SNI (2000), the best stocking density for larvae is 40 fish larvae per liter. For the intensive larvae nursery with a water recirculation system, the larvae stocking density could reach up to 90 fish larvae per liter (Irliyandi, 2008). The nursery period takes between 21-28 days. Water exchange is performed to maintain the water quality. Feed used for pangasius fish nursery are brine shrimp, tubifex worm and fish fry pellet. The larvae can be harvested when they reach the size of 1 inch (Rolin, 2013).
There are several things that need to be concerned in pond system (Susanto, 2009), which are: pond construction, pond preparation, pond liming and fertilizing, water supply, fish stocking, feeding and harvesting. There are no special criteria for pangasius fish grow-out ponds but it must have a slow water debit. The pond used is usually an earthen pond where the type of soil is loamy or clayey to prevent water loss. Slope of the pond is 3-5 percent toward the outlet. Sump is made in the base of the pond with 50-100 cm width and 30-50 cm dept from inlet toward the outlet. Sump will help in pond drainage and fish harvesting (Mahyuddin, 2010). The pond size is usually 200-1 500 m2. The bigger the pond is, the harder in water quality, disease and pests management become. Pond dike is adjusted with the size of the pond used (Khairuman, 2007).
water turbidity is ranging between 25-30 cm (Khairuman and Sudenda, 2009). Water resources for pangasius fish pond is surface water, irrigation system, rainfall, or ground water. The stocking density for pangasius fish grow-out is ranging from 1 fry per m2 at size of 100 g per fry (Susanto, 2009) to 40 fish fry per m2 at size of 1 inch per fry (Khairuman and Sudenda, 2009). Stocking of fish is conducted with acclimatization and at the lowest water temperature (25o C) in the morning or in the afternoon. Since the pangasius fish is an omnivorous fish, they could be fed using almost everything from commercial fish feed, alternative fish feed, to the left over from kitchen waste and etc. Fish fed at the amount of 3-4 percent of its body weight per day. The best fish feed used for pangasius fish grow-out contains protein no less than 20 percent (Susanto, 2009).
The Feed Conversion Ratio (FCR) is a measure of feed efficiency in livestock production, including in aquaculture production (New and Wijkström, 2002). Pangasius fish FCR in grow-out stage could reach 1.44 to 2.36 depend on the quality of the feed given (Susanto, 2009). Pangasius fish grow-out system takes 6 months till it is ready to be harvested at the size of 2-3 fish per kg. Harvesting is performed by draining out the pond slowly to prevent stress to the fish. The survival rate of pangasius fish grow-out system at 89-96 percent (Susanto, 2009).
World Market of Pangasius Fish
Pangasius fish has varied trade names in the international world. In North America and Australia, pangasius fish is known as basa fish, swai, or bocourti. In the UK it is known as river cobbler, basa, pangasius, panga, or catfish. In Europe commonly marketed as pangasius or panga. Pangasius fish in the UN COMTRADE and FAS-USDA is known as basa and panga (before 2012 the code name was HS-0304296033 and after 2012 the code name was HS-0304620020). Vietnam and Indonesia are the major producers of pangasius fish. Table 5 shows the world pangasius fish producers.
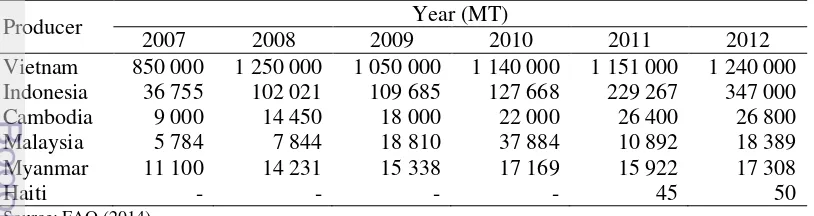
Table 5. World pangasius fish producers
Producer 2007 2008 2009 Year (MT) 2010 2011 2012
Vietnam 850 000 1 250 000 1 050 000 1 140 000 1 151 000 1 240 000 Indonesia 36 755 102 021 109 685 127 668 229 267 347 000 Cambodia 9 000 14 450 18 000 22 000 26 400 26 800 Malaysia 5 784 7 844 18 810 37 884 10 892 18 389 Myanmar 11 100 14 231 15 338 17 169 15 922 17 308
Haiti - - - - 45 50
Source: FAO (2014)
Pangasius fish grow-out in Vietnam has stocking density at 30-40 fry per m2 that yielding 250-300 MT per ha in earthen pond system (Dzung, 2008) with the cost of production in average at 6 000.00 IDR per kg (Trobos Aqua, 2012). Vietnam is able to integrate their pangasius agribusiness system by establishing the Mekong Delta River as the center of integrated pangasius fish farming (Dzung, 2008). The harvest size of pangasius fish from Vietnam is large, usually more than 700 g per fish, making it suitable to be used as fish fillet. The color of the meat is white and it is also odorless, making it the best quality of pangasius fish fillet as required by the international market.
There are some issues related to pangasius in Vietnam. Vietnam started exporting pangasius fish to the US in 1996. The market share of pangasius fish from Vietnam in the US in 2002 was 12 percent. Consumer in the US prefers pangasius fish to local catfish because it has a good taste, good quality and sold at a lower price. This pangasius was sold at the price of 50 percent lower than the US local catfish. This competition leads to the decline in the local catfish prices and the beginning of the "catfish" war.
In 2001, the Catfish Farmers of America (CFA) lobbied ban on imported catfish from Vietnam due to health issue on its production system. After investigation in the Mekong River delta, the US rejected this claim. In the same year by a group of lawmakers in the United States, pangasius fish from Vietnam cannot be labeled as "catfish" in the US market. This forces Vietnam pangasius producers to change their product name to "basa fish" and "tra fish". These changes did not decrease the imported pangasius fish from Vietnam to US because it has already popular among the US consumer.
In 2002 by the Catfish Farmers of America (CFA) and eight local catfish producers through the United States International Trade Commission (USITC) and the Viet Nam Association of Seafood Exporters and Producers (VASEP) sued pangasius fish from Vietnam for selling their product bellow their costs of production. After investigation, concluded that pangasius fish from Vietnam was sold bellow their fair price in the US market. As a result of this case, the Import Administration of Department of Commerce (DOC) imposed import tariff on pangasius fish from Vietnam of 37 to 64 percent.
Indonesia's Market of Pangasius Fish
There are several varieties of local pangasius fish in Indonesia namely Pangasius polyuranodon (juaro fish), Pangasius macronema (rios, riu, riuscaring, lancang, or wakal fish), Pangasius nasutus (pedado fish), Pangasius nieuwenhuisii (mace fish) and Pangasius hypophthalmus or Pangasius sutchi (patin siam fish or patin jambal fish) (Susanto, 2009). Patin Pasupati (Patin Super Harapan Pertiwi) is a cross breeding species between female patin siam fish and male patin jambal fish through selective breeding from Balai Penelitian Pemuliaan Ikan Sukamandi (Sukamandi Fish Breeding Research Institute). Patin pasupati is the most cultured species in pangasius fish farming in Indonesia (KKP, 2014).
Pangasius fish in traditional market sell in the form of live or fresh fishes. While supermarket and hotel demand for pangasius fish fillet. Pangasius fish fillet is mainly produced by private company at small scale industry and cannot fulfill the demand for pangasius fish fillet because of input shortage. This business relies on imported pangasius fish for their input because imported pangasius fish is cheaper than that of local product. Pangasius fish fillet with local input can be sold at the price of 41 000.00 IDR per kg. This product cannot compete with pangasius fish fillet from Vietnam that is sold at the price of 25 000.00 IDR per kg (Kontan, 2012). Since the implementation of pangasius fish fillet import restriction, the imported illegal pangasius fish fillet were still can be found in market (Widiasto, 2012).
Pangasius fish agribusiness system in Indonesia is not yet integrated. The highest producers of pangasius fish are Sumatera and Kalimantan but the pangasius fish processing factory and the highest market of pangasius fish located in Java and Bali (Poernomo, 2012). The government has taken a serious act to this problem by establishing pangasius fish minapolitan area as an integrated fish farming area. Government also establishing a fish processing unit (Unit Pengolahan Ikan; UPI) in 2013 for pangasius fish that produces pangasius fish fillet and fishmeal at Muaro Jambi regency, Jambi province with daily capacity at 5 MT per day. Muaro Jambi regency was chosen because it is near the pangasius production center such as Sumatera Selatan, Riau, Jambi and Lampung (Republika, 2013).
KoGa allocates 74.85 ha of its land as an area for aquaculture business which 62.26 ha or 83.17 percent of the total area are for pangasius fish farming. KoGa absorbs 366 workers as fish farmers where 232 people choose to cultivate Pangasius fish. Pangasius fish production in KoGa has increased in the last three years. In 2010 the production of Pangasius fish was up to 1 772 MT per year, which then increased to 1 984 MT per year in 2011 and reached 2 490.2 MT per year in 2012 (BP3K, 2012).
Government policies related to pangasius fish farming in KoGa
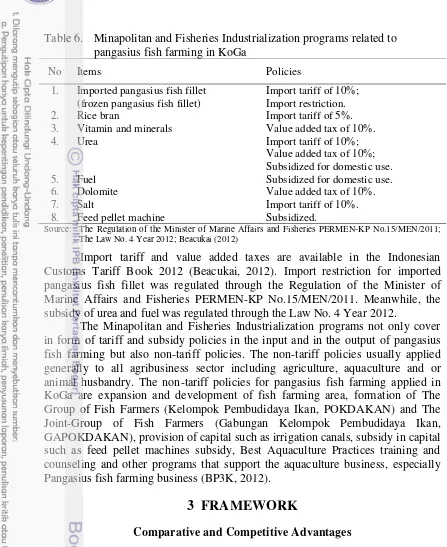
Table 6. Minapolitan and Fisheries Industrialization programs related to 3. Vitamin and minerals Value added tax of 10%.
4. Urea Import tariff of 10%;
Value added tax of 10%; Subsidized for domestic use.
5. Fuel Subsidized for domestic use.
6. Dolomite Value added tax of 10%.
7. Salt Import tariff of 10%.
8. Feed pellet machine Subsidized.
Source: The Regulation of the Minister of Marine Affairs and Fisheries PERMEN-KP No.15/MEN/2011; The Law No. 4 Year 2012; Beacukai (2012)
Import tariff and value added taxes are available in the Indonesian Customs Tariff Book 2012 (Beacukai, 2012). Import restriction for imported pangasius fish fillet was regulated through the Regulation of the Minister of Marine Affairs and Fisheries PERMEN-KP No.15/MEN/2011. Meanwhile, the subsidy of urea and fuel was regulated through the Law No. 4 Year 2012.
The Minapolitan and Fisheries Industrialization programs not only cover in form of tariff and subsidy policies in the input and in the output of pangasius fish farming but also non-tariff policies. The non-tariff policies usually applied generally to all agribusiness sector including agriculture, aquaculture and or animal husbandry. The non-tariff policies for pangasius fish farming applied in KoGa are expansion and development of fish farming area, formation of The Group of Fish Farmers (Kelompok Pembudidaya Ikan, POKDAKAN) and The Joint-Group of Fish Farmers (Gabungan Kelompok Pembudidaya Ikan, GAPOKDAKAN), provision of capital such as irrigation canals, subsidy in capital such as feed pellet machines subsidy, Best Aquaculture Practices training and counseling and other programs that support the aquaculture business, especially Pangasius fish farming business (BP3K, 2012).
3 FRAMEWORK
Comparative and Competitive Advantages
Comparative advantage is an ability of producers to produce goods or services at a lower costs compared to other. In economic term, comparative advantage means that if they can produce at lower opportunity cost which means that the producers has to use less labor, capital and other resources to produce goods and services (Thompson, 2006 in Cai, Leung and Hishamunda, 2009). Comparative and competitive advantages are quite similar in concept. Sometimes they used indistinguishably and interchangeably. But they can be used to represent different concepts. Competitive advantage measures producer profitability in an activity under actual market prices that could be distorted by policy, market failure, etc. Comparative advantage measures producer profitability in an activity under shadow prices that represent the social value of costs in a market without any distortion (Cai, Leung and Hishamunda, 2009).
Agricultural Policy Analysis
Agricultural policy can be described as the set of government actions that cause domestic prices of agricultural products not equal its world market prices. Agricultural policy can be imposed to output prices that directly affect the producer's profit. Agricultural policy can also imposed to input prices that lower producer's cost so that they can gain higher profit. Government can use sets of actions to influence the product prices. That sets of actions performed to promote economic efficiency, to share out incomes, to stabilize food price and food security, to distribute sufficient nutritional food and to contribute to monetary balance in the public sector (Monke and Pearson, 1989).
Classification of Price Policies
The classifications of commodity price policies are presented in Table 7. Table 7. Classification of commodity price policy
Instrument Policies affecting producers Policies affecting consumers
Subsidy policies: Producer subsidies Consumer subsidies 1. That do not change
domestic market prices
On importable goods On exportable goods; domestic market 2. That do change
domestic market prices
On exportable goods On importable goods; domestic market Trade policies
(all of which change domestic market prices)
Restrictions on imports Restrictions on exports; change domestic market
and Pearson (1989) define trade policy as commodity imports or exports restriction. Restrictions can be in the form of price (trade tax) or quantity (trade quota). The purpose of trade policy is to reduce traded quantity of tradable goods and to regulate the gap between domestic and international market prices.
The commodity price policy can be affected the producers (in form of producer surplus) or consumers (in form of consumer surplus). Subsidy and or trade policy causes transfers among producers, consumers and government. The commodity price policy can also be imposed to importable goods or exportable goods. When there is no commodity price policy, the price established domestically is the world price. The CIF price represents the importable and FOB price for exportable goods. Policies that raise the domestic price for importable and or exportable goods give producers an economic surplus (producer surplus). Policies that drop the domestic price for importable and or exportable goods give consumers an economic surplus (consumer surplus) (Monke and Pearson, 1989).
Output Policy
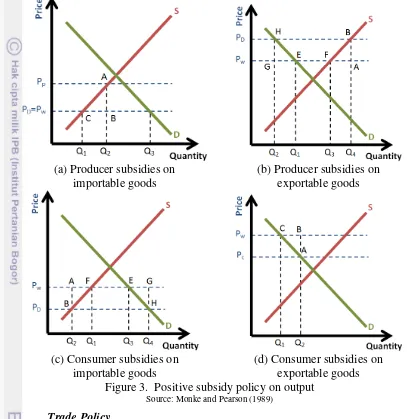
Positive producer subsidy on importable output is shown in Figure 3.(a). The aim of positive producer subsidy on importable output is to increase the price and so increase the production. Positive producer subsidy on importable output increases the producer output price (PP) higher than its world market price (PW). Higher output price for producer increases the quantity produced from Q1 to Q2. Local consumption is not affected at Q3 because the consumer output price remains equal its world market price (PW). The quantity of import is declined from Q3-Q1 to Q3-Q2. Transfer from government budget to producer is shown by the area PPABPW. The efficiency loss is shown by the area CAB (Monke and Pearson, 1989). Positive consumer subsidy on exportable output is shown in Figure 3.(b). The aim of positive consumer subsidy on exportable output is to increase the domestic price and so increase the production. Positive consumer subsidy on exportable output increases the domestic price (PD) above their world market price (PW). Higher output price increases the quantity produced from Q3 to Q4. Local consumption decreases from Q1 to Q2. The quantity of export increases from Q3-Q1 to Q4-Q2. Transfer from government budget is shown by the area ABHG (Monke and Pearson, 1989).
producer increases the quantity consumer from Q1 to Q2. Local production is not affected at Q1 because the producer output price remains equal its world market price (PW). The quantity of import is increased from Q1 to Q2. Transfer from government budget to consumer for this subsidy is shown by the area Q1CAQ2 (Monke and Pearson, 1989).
(a) Producer subsidies on importable goods
(b) Producer subsidies on exportable goods
(c) Consumer subsidies on importable goods
(d) Consumer subsidies on exportable goods Figure 3. Positive subsidy policy on output
Source: Monke and Pearson (1989)
Trade Policy
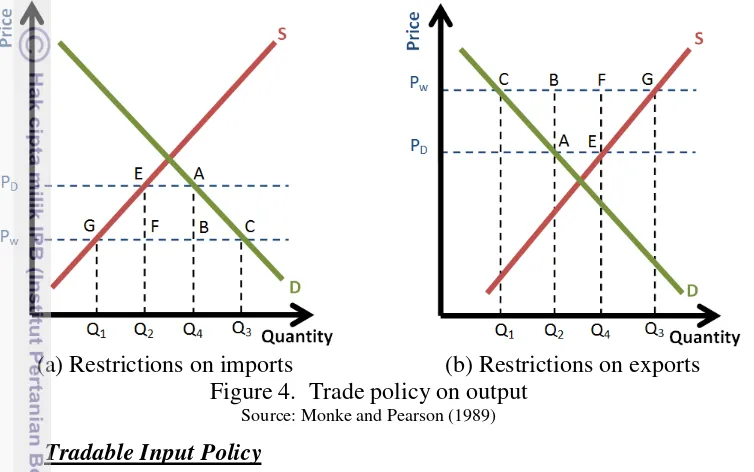
below its world market price so that the consumer can consume more of the product. Restriction on export is lower the domestic price (PD) below the world market price (PW). The consumption increases from Q1 to Q2. Export decreases from Q3-Q1 to Q4-Q2. The production decreases from Q3 to Q4. Transfer income from consumer is (PD-PW)Q4 or PDABPW which to producer is (PD-PW)Q2 or PDEFPW and to government budget is (PD-PW)(Q4-Q2) of FEAB (Monke and Pearson, 1989).
(a) Restrictions on imports (b) Restrictions on exports Figure 4. Trade policy on output
Source: Monke and Pearson (1989)
Tradable Input Policy
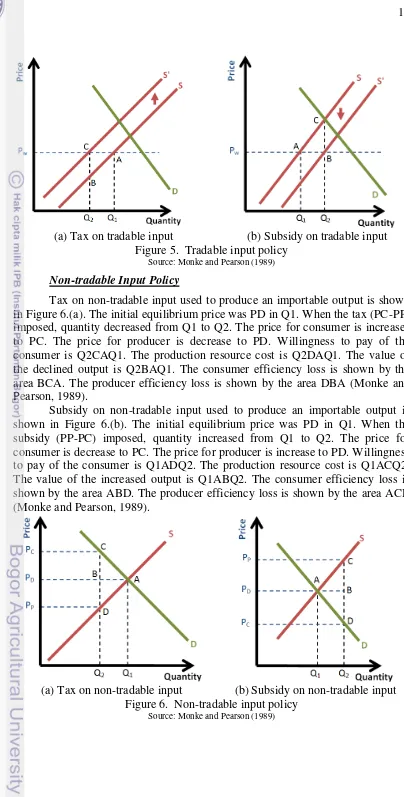
Tax on tradable input used to produce an importable output is shown in Figure 5.(a). The aim of tax on tradable input used to produce an importable output is to decrease the supply of the output produced. Tax on tradable input causes production costs increased and so decrease the output produced from Q1 to Q2. The output change shift the supply curve from S to S'. The efficiency loss in this tax is shown by the area ABC (Monke and Pearson, 1989).
(a) Tax on tradable input (b) Subsidy on tradable input Figure 5. Tradable input policy
Source: Monke and Pearson (1989)
Non-tradable Input Policy
Tax on non-tradable input used to produce an importable output is shown in Figure 6.(a). The initial equilibrium price was PD in Q1. When the tax (PC-PP) imposed, quantity decreased from Q1 to Q2. The price for consumer is increases to PC. The price for producer is decrease to PD. Willingness to pay of the consumer is Q2CAQ1. The production resource cost is Q2DAQ1. The value of the declined output is Q2BAQ1. The consumer efficiency loss is shown by the area BCA. The producer efficiency loss is shown by the area DBA (Monke and Pearson, 1989).
Subsidy on non-tradable input used to produce an importable output is shown in Figure 6.(b). The initial equilibrium price was PD in Q1. When the subsidy (PP-PC) imposed, quantity increased from Q1 to Q2. The price for consumer is decrease to PC. The price for producer is increase to PD. Willingness to pay of the consumer is Q1ADQ2. The production resource cost is Q1ACQ2. The value of the increased output is Q1ABQ2. The consumer efficiency loss is shown by the area ABD. The producer efficiency loss is shown by the area ACB (Monke and Pearson, 1989).
(a) Tax on non-tradable input (b) Subsidy on non-tradable input Figure 6. Non-tradable input policy
Policy Analysis Matrix
Policy analysis matrix is a method which provides information and analysis of agricultural policy. PAM analysis consists of double entry of farm budget, which is the farm budget at actual market prices (measures of competitive advantage) and farm budget at economic efficiency prices (measures of comparative advantage) (Monke and Pearson, 1989). PAM analysis offers calculation on competitiveness through private profitability, comparativeness through social profitability and transfer effect of policies through the divergences between private and social profitability (Pearson, Gotsch and Bahri, 2003). The PAM table is arranged by 4 x 3 tables. In the column section consists of revenues, the costs of tradable inputs, the costs of domestic factor or non-tradable inputs and profits respectively. In the row section consists of private prices, social prices and the divergences between private and social prices respectively.
Table 8. Policy Analysis Matrix
Source: Monke and Pearson (1989); Pearson, Gotsch and Bahri (2003) Where:
A : Private revenue G : Domestic factor in social price B : Tradable input in private price H : Social profit
C : Domestic factor in private price I : Output transfer D : Private profit J : Input transfer E : Social revenue K : Factor transfer F : Tradable input in social price L : Net transfer
Previous Research
Studies on pangasius fish that discuss about its competitiveness are limited. This sub chapter will discuss some of previous studies that relevant to the pangasius fish competitiveness. Kaliba and Engle (2003) in Leung and Cai (2005) was conducting PAM analysis on catfish farming in Chicot County, Arkansas. This study showed that divergences between private and social prices could occur due to market failure. The PCR value was higher than one but the DRC value was lower than one. The output price of catfish farming could be increased if the distorting policies were eliminated. This study also concludes that larger business scale is more socially profitable.
Mastuti (2011) was conducting PAM analysis on pangasius fish hatchery business in Bogor District, West Java Province. The study concludes that the pangasius fish hatchery was privately and socially profitable in the year 2008-2009. The decrease in competitiveness was resulted by the increase in wage rate and input prices and the decrease in output price. While the decrease in comparativeness resulted by the exchange rate depreciation.
beef cattle breeding. This caused by the high price of beef cattle fattening input prices. The study also showed that pangasius fish farming that used commercial fish feed was not comparative due to the high price of commercial fish feed whilst the pangasius fish farming that used alternative fish feed was competitive. The deletion of import tariff on imported beef and the rising of fuel price cause the decline of comparativeness in beef cattle business. The use of alternative cattle feed was increase the competitiveness and comparativeness of beef cattle business. Decrease in pangasius fish output price causes the decrease in competitiveness especially in the farming that using commercial fish feed. The value added tax deletion also increases the comparativeness of pangasius fish farming.
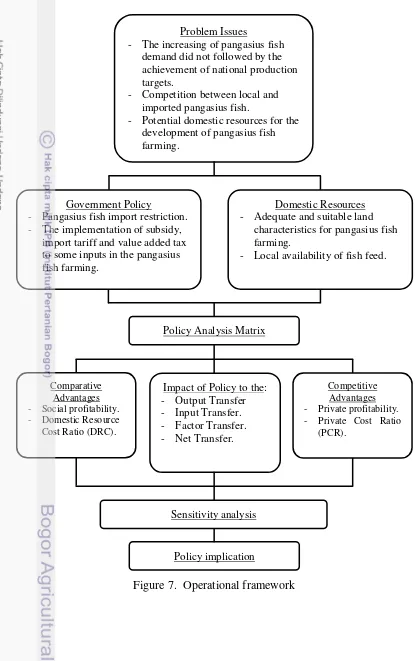
Operational Framework
KoGa has good domestic resources in the development of pangasius fish farming. Even so, there is some milestone in the effort to increase the competitive and comparative advantages of pangasius fish farming. Government has applied a variety of trade policies and subsidies in order to improve the competitive and comparative advantages of pangasius fish farming.
Figure 7. Operational framework
Problem Issues
- The increasing of pangasius fish demand did not followed by the achievement of national production targets.
- Competition between local and imported pangasius fish.
- Potential domestic resources for the development of pangasius fish farming.
Government Policy
- Pangasius fish import restriction. - The implementation of subsidy,
import tariff and value added tax to some inputs in the pangasius fish farming.
Domestic Resources - Adequate and suitable land
characteristics for pangasius fish farming.
- Local availability of fish feed.
Policy Analysis Matrix
Comparative Advantages - Social profitability. - Domestic Resource Cost Ratio (DRC).
Impact of Policy to the: - Output Transfer - Input Transfer. - Factor Transfer. - Net Transfer.
Competitive Advantages - Private profitability. - Private Cost Ratio
(PCR).
Sensitivity analysis
4 RESEARCH METHODOLOGY
Location and time
This research was conducted in Kota Gajah Sub-District, Lampung Tengah District, Lampung province, Indonesia. KoGa considered as one of the center areas of pangasius fish production in Lampung Province. This district is well-known for its success in the use of sustainable fish feed based on local materials for pangasius fish farming to reduce the cost of production. Data were collected by the data collector in September 2013.
Types and Sources of Data
Cross section data were used in this study with 2012 as the base year. Source of data were secondary data and was obtained from the book of Programa Penyuluhan Perikanan Kecamatan Kota Gajah Lampung Tengah 2012, the Agricultural, Fishery and Forestry Extension Centers (BP3K) Kota Gajah Sub-District. This book was concerning about pangasius fish production in average in KoGa that supervised by the BP3K. This book was used by the Statistics Indonesia (BPS) as reference in calculating the province and national Pangasius fish productions in Indonesia year 2012.
The data was originally intended for book of Programa Penyuluhan Perikanan Kecamatan Kota Gajah Lampung Tengah 2012 and so needed to be reviewed before used in Policy Analysis Matrix. The data review covers the estimation of input and sub-input used and output produced; input and output prices adjustment prevailing in 2012; estimation of labor used and its wage; and estimation of land and capital used and its depreciation costs.
The data collected were production technology of pangasius fish; farm business such as the quantity and price of input used and output produced; and the application of Minapolitan and Fisheries Industrialization programs in form of policies and regulations related to pangasius fish farming in KoGa. As additional information, interview with key persons were conducted, namely H. Wahidin, as the Chairman of GAPOKDAKAN Karya Mina Manunggal; Toha Mohtar, SStPi, as the fisheries instructor at BP3K; and Dedi Anwar Sipayung, S.Pi., as the duty implementer of the Chief Section of Fish Hatchery, Department of Animal Husbandry and Fisheries, Pringsewu District.
Additional secondary data were sourced from the Directorate General of Fisheries Product Marketing and Processing; Directorate General of Aquaculture; Food and Agriculture Organization; Foreign Agricultural Service USDA; Ministry of Marine Affairs and Fisheries; National Standardization Agency of Indonesia; Statistics Indonesia; UN COMTRADE; World Bank; and a number of publications and other various agencies and related institutions.
Empirical Analysis
1. Identification of input and output in the pangasius fish farming business. 2. Construction of private farm budget.
3. Determination of input into tradable and non-tradable inputs. 4. Calculation of the input and output shadow prices.
5. Construction of social farm budget. 6. Construction of Policy Analysis Matrix.
7. Analyze the identities of Policy Analysis Matrix to measures the competitive and comparative advantages of the pangasius fish farming business.
8. Sensitivity analysis of the PCR and DRC.
Identities of PAM Analysis
The policy analysis matrix consists of profitability and divergence identities. Then ratios are calculated to compare the competitiveness and comparativeness of other agricultural system that produce unlike output. Here are the identities and ratios of PAM analysis according to Monke and Pearson (1989) and Pearson, Gotsch and Bahri (2003):
Private profit (D) is given as: = −( + ); where: A is private revenue (IDR), B is tradable input in private price (IDR), C is domestic factor in private price (IDR) and D is private profit. Private profitability is a measure of competitiveness of the agricultural business system at certain technologies, output prices, input costs and applied policies. Thus if private profit is greater than zero, the pangasius fish farming business is profitable and expected to expand the business; then the pangasius fish farming business has competitive advantages.
Private Benefit-Cost Ratio (PBCR) is given as: =
+ ; where: A is
private revenue (IDR), B is tradable input in private price (IDR), C is domestic factor in private price (IDR) and PBCR is Private Benefit-Cost Ratio. Private benefit-cost ratio is used to compare private profitability of other agricultural systems that produce unlike outputs. Private benefit-cost ratio compares between private revenue and private costs.
Private Cost Ratio (PCR) is given as: =
( − ); where: A is private
revenue (IDR), B is tradable input in private price (IDR), C is domestic factor in private price (IDR) and PCR is Private Cost Ratio. Private cost ratio is used to compare the competitiveness of other agricultural systems that produce unlike outputs with different capital intensities. Private cost ratio is a comparison between the costs of domestic factor with the value added in private prices. Value added is the divergence between the value of output and the costs of tradable inputs. Private cost ratio shows how much the system can afford to pay domestic factors and still remain competitive. Thus if private cost ratio is less than one then the pangasius fish farming business has competitive advantages.
Social profit (H) is given as: = −( + ); where: E is social revenue
profitability is greater than zero then the pangasius fish farming business is socially profitable and efficient in resources use; then the pangasius fish farming business has comparative advantages.
Social Benefit-Cost Ratio (SBCR) is given as: =
+ ; where: E is
social revenue (IDR), F is tradable input in social price (IDR), G is domestic factor in social price (IDR) and SBCR is Social Benefit-Cost Ratio. Social benefit-cost ratio is used to compare the efficiency or social profitability of other agricultural systems that produce different outputs. Social benefit-cost ratio compare between social revenue and social costs.
Domestic Resource Cost Ratio (DRC) is given as: =
( − ); where: E
is social revenue (IDR), F is tradable input in social price (IDR), G is domestic factor in social price (IDR) and DRC is Domestic Resource Cost ratio. Domestic resource cost ratio used to compare relative efficiency of other agricultural systems that produce unlike outputs with different capital intensities. Domestic resource cost ratio is a comparison between the costs of domestic factor with the value added in social prices. Value added is the divergence between the value of output and the costs of tradable inputs. Domestic resource cost ratio shows how much the system can afford to pay domestic factors in social price and still remain efficient and comparative. Thus, if domestic resource cost ratio is less than one transfer is a measure of implicit tax or subsidy on outputs. Thus, if output transfer is greater than zero then the output in private price to some extent is subsidized.
Nominal Protection Coefficient on Outputs (NPCO) is given as: = ; where: A is private revenue (IDR), E is social revenue (IDR) and NPCO is Nominal Protection Coefficient on Outputs. Nominal protection coefficient on outputs is a comparison ratio between the output in private prices and the output in social prices. Nominal protection coefficient on outputs can be used to compare the output protection of other agricultural system that produce unlike output. Thus, if nominal protection coefficient on outputs is greater than one then the output in the pangasius fish farming business receiving protection.
Input Transfer (J) is given as: = − ; where: B is tradable input in private price (IDR), F is tradable input in social price (IDR) and J is input transfer (IDR). Input transfer shows the value of the divergences between private and social tradable input. In the non-existence of market failure, all divergences between private and social prices of tradable output and inputs are caused by distorting policy. Therefore, the tradable input transfers are a measure of the implicit tax or subsidy on tradable inputs. Thus, if input transfer is less than zero then the tradable inputs in private price to some extent are subsidized.
Nominal Protection Coefficient on Inputs (NPCI) is given as: = ;
(IDR) and NPCI is Nominal Protection Coefficient on Inputs. Nominal protection coefficient on inputs is a comparison ratio between the tradable inputs in private prices and the tradable inputs in social prices. Nominal protection coefficient on inputs can be used to compare the input protection of other agricultural system that produce unlike output. Thus, if nominal protection coefficient on inputs is less than one than the tradable inputs in the pangasius fish farming business is subsidized by the policy.
Factor Transfer (K) is given as: = − ; where: C is domestic factor
in private price (IDR), G is domestic factor in social price (IDR) and K is factor transfer (IDR). Factor transfer is a value that indicates the divergence between private and social non-tradable input. The value of factor transfer can be positive (implicit tax or decreasing of factor resources) or negative (implicit subsidy or increasing factor resources). Divergences in factor markets result from market failures and distorting policies. Distortions in labor and capital markets occur from taxes or subsidies (pension tax, credit subsidy, etc), price regulations (minimum wage floors, interest rate ceilings, etc), or distorting macro-economic policies (inflationary monetary policy, etc). Thus if factor transfer is less than zero then the domestic factor in private prices to some extent are subsidized.
Net Transfer (L) is given as: = − = −( + ); where: D is
private profit (IDR), H is social profit (IDR), I is output transfer (IDR), J is input transfer (IDR), K is factor transfer (IDR) and L is net transfer (IDR). Net transfer shows not only the sum of output, tradable input and factor transfer, but also the divergence between private and social profits. Net transfer indicates producer surplus as the results of all policies related to domestic factor, output, tradable inputs and exchange rate. Thus, if net transfer greater than zero then the producer gain positive producer surplus because of net incentive.
Effective Protection Coefficient (EPC) is given as: = ( − )
( − ); where:
A is private revenue (IDR), B is tradable input in private price (IDR), E is social revenue (IDR), F is tradable input in social price (IDR) and EPC is Effective Protection Coefficient. Effective protection coefficient is the ratio of value added in private prices and value added in social prices. It measures the effect of policy transfer from output and tradable input but it does not account for any effects of policy in domestic factor. Thus, if effective protection coefficient is greater than one then output and tradable-input policies are providing positive transfer.
Profitability Coefficient (PC) is given as: = = − −
− − ; where: A is
private revenue (IDR), B is tradable input in private price (IDR), C is domestic factor in private price (IDR), D is private profit (IDR), E is social revenue (IDR), F is tradable input in social price (IDR), G is domestic factor in social price (IDR), H is social profit (IDR) and PC is Profitability Coefficient. Profitability coefficient is the extension of effective protection coefficient. It is the ratio of private and social profits and it determines the impact of all policy transfer on private profits including the policy transfer on domestic factor. Thus, if profitability coefficient is greater than one then the private profit to some extent is receiving net incentive.
a single measure of the effect of all transfer. It shows how much net transfer in relation to the social revenues. Thus, if subsidy ratio to producers is less than one then the distortions of the applied policies on the agricultural system are low.
Input and Output Social Prices Determination
Two types of prices were used in this study: (1) the observed market prices or the private prices; and (2) the efficiency prices or the social prices or the shadow prices. The private prices take into account distorting policy from the government. The social prices represent the price that occurs in an economy analysis when the market in a state of perfect competition and under equilibrium conditions. The use of private (observed market price) in conducting the economic analysis often does not describe its opportunity cost. Therefore, every input and output that is used in the economic analysis should be adjusted to its social prices. In a perfect competitive market, the opportunity cost of goods will be equal to its social prices. Then the calculation of social prices can be done by omitting the distorting policies such as subsidies, taxes, etc. The calculation of social prices for tradable inputs and outputs can also be approximated using the FOB prices for exported goods and the CIF prices for imported goods (Pearson, Gotsch and Bahri, 2003; Gittinger, 1984).
Social valuation of output
The output of pangasius fish farming is a fresh or live pangasius fish. In 2011, Indonesia still imported frozen pangasius fish fillet from Vietnam. The social price of the output can be approached by their domestic border price or the CIF price. Since it is hard to find the CIF price of imported frozen pangasius fish fillet in Indonesia, it is approximated by the FOB price of frozen pangasius fish fillets from Vietnam to US. The FOB price of pangasius fish fillet from Vietnam to the US in 2012 was 3 310.00 USD per MT. After calculation and conversion from frozen pangasius fish fillet into fresh pangasius fish, its social price was obtained at the price of 11 572.13 IDR per kg. Detailed calculation of the social valuation of pangasius fish can be found in Appendix 1.
Social valuation of tradable inputs
- Social valuation of pangasius fish fry
Social prices of pangasius fish fry are estimated from its actual market prices. This can be performed because the pangasius fish fry is produced locally in the vicinity area, which is from Metro city, Lampung and Bogor, West Java. The fry trade is in a perfect competitive market without any policy or regulation control it. Pangasius fish fry private prices on average were 180.00 IDR per fry and its social prices was equal its private prices.
- Social valuation of fish feed
fish feed production and marketing and it is also in perfect competitive market, the social prices of commercial fish feed can be estimated from its actual market prices. Commercial fish feed private prices on average was 258 000.00 IDR per sack which equaled to 8 600.00 IDR per kg.
The alternative fish feed was locally produced with local ingredients and encouraged by the government for widespread use. It was made from rice bran, dried salted fish, vitamin, mineral and processed with feed pellet machine. The feed pellet machine was subsidized by government and it was operated using fuel. The alternative fish feed was sold at the price of 3 500 IDR per kg in 2012 and its production calculation can be seen in Appendix 2.
Indonesia was the net exporter for rice bran mainly to Singapore till 2009. From 2010 until today, there is no record for international trade for rice bran in Indonesia. Imported rice bran charged by import tariff of 5 percent. Because it is hard to find the transportation costs and marketing costs for the rice bran and it is in perfect competitive market and the import tariff cannot be charged because Indonesia was net exporter, the social prices of rice bran can be estimated from its actual market prices. Rice bran private prices on average was 2 000.00 IDR per kg and its social prices was equal its private prices.
Dried salted fish was used in the production of alternative fish feed as substitute for imported fishmeal. The dried salted fish is made from trash fish as side catch from capture fisheries business around KoGa. The quality of these fish is not as good as imported fishmeal but has a good potential to be used as sustainable and cheap source of imported fishmeal substitute. Indonesia produces fishmeal but in small quantities. To fulfill the fishmeal demand Indonesia imported fishmeal. If the calculation of the dried salted fish social price performed by comparing it to fishmeal for commercial fish feed or dried salted fish for human consumption, than it became incomparable. There is no record for international trade for dried salted fish that not suitable for human consumption in Indonesia. Because there is no international price for it and it is in perfect competitive market with no distorting policy related to it, the social prices of dried salted fish can be estimated from its actual market prices. Dried salted fish private prices on average was 2 400.00 IDR per kg and its social prices was equal its private prices.
In 2012, Indonesia was net importer of vitamin and mineral for human consumption from China. All imported vitamin and mineral charged by value added tax of 10 percent. Because there is no international price for vitamin and mineral that not suitable for human consumption and it is in perfect competitive market, the social prices of vitamin and mineral can be estimated from its actual market prices subtracted by its value added tax of 10 percent. Vitamin and mineral private price on average was 25 000.00 IDR per kg and so its social price was 22 500.00 IDR per kg.