Sci.Int.(Lahore),26(4),1477-1481,2014 ISSN 1013-5316; CODEN: SINTE 8 1477
THE EFFECTS OF TRAINING SET SIZE ON THE ACCURACY OF
MAXIMUM LIKELIHOOD, NEURAL NETWORK AND SUPPORT
VECTOR MACHINE CLASSIFICATION
Ummi Kalsom Mohamad Hashim, Asmala Ahmad
Department of Industrial Computing
Faculty of Information and Communication Technology Universiti Teknikal Malaysia Melaka
Hang Tuah Jaya, 76100 Durian Tunggal, Melaka, Malaysia [email protected], [email protected]
ABSTRACT :In this paper, we assess the accuracy of maximum likelihood, neural network and support vector machine classification with changing training set size. The data come from Landsat-5 TM satellite covering the area of Klang, located in Selangor, Malaysia. Initially, single or multiple region of interest (ROI) are drawn on each of the land cover classes identified in order to extract the training sets. The size of the training pixels are then varied from 10% to 90% by resampling the pixels within the ROI using stratified random sampling technique, where nine training sets are generated. Landsat bands 1, 2, 3, 4, 5 and 7 are then used as the input for the maximum likelihood, neural network and support vector machine classification by making use a ll the nine training sets. The a ccuracy of the classifications are then assessed by comparing the classifications with a reference set using a confusion matrix. The result reveals that support vector machine classification has a more stable increase in accuracy than maximum likelihood but neural network shows a decreasing trend as the size of training set increases.
KEYWORDS: Training Set Size, Maximum Likelihood, Neural Network, Support Vector Machine, Accuracy Assessment.
1.0
INTRODUCTIONRemote sensing data recorded from satellite platform has become a vital tool for mapping land covers. The main factors are data acquisition of land covers can be done rapidly and at a cheaper cost than conventional methods. Image Classification is one of the most important processes in remote sensing applications, which include agricultural efficiency, disaster management, ecological forecasting and vector-borne disease mitigation. Classification can be performed using unsupervised and supervised approach; the later is more preferred due to its accuracy and practicality [1,2]. The main difference is that supervised classification needs a priori information of the land covers to be classified but unsupervised classification does not.
A number of supervised classification methods exist to classify land cover in remote sensing data [3]. Three methods most frequently chosen are maximum likelihood (ML), neural network (NN) and support vector machine (SVM). ML can be considered as the most established method assumes the distribution of the data within a class obeys a multivariate Gaussian distribution. On the other hand NN is a non-parametric method which does not depend on the multivariate Gaussian distribution assumption. SVM is another non-parametric method which is based on efficient hyperplane searching technique. It uses minimal training pixels and therefore needs less processing time.
2.0
METHODOLOGYIn this study, ML classification was applied to the study area (Klang in Selangor, Malaysia), which covers approximately 540 km2 within longitude 101° 10’ E to 101°30’ E and land sediment plumes and water. Regions of interest (ROIs) associated with the training The ROI was determined by choosing one or more polygons for each class based on visual interpretation of the land cover map and Landsat data. This was assisted by region growing technique in which pixels within polygons were grown to neighbouring pixels based on a threshold, i.e. the number of standard deviations away from the mean of the drawn polygons. Pixels for the 11 classes of land cover were determined based on the land cover map.
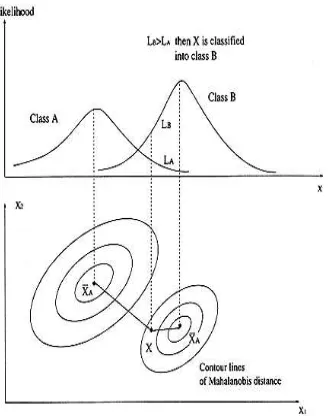
Sampling was carried out by means of stratified random sampling technique. This was done by dividing the population (the entire classification image) into homogeneous subgroups (the ROI for individual classes) and then taking a simple random sample in each subgroup. 11 training sets were extracted based on percentage of pixels within the ROIs, viz. 10%, 20%, 30%, 40%, 50%, 60%, 70%, 80% and 90%. These training sets were fed into each of the classifiers (ML, NN and SVM) consecutively. In ML classification, the distribution for each class in each band is assumed to be normal and the probability a given pixel belongs to a specific class [3] is calculated based on this assumption. Each pixel is then assigned to the class that has the highest probability. Classification is performed by calculating the discriminant functions for each pixel in the image[4,5]. Figure 1 shows the concept of maximum likelihood classification [6,7].
Figure 1: Concept of maximum likelihood classification.
the threshold and weight vector connected in the network [6].Figure 2 shows the concept of neural network classification that embeds multilayer perceptron.
Input Layer Hidden Layer Output Layer
Figure 2: Concept of neural network classification that embedded multilayer perceptron.
SVM classification is performed by making use an efficient hyperplane searching technique that uses minimal training area and therefore consumes less processing time [9,11]. This method can avoid over fitting problem and requires no assumption on data type. Although non-parametric, the method is capable of developing efficient decision boundaries and therefore can minimise misclassification. SVM can be looked as a binary classifier that works by identifying the optimal hyperplane and correctly divides the data points into two classes. There will be an infinite number of hypeplanes and SVM will select the hyperplane with maximum margin. The margin indicates the distance between the classifier and the training points (support vector). Figure 3 illustrates the basic idea of support vector machine. A number of techniques can be exploited to expand the classifier from binary to multiclass.
Figure 3: Basic idea of SVM.
The outcomes of the three methods were initially analysed and compared in terms of visual analysis. The accuracy of the classifications is then determined by means of a confusion matrix where comparison is made between the classification and a reference data set [10]. The trend of the classification accuracy as the training set size increases is eventually analysed [1].
3.0
RESULTS AND DISCUSSIONSSci.Int.26(4),1477-1481,2014 ISSN 1013-5316; CODEN: SINTE 8 1479
is about 0.8%. For NN, there is a decreasing trend in accuracy as training set size increases. The maximum accuracy is about 70% and can be observed at 20% training set, while minimum accuracy is about 20%, and occurs at 50% training set. The difference between the minimum and maximum accuracy is about 50%. It is likely that the unstable trend is due to the internal factors of its network topology, such as the number of hidden layers, the number of units and their interconnections. For SVM, an increasing
trend in accuracy can be seen as the training set size increases. The minimum accuracy is about 92.68% that occurs at 10% training set while the maximum accuracy is about 93.2% that occurs at 80% training set. The difference between the minimum and maximum accuracy is about 0.52%. The result indicates that the SVM accuracy is not likely to be influenced by the size of the training set.
Training Set Size
(%)
Maximum Likelihood (ML)
Neural Network (NN)
Support Vector Machine (SVM)
10%
Overall Accuracy: 89.98%
Overall Accuracy: 60.64%
Overall Accuracy: 92.67% 90%
Overall Accuracy: 90.61%
Overall Accuracy: 21.78%
Overall Accuracy: 93.16% Coastal Swamp Forest
Dryland Forest Oil Palm Rubber Industry Cleared Land Urban Coconut Bare Land Sediment Plumes Water
Figure 4: Land cover classification using ML, NN and SVM classification that made use 10% and 90% training set.
CONCLUSION
This study evaluates the accuracy of ML, NN and SVM classification as the size of the training set increases. SVM produces accuracy that ranges from 93.2 to 92.68, the accuracy for ML ranges from 90% to 90.8% and NN, 20% to 70%. The result signifies that SVM gives the highest accuracy in all cases and appears to be the least influenced by changing training set size compared to ML and NN.
ACKNOWLEDGEMENTS
Table 1: Training set size and classification accuracy for ML, NN and SVM.
Classification Accuracy (%) Training Set Size
(%) Maximum Likelihood (ML) Neural Network (NN) Support Vector Machine (SVM)
10 89.9974 60.6436 92.669
20 90.7442 69.2231 92.9811
30 90.748 41.0099 92.9959
40 90.3801 43.5477 93.0554
50 90.8111 20.648 93.1074
60 90.7182 30.1527 93.1
70 90.5473 23.0335 93.1111
80 90.7108 24.2225 93.2189
90 90.6142 21.7776 93.1557
Maximum Likelihood (ML)
Neural Network (NN)
(a)
(b)
Support Vector Machine (SVM)
(c)
Figure 5: Relationship between training set size and classification accuracy for (a) ML, (b) NN and (c) SVM.
REFERENCES
[1] A. Ahmad and S. Quegan. Comparative Analysis of Supervised and Unsupervised Classification on Multispectral Data. Applied Mathematical Sciences, vol. 7, no. 74, pp. 3681-3694, 2013.
Sci.Int.26(4),1477-1481,2014 ISSN 1013-5316; CODEN: SINTE 8 1481
[3] Wilkinson, G.G. Results and implications of a study of fifteen years of satellite image classification experiments. IEEE Transactions on Geoscience and Remote Sensing, vol.43, no.3, pp. 433-440, 2005. [4] A. Ahmad. Analysis of Maximum Likelihood
Classification on Multispectral Data, Applied Mathematical Sciences, vol. 6, no.129, pp. 280-285, 2012.
[5] D. Lu and Q. Weng. A survey of image classification methods and techniques for improving classification performance, International Journal of Remote Sensing, vol. 28, issue 5, pp. 823-870, 2007.
[6] J. A. Richards and X. Jia. Remote Sensing Digital Image Analysis: An Introduction, 4th Ed., Springer, Berlin, Germany: 2005.
[7] A. Ahmad. Analysis of Maximum Likelihood Classification Technique on Landsat 5 TM Satellite Data of Tropical Land Covers. Proceedings of 2012 IEEE International Conference on Control System, Computing and Engineering (ICCSCE2012). pp. 1-6, 2012.
[8] Y. Chiang and L. Lin. Mapping overused slopelands from SPOT data using support vector machines and
artificial neural networks. Journal of Applied Remote Sensing, vol, 7, no. 1, 2013.
[9] N. I. S. Bahari, A. Ahmad and B. M. Aboobaider. Application of support vector machine for classification of multispectral data, 7th IGRSM International Remote Sensing & GIS Conference and Exhibition. IOP Conf. Series: Earth and Environmental Science 20, 2013.
[10] S. V. Stehman and R. L. Czaplewski. Design and Analysis for Thematic Map Accuracy Assessment: Fundamental Principles. Remote Sensing of Environment, vol. 64, Issue 3, pp. 331-344, 1998. [11] T. Kavzoglu and I. Colkesen. The effects of training set
size for performance of support vector machines and decision trees. Proceeding of the 10th International Symposium on Spatial Accuracy Assessment in Natural Resources and Environmental Sciences Florianopolis-SC, Brazil, July 10-13, 2012.
[12] William J. Blackwell and Frederick W. Chen. Neural Network Applications in High-Resolution Atmospheric Remote Sensing. Lincoln Laboratory Journal, vol. 15, No. 2, pp. 299-322, 2005
[13] .