Performance evaluation of stand alone hybrid PV-wind generator
M. N. M. Nasir, N. Z. Saharuddin, M. F. Sulaima, Mohd Hafiz Jali, W. M. Bukhari, Z. H. Bohari, and M. S. Yahaya
Citation: AIP Conference Proceedings 1660, 070040 (2015); doi: 10.1063/1.4915758 View online: http://dx.doi.org/10.1063/1.4915758
View Table of Contents: http://scitation.aip.org/content/aip/proceeding/aipcp/1660?ver=pdfcov Published by the AIP Publishing
Articles you may be interested in
A novel stand-alone mobile photovoltaic/wind turbine/ultracapacitor/battery bank hybrid power system J. Renewable Sustainable Energy 7, 023125 (2015); 10.1063/1.4918330
Design and energy control of stand-alone hybrid wind/photovoltaic/fuel cell power system supplying a desalination unit
J. Renewable Sustainable Energy 6, 043111 (2014); 10.1063/1.4891313
Stand-alone hybrid wind-photovoltaic power generation systems optimal sizing AIP Conf. Proc. 1558, 1253 (2013); 10.1063/1.4825738
Optimization of a stand‐alone Solar PV‐Wind‐DG Hybrid System for Distributed Power Generation at Sagar Island
AIP Conf. Proc. 1298, 260 (2010); 10.1063/1.3516313
Effect of wind speed and load power factor variation on optimal sizing of the machine and converters for double output induction generator based stand-alone wind energy conversion systems
J. Renewable Sustainable Energy 1, 013104 (2009); 10.1063/1.3076056
Performance Evaluation of Stand Alone Hybrid
PV-Wind Generator
M. N. M. Nasir
a, N. Z. Saharuddin
a, M. F. Sulaima
a, Mohd Hafiz Jali
a,
W. M. Bukhari
a, Z. H. Bohari
aand M. S. Yahaya
ba
Faculty of Electrical Engineering, Universiti Teknikal Malaysia Melaka (UTeM), Hang Tuah Jaya, 76100 Melaka, Malaysia
b
Faculty of Engineering Technology, Universiti Teknikal Malaysia Melaka (UTeM), Hang Tuah Jaya, 76100 Melaka, Malaysia
Abstract. This paper presents the performance evaluation of standalone hybrid system on Photovoltaic (PV)-Wind generator at Faculty of Electrical Engineering (FKE), UTeM. The hybrid PV-Wind in UTeM system is combining wind turbine system with the solar system and the energy capacity of this hybrid system can generate up to charge the battery and supply the LED street lighting load. The purpose of this project is to evaluate the performance of PV-Wind hybrid generator. Solar radiation meter has been used to measure the solar radiation and anemometer has been used to measure the wind speed. The effectiveness of the PV-Wind system is based on the various data that has been collected and compared between them. The result shows that hybrid system has greater reliability. Based on the solar result, the correlation coefficient shows strong relationship between the two variables of radiation and current. The reading output current followed by fluctuate of solar radiation. However, the correlation coefficient is shows moderate relationship between the two variables of wind speed and voltage. Hence, the wind turbine system in FKE show does not operate consistently to produce energy source for this hybrid system compare to PV system. When the wind system does not fully operate due to inconsistent energy source, the other system which is PV will operate and supply the load for equilibrate the extra load demand.
Keywords: PV-wind; hybrid; solar radiation; wind speed.
PACS: 88.
INTRODUCTION
Energy comes in various different forms such as light, heat, electric and other else. Energy may be transferred between various different forms. Nowadays there are another ways to obtained electrical energy which are more convenient, free pollution, unlimited and renewable like using solar energy, biomass energy, geothermal energy and wind energy. Solar and wind is an intermittent energy sources as it varies over time and do not usually meet load demands at all times. Among these two types of renewable energy, wind is the more affected source compare to photovoltaic due to its variability. In generally, the photovoltaic system also depends on the weather conditions and only can operate in 12 hours in a day. PV generation also provides a good solution for distributed energy generation especially in rural area [1].
HYBRID PV-WIND SYSTEM
In recent years, the hybrid energy system has been designed to generate electricity from combination of solar panels and wind turbine. Although the solar and wind energy are known as dependable and widely available renewable energy sources in Malaysia, but the intermittent energy sources will cause the power generator to produce a fluctuating output. The different type data of the solar radiation, wind speed and voltage charging has been collected of PV-Wind generator system in FKE. By using hybrid system, it will give a lot of advantages such as the possibility to combine two or more renewable energy sources, based on the natural local potential of the users. Besides, it also can protect the environmental especially in term of carbon dioxide (CO2) emissions reduction.
Hybrid system also can give diversity and security of the supply system. It costs also predictable and will not influenced by fuel price fluctuation, although it has fluctuation in the battery prices and it were incorporated [2-4]. Combining both PV and wind system can guarantee the high supply reliability, but in cloudy and no wind weather, it needs large storage capacity and it is very expensive [5, 6].
SYSTEM DESCRIPTION
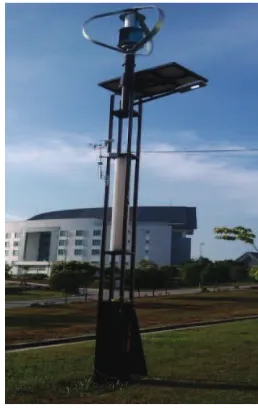
Universiti Teknikal Malaysia Melaka is situated at latitude 2°315” and longitude is 102°319”, Durian Tunggal, Melaka. Melaka has a tropical monsoon climate with a high annual temperature of between 24°C to 33°C. The region observes two different seasons during a year. Dry season and wet season are the two prevailing seasons. The dry season is from November to March when the winds blow predominately from the northeast and also the solar radiation will reach out around 800W/m² until 1000W/m². The weather is generally fine with nice cool sailing breeze but tends to be much dryer than other parts of Malaysia. The wet season prevails from the month of April till October. This research focused on developing hybrid system and investigation of output energy that produce from the prime energy which are PV and wind system to supply it to LED streetlight as the load of the system. To control the energy of the system, the solar charger controller and hybrid charger controller were used. Besides, the performance of the storage system will be investigated in terms of reliability and correlation performance of electrical characteristics. In this system, the battery of 24Vdc will use as the storage device of the system. FIGURE 1 shows the hybrid PV-wind system that developed at Faculty of Electrical Engineering (FKE), Universiti Teknikal Malaysia Melaka.
FIGURE 1. Hybrid PV-wind System installed at FKE.
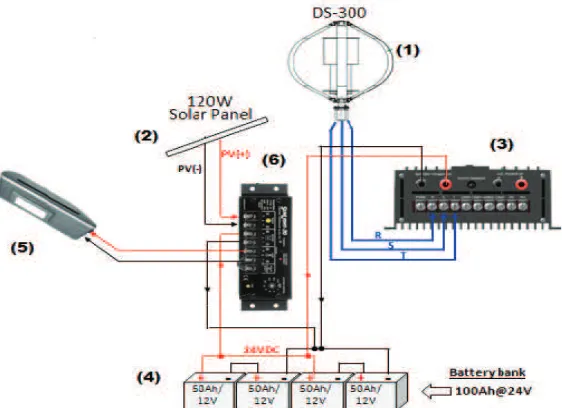
The PV-Wind hybrid system that were developed consists of six components which are wind turbine, solar panel, solar charger controller, and hybrid charger controller, LED street light and battery banks. FIGURE 2 shows the wiring diagram of the hybrid system. There are two controller which are hybrid charger controller and solar charger controller that were used to control the energy flow of the system. The type of wind turbine used is vertical axis wind turbine.
070040-2
FIGURE 2.
Schematic diagram of PV-wind standalone system.
PERFORMANCE EVALUATION AND RESULTS
Data were recorded by using ‘Fluke Power Quality Analyzer’. The variation data of solar radiation, wind speed, voltage and current has been recorded and plotted in the graph. The hybrid system is placed right behind Electrical Machine Laboratory at FKE. The results also shows the correlation coefficient between current,voltage towards wind speed and solar radiation by using following equation.
>
¦ ¦
¦
¦ ¦
@>
¦ ¦
@
y = value of wind speed/solar radiation and n = total number of data.Wind System Results and Analysis
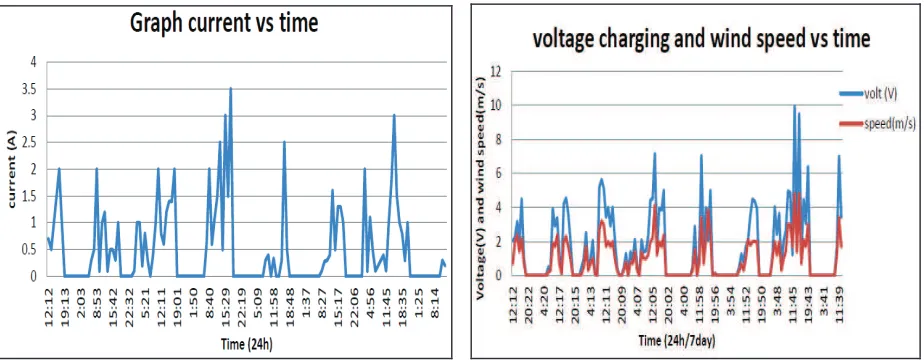
The results in FIGURE 3 shows the graphical representation of wind speed, voltage and current with the time is taken in 24 hours start from 12:11 on 23 April until 30 April 2013. The result in FIGURE 3 (a) and (b) shows the graphical representation of wind speed, voltage and current with the time in 24 hours start from 12:11 pm on 23rd
April until 30th April. The maximum speed was recorded is 5.1m/s at 20:25 on 29 April 2013 and the voltage
charging is about 10V and the current charging is 0.1A. On 29th April, the wind speed and voltage charging is not
consistent at the specific time from 12:11 to 20:00. After that, the wind speed drop slowly to 0m/s until 9:30am on 30th April. Nevertheless, the wind speed increase until 11:49 am. The wind speed and voltage charging has been
a) b)
FIGURE 3. (a) Graph wind speed and voltage charging vs time, (b) Graph current vs time
FIGURE 4. Graph wind speed from weather forecast from 23rd April until 30th April 2013.
From FIGURE 4, the graph shows wind speed data was collected from weather forecast in Melaka. The pattern of this graph is consistent for 7 days and the maximum of wind speed is 3.6m/s at 16:00 on 23 April, 10:00 on 24 April, 11:00 and 15:00 on 25 April, 16:00 on 26 April, 16:00 on 27 April. The data of wind speed from weather forecast shows fluctuation pattern and consistent with data collected.
FIGURE 5 shows the graph of wind speed versus voltage was plotted in 7 days. The maximum and minimum reading of wind speed has been plotted as Figure 5 which collected from 23rd April until 30th April.
FIGURE 5. Graph wind speed from 23rd April until 30th April 2013.
070040-4
The maximum of wind speed is 5.1m/s and the voltage is 10 V. The line from the graph shows the correlation between wind speed data and voltage from 23rd April until 30th April and the value of correlation (r) is 0.67. The
value of r = 0.67 shows the data in range of correlation coefficient which is from -1 to 1,which means this value correlation shows the two variables have moderate positive correlation. From the result analysis, the reading of wind speed shows fluctuation pattern follow the output voltage due to several factors. There are two factors the wind change occurs which are the pressure gradient and second is friction caused by air flowing over the ground, trees and buildings.
The total average wind speed of this week is around 0.93m/s and it’s not enough time to charge the battery of 24V for 7 days. Battery cannot be 100% discharge otherwise it may be permanently damaged. High speeds of wind can have unpleasant and unwanted side effects, while low wind speed is almost always welcome during hot and sticky summer day.
Solar Radiation Results and Analysis
The result of solar radiation obtained by using solar radiation meter and also ‘Fluke Power Quality Analyzer’ for voltage and current measurement on the PV system. The data recorded from 23rd April 2013 until 30th April 2013
data has been plotted as FIGURE 6.
a) b)
c)
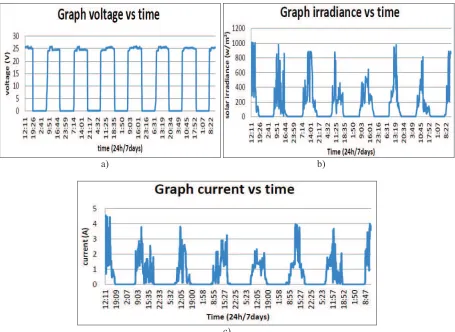
FIGURE 6. (a) Graph voltage vs time, (b) Graph radiation vs time, (c) Graph current vs time
The result in FIGURE 6 shows the graphical representation of solar radiation, voltage and current with the time which start from 12:11 pm on 23rd April until 30th April 2013. The graph show when at the night time there is no
voltage charging and current charging. This is because there is no radiation at the night time. The maximum of current charging in this week is 4.2A and the maximum radiation is 1009 W/m² on 23rd April. The reading of voltage
polar graph of radiation and current show fluctuated pattern in daytime. The solar radiation is very low on 27th April because it was rainy day.
FIGURE 7. Graph radiation vs voltage.
FIGURE 7 shows the graph of radiation versus voltage was plotted in 7 days. The maximum and minimum reading of solar radiation has been plotted as FIGURE 7 which was collected from 23rd April until 30th April. The
maximum radiation is 1009w/m² on 23rd April and the reading of voltage still maintains 25.3 V. The line from the
graph shows the correlation between data radiation and voltage from 23rd April until 30th April and the value of
correlation (r) is 0.27. The value correlation of 0.27 is in range of correlation coefficient from -1 to 1, which means this value correlation shows the two variables have weak positive correlation between radiation and voltage.
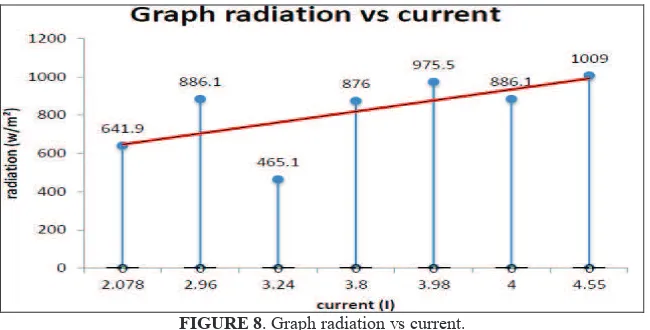
FIGURE 8 shows the graph of solar radiation versus current was plotted in 7 days. The maximum radiation is 1009w/m² on 23rd April and the reading of current is 4.55A. The red line from the graph shows the line of
correlation between radiation data and current from 23rd April until 30th April and the value of correlation (r) is
0.807 which means these two variables have strong positive correlation.
FIGURE 8. Graph radiation vs current.
For this hybrid system, the output voltage from solar panel are measured from open circuit voltage and also connected to the battery. In this case, the output voltage of PV system not followed the output radiation but the reading of output current shows fluctuation pattern and followed the solar radiation. The polar graph of radiation and current show fluctuated in daytime. From the analysis result, the solar radiation at FKE is enough to generate the electric and supply to the load. The changes reading of solar radiation causes the effect of the clouds which it covered the radiation from reach the solar panel. The cloud is one of the factors the reading radiation fluctuated. This is because the change in ionization is affected the nuclei of condensation for cloud formation. When the low solar activity occur, more cosmic rays reach earth and created the ultra-small aerosol particles which are cloud
070040-6
condensation nuclei form. It can conclude that a change in cosmic rays could cause the increase in certain types of clouds. Other than that, the weather condition is the main factor that causes reading solar radiation not consistent. The average voltage charging of this week is 23.47V were charging the battery smoothly with controller action. Battery cannot be 100% discharge otherwise it may be permanently damaged. The charge controller will protect the battery by reserving 10% of power and cut off the load at 24.4V. Over discharge the battery will shorten the life time. Hence the solar system in FKE shows the effectiveness in generate the electricity.
CONCLUSIONS
The hybrid PV-Wind system shows very optimal to use in FKE, UTeM. The overall hybrid system varying irradiation for PV model and changing wind speed for the wind model to determine the effectiveness of this system in FKE. As conclusion, the result shows that hybrid system has greater reliability based on the analysis. Based on the solar radiation result, the correlation coefficient is strong relationship between the two variables of radiation and current. However, the correlation coefficient is moderate relationship between the two variables of wind speed and voltage. Hence, the wind turbine system in FKE show does not operate consistent to produce energy source for this hybrid system compare to PV system. When the wind system does not fully operate due to inconsistent energy source, the other system like PV system will operate and supply the load for equilibrate the extra load demand. Hence, the hybrid PV-Wind generator is suitable build in FKE and effective to produce greater output power. Based on the data that analyzed, the best system that will produce energy is the PV system because it suitable for condition in Melaka area in term of radiation of sunlight in daylight. For the Wind system, it’s not yet reliable to be used in as a single source in the system. This is because the wind speed in this area is not suitable for generate enough energy, it can only be reliable to a certain time and not fixed as the PV system. As the conclusion the PV system is the best system to produced energy in this whole system. To maximise the utilisation of wind system, the hybrid charger needs to design specifically to suit the weather and surrounding environment of the system.
Depending on the regional topography of an area, weather conditions like monsoons, cyclones, hurricanes, and other freak condition of the weather can significantly alter the wind velocity. From the result of weather forecast, the wind speed is not accurate as speed of wind turbine in FKE. Finally, weather conditions have an important role in affecting the speeds of wind and solar radiation.
ACKNOWLEDGMENTS
The authors would like to acknowledge Centre of Excellence UTeM (CeRIA) and Universiti Teknikal Malaysia Melaka for the financial support of this research. This research is supported under the Research Acculturation Collaborative Effort Grant Scheme (RACE) with project code: FRGS(RACE)/2013/FKE/TK3/3/F00204.
REFERENCES
1. M. N. M. Nasir, A. Jusoh and A. Khamis, Applied Mechanics and Materials313 – 314, 853 (2013).
2. T. Chen and Jin Ming Yang, in 3rd International Conference on Power Electronics Systems and Applications, IEEE, Hong
Kong, 2009, pp. 1–4.
3. A. El-ayoubi and N. Moubayed, in International Conference and Exposition on Electrical and Power Engineering (EPE),
IEEE, Iasi, 2012, pp. 25–27.
4. R. Belfkira, O. Hajji, C. Nichita, G. Barakat, L. Havre and P. Lebon in: 2007 European Conference on Power Electronics and Applications, IEEE, Aalborg, 2007, pp. 1-10.
5. T. Ilakkia and G. Vijayagowri, in 2012 International Conference onAdvances in Engineering, Science and Management (ICAESM), IEEE, Tamil Nadu, 2012, pp. 303–308.
6. A. A. Ahmed and J. Bumby, in 4th IETn International Conference on Power Electronics, Machines and Drives, IEEE, York,
