SATELLITE-BASED METHOD FOR COMPUTING AIR POLLUTION
INDEX
1
Asmala Ahmad ,
2Mazlan Hashim,
3Noorazuan Md Hashim,
4Mohamad Nizam Ayof,
5Agus Setyo Budi
1,4,5Jabatan Sains & Matematik
Pusat Perkhidmatan Akademik
Kolej Universiti Teknikal Kebangsaan Malaysia (KUTKM) Locked Bag 1200, Ayer Keroh, 75450 Malacca, MALAYSIA Phone: 606-233 3034 Fax: 606-233 3144 E-mail: [email protected]
2Dept. of Remote Sensing
Faculty of Geoinformation Science and Engineering
Universiti Teknologi Malaysia (UTM), Locked Bag 791, 80990 Johor Bahru, MALAYSIA Phone: 07-550 2873 Fax: 07-556 6163 E-mail: [email protected]
3Pusat Pengajian Sosial, Pembangunan dan Persekitaran
Universiti Kebangsaan Malaysia (UKM), Bangi Phone: 03-8926 6213 E-mail: [email protected]
Abstract
The recent August 2005 haze episode was not a new experience for Malaysia as this phenomenon has been occurring almost every year. History revealed that the worst haze episode took place during May-November 1997. On the 23rd September 1997, the Sarawak capital, Kuching was declared in the state of emergency as its
Air pollution Index (API) reached 839. This was the highest API ever been recorded in Malaysia. This paper reports result of a study in order to compute API using satellite-based method. Seven dates of NOAA-14 AVHRR satellite recorded data were used, representing seven days during the September 1997 thick haze episode in Malaysia. Five locations of air pollution station were selected where major pollutants have been measured conventionally. Haze information was extracted from the satellite data using ‘sky-light’ model. Relationship between the satellite recorded reflectance and the corresponding pollutant measurement was determined using regression analysis. Finally, accuracy of the result was assessed using RMSE technique. The result proven that satellite-based method using space-borne remote sensing data was capable of computing API spatially and continuously.
Key Words
PM 10, NOAA-14 AVHRR, AQI, GIS
1 Introduction
Haze is said to be a partially opaque condition of the atmosphere caused by very tiny suspended solid or liquid particles in the air (Morris, 1975). Haze (originating from open burning or forest fire) usually contains large amount of particulate matter (e.g., organic matter, graphitic carbon). This particulate matter is hazardous to health, especially associated with lung and eye deceases. Besides that it is capable of reducing visibility, increasing the atmospheric greenhouse effects and affecting the tropospheric chemistry.
Coventionally, PM 10 can be measured from ground instruments such as air sampler, sun photometer and
optical particle counter, however these instruments is impractical if measurement are to be made over relatively large areas or for continuous monitoring.
The haze episode which occured during mid-May to November 1997 is considered the worst since 1980 ( five similar haze episodes had occured in April 1983, August 1990, June 1991, October 1991 and August 1994). On 19th September 1997 Malaysian government had declared that Kuching (capital of Sarawak) was in the
state of emergency when the PM10 API (Air Pollution Index) exceeded 650 (hazardous level). By 23rd
Figure. 1. Raw NOAA AVHRR data dated 22 September 1997. Location of the selected air pollution stations are damarcated as letter A,B,C,D and E designated for Kuala Lumpur, Prai, Pasir Gudang, Bukit Rambai, and Bukit Kuang respectively. Combination of band 1, 2 and 4 are used to visually differentiate between haze (orange), low clouds (yellow) and high clouds (white).
This paper reports results of a study to determine PM 10 from NOAA-14 AVHRR satellite data. Their concentration and spatial distribution will be quantified based on updated measurement system, AQI. This current study is an extension of previous work by Ahmad and Hashim (1997, 2000, 2002), and mazlan et. al (2004) that produced models to quantify haze in API.
2 Materials
This study involved the usage of three types of data namely; ground-truth data, satellite data and ancillary data.
2.1 Ground-truth data
Conventional measurements of haze were complementarily used throughout performing data processing for extraction of PM 10 information. PM 10 measurements in micrograms per meter cube (gm-3) from
1st to 30th September 1997 were carried out by ASMA (Alam Sekitar Malaysia Sdn. Bhd.) to represent the
actual haze intensity over the study area. For the purpose of this study, the measurement was later converted to AQI.
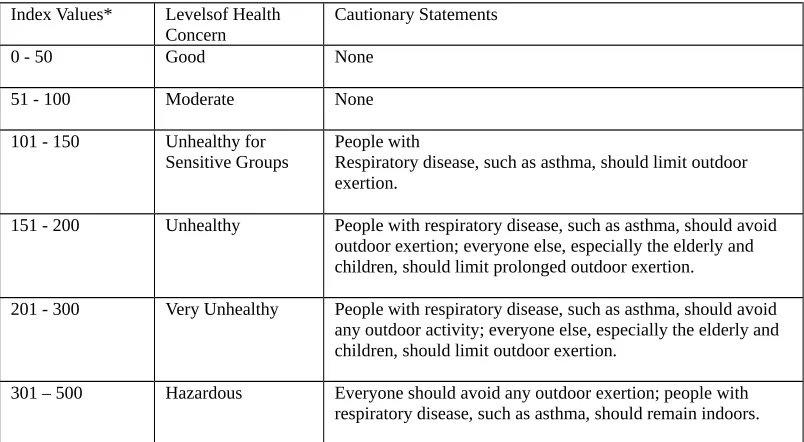
Table 1. Air Quality Index (AQI) for Particulate Matter up to 10 micrometers in diameter (PM 10)
Index Values* Levelsof Health
Concern Cautionary Statements
0 - 50 Good None
51 - 100 Moderate None
101 - 150 Unhealthy for
Sensitive Groups
People with
Respiratory disease, such as asthma, should limit outdoor exertion.
151 - 200 Unhealthy People with respiratory disease, such as asthma, should avoid
outdoor exertion; everyone else, especially the elderly and children, should limit prolonged outdoor exertion.
201 - 300 Very Unhealthy People with respiratory disease, such as asthma, should avoid
any outdoor activity; everyone else, especially the elderly and children, should limit outdoor exertion.
301 – 500 Hazardous Everyone should avoid any outdoor exertion; people with
respiratory disease, such as asthma, should remain indoors.
*An AQI of 100 for PM10 corresponds to a PM10 level of 150 micrograms per cubic meter (averaged over 24 hours).
Seven sets of NOAA-14 AVHRR data dated 22, 23, 25, 2, 28, 29 and 30 September 1997 acquired from SEAFDEC (Southeast Asia Fishery Development Centre) receiving station were used. NOAA-14 AVHRR was suitable for haze study as it offers high spectral and temporal resolution with a minimum cost. Some useful characteristics of NOAA-14 AVHRR satellite are shown in Table 2.
Table 2. NOAA-14 AVHRR sensor and spectral characteristics
AVHRR Sensor characteristics
Swath width 2399km
Resolution at nadir 1.1km approx.
Altitude 833km
Quantisation 10 bit
Orbit type Sun synchronous
No. of orbits per day 14.1 (approx.)
AVHRR Spectral characteristics
Channel No Wavelength Typical use
1 0.58 - 0.68 Daytime cloud, haze and surface mapping
2 0.725 - 1.00 Land-water boundaries
3 3.55 - 3.93 Night cloud mapping, sea surface temperature
3A N/A Snow and ice detection
3B N/A Night cloud mapping, sea surface temperature
4 10.30 - 11.30 Night cloud mapping, sea surface temperature
5 11.50 - 12.50 Sea surface temperature
(Source: Kidwell et al., 1995)
2.3 Ancillary data
Meteorological information over study area, including visibility (Figure 2), air temperature, pressure, relative humidity, wind, etc were obtained from MMS (Malaysian Meteorological Service).
3 Method
Three modules incorporated in this study are (1) Derivation of haze model, (2) Regression analysis, and (3) Accuracy Assessment.
3.1 Derivation of haze model
Prior to further data processing, post launch calibration of visible Band 1 NOAA-14 AVHRR was earlier implemented in order to compensate data degradation due to extreme temperature change before and after launching of AVHRR sensor to space (Rao et al., 1996). Clouds and haze were successfully differentiated using thresholding technique (Baum et al., 1997). This to ensure both were not being misinterpreted between each other. Model used in this study is based on Siegenthaler and Baumgartner (1996), which make use of skylight to indicate the existence of haze. Skylight is an indirect radiation, which occurs when radiation from the sun being scattered by elements within the haze layer. It is not a direct radiation, which is dominated by pixels on the earth surface. Figure 3 shows electromagnetic radiation path propagating from the sun towards the NOAA-14 AVHRR satellite penetrating through a haze layer. Path number 1, 3 and 4 are skylight caused by direct radiation, whereas path 2 is indirect radiation.
Figure 3. Model used in this study is based on the
skylight parameter (Source : Modified after
Siegenthaler and Baumgartner, 1996)
This model can be described by:
- R = L – V (1)
where, : reflectance recorded by satellite sensor,
R : reflectance from known object from earth surface ,
L : skylight, and
V : lost radiation caused by scattering and absorption.
3.2 Regression analysis
Calibration pixels of NOAA-14 AVHRR data were sampled within a radius of 2.5 km from each of the air pollution stations. The relationship between PM 10 AQI and satellite-recorded reflectance of band 1 AVHRR, were analysed using linear regression.
3.3 Accuracy Assessment
In order to verify the accuracy of the regression model, RMSE (Root-mean-squared Error) was implemented to the AQI values obtained by the model.
1 AQIcalculated AQImeasured 2 RMSE
n (2)
4 Results
The scatter plot for PM 10 versus satellite reflectance of band 1 NOAA AVHRR with its linear regression trend is shown in Figure 4 where the coefficient of determination, R2 is 0.5563. The linear
regression model can be expressed as:
PM 10(AQI) VS REFLECTANCE OF NOAA-14 AVHRR
Figure 4. PM 10 in AQI versus satellite reflectance in percentage. Linear regression trend is shown in black line
The RMSE varies accordingly for all the five PM 10 ground stations ranging from 7 to 62 and with the average of 33 (Table 3). It is believed that the relatively high RMSE was due to limited number of air pollution stations used. Future study will consider of using more air pollution stations as well as other value-added ancillary data in order gain better and reliable accuracy.
Table 3. Average RMSE for respective haze components at Penang and Johor Bahru
Location A B C D E
RMSE (AQI) 33 35 26 62 7
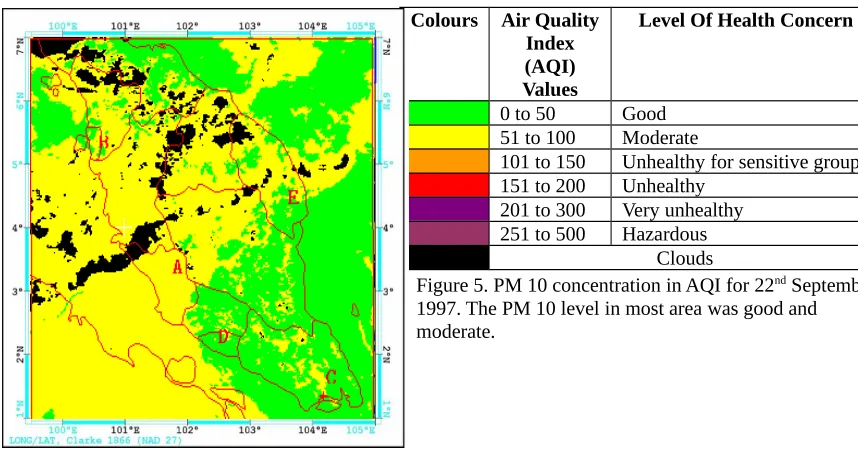
The spatial distribution of PM 10 can be shown in a colourful map (Figure 5) consisting of regions in green (good), yellow (moderate), orange (unhealthy for sensitive groups), red (unhealthy), purple (very unhealthy) and maroon (hazardous). Cautionary Statements for every region are given in detail in Table 1.
101 to 150 Unhealthy for sensitive groups 151 to 200 Unhealthy
201 to 300 Very unhealthy 251 to 500 Hazardous
Clouds
5 Discussion and Suggestion
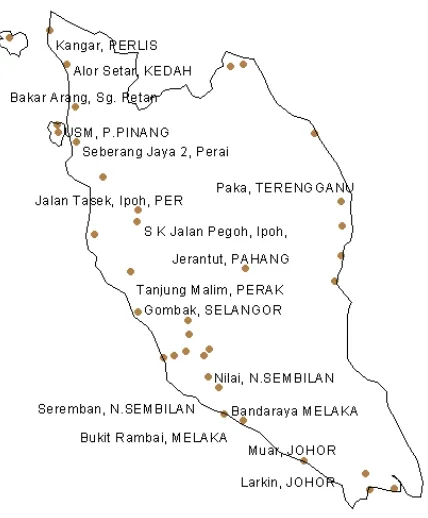
Integration of remote sensing and GIS (global positioning system) technology has been widely used in the field of atmospheric science related to air pollution. Our current and future studies on this field will focus on such integration. Besides that, the usage of 36 air pollution stations (Fig. 6) will increase the accuracy of the result (previously only five stations were used).
Figure 5. PM 10 concentration in AQI for 22nd September
Figure 6. Air pollutions stations used in current study
The use of GIS interpolation to map haze based on iso-lines seems to be successful. Some of the outcomes of using GIS to determine spatial distribution of PM 10 have been obtained as shown in Figure 7, 8 and 9.
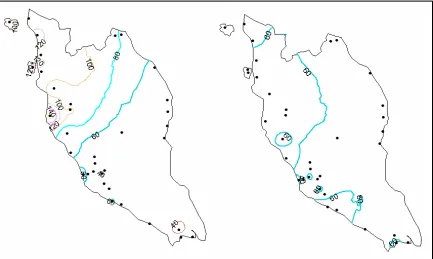
Figure 8. Iso-lines of PM 10 for 12 and 13 August 2005.
Figure 9. Iso-lines of PM 10 for 14 and 15 August 2005.
6 Conclusion
References
[1] Alam Sekitar Malaysia Sd. Bhd. (1998). “Measurement of Air Pollution Index (API).” ASMA: Unpublished.
[2] Asmala Ahmad and Mazlan Hashim (2002). “Determination of Haze Using NOAA-14 Satellite Data.” Proceedings on The 23rd Asian Conference on Remote Sensing 2002 in Kathmandu, Nepal,
25-29 November 2002.
[3] Asmala Ahmad, and Mazlan Hashim, (1997). “Determination of Haze from Satellite Remotely Sensed Data : Some Preliminary Results. “Proceedings on The 18th Asian Conference on Remote
Sensing 1997 at Nikko Hotel, Kuala Lumpur.
[4] Asmala Ahmad, and Mazlan Hashim, (2000). “Determination of Haze Air Pollution Index from Forest Fire Emission during the 1997 Thick Haze Episode in Malaysia using NOAA AVHRR Data.” Malaysian Journal of Remote Sensing& GIS. 1 : 77-84.
[5] Baum, B.A. (1997). “Discrimination between clouds and smoke/fires in daytime AVHRR data.”
NASA Langley Research Center Atmospheric Sciences Division Radiation Sciences Branch Homepage [Online] Available, http://asd-www.larc.nasa.gov/~baum/Pathfinder/smoke.html
[6] Kidwell, K. B., comp. and ed., 1995, NOAA-14 Polar Orbiter Data (TIROS-N, NOAA-14-6, NOAA-14-7, NOAA-14-8, NOAA-14-9, NOAA-14-10, NOAA-14-11, NOAA-14-12, and NOAA-14) Users Guide: Washington, D.C., NOAA-14/NESDIS.
[7] Malaysian Meteorological Service (1997a). : “Upper Air Data for September 1997.” Kuala Lumpur : MMS.
[8] Malaysian Meteorological Service (1997b). : “Visibility for September 1997.” Kuala Lumpur : MMS
[9] Mazlan Hashim, Kasturi Devi Kanniah, Asmala Ahmad, and Abdul Wahid Rasib (2004). “Remote Sensing of Tropospheric Pollutants Originating from 1997 Forest Fire in Southeast Asia.” Asian Journal of Geoinformatics. Vol. 4. No. 4 : 57 – 67.
[10] Morris, W (Ed). (1975). “The Heritage Illustrated Dictionary of English Language of The English Language.” New York : American Heritage Publishing Co.
[11] Rao, C.R.N. and Chen, J. (1996), “Post-launch calibration of the visible and near-infrared channels of the Advanced Very High Resolution Radiometer on the NOAA-14 spacecraft” International Journal of Remote Sensing, 17, 2743-2747.