DEVELOPMENT OF HUMAN MACHINE INTERFACE (HMI) WITH CUSTOMIZED
SCADA SYSTEM FOR LOW VOLTAGE DISTRIBUTION AUTOMATION SYSTEM
M. M.AHMED
W. L.SOO
Paper Presented at 1he International Conference on Engineering and ICT (ICEI 2007), 27 -28 Nov 2007, Hotel Equatorial Melaka.
UNIVERSITI TEKNIKAL MALAYSIA MELAKA
Development of Human Machine Interface (HMI) with
Customized SCADA System for Low Voltage Distribution
Automation System
M. M. Ahmed, Member, l EEE and W .
L.
Soo, IBEE Student MemberAbstract-- This paper presents the development of lluman Machine Interface (HMJ) for customized Supervisory Control and Data Acquisition (SCADA) at customer side distribution automation system (DAS). It is operate and control the low voltage (LY) down stream of 41 5/240V by using the Tenaga Nasional Bcrhad (TNB) distribution system. SCADA based Remote Terminal tl nit (RTU) alon g wi1 h power line co.mmun ication (PLC) system are used for DAS development that practically simulates the LV distribution system functions in an automated manner . It is the first DAS. research work done on customer side substation for operating and controlling between t he consumer side system and the substation. Most of the work is focused on building HMI that provides a graphical operator interface function to monitor the system. The HMI of SCADA system is de.veloped using 」 オ ウ エ ッ ュゥ セN・ 、@ software and an RTU microp rocessor and its software implements for L V operation and control pu rposes.
index Terms-- JfMl, SCADA Softwa re, Graphical
User loterface (GUI), Ala rm, E ve nt, T rending and Securi ty Syst em.
(. fNTRODUCTION
The SCADA software and service elements may include operator interface software, historical databases, report generators and systems documentation and training
[I
J.
SCADA software can be divided into two types, proprietary or open [2]. Open Software is gafoing more popularity because of its ability to mix different manufacturer's equipment on the sam e system compared to the proprietary software which was developed by the company to communicate to their own ha rdware. Citect and WonderWare are just two of the open software packages available on the market for SCAD A systems [3 ].
Compania Nacion al de Fuerza y Luz (CNFL) which is the ma in power distribution company in Costa Rica is among the utility company that is currently usi ng wonderware solution to develop their automation system.
[4]
Internati onal Standards Organization (JSO) has developed qpen systems interconnection (OSI) model in objective to
provide a framework for the coordination of standards
This イ ・Nセ・MNゥイ」ィ@ was supported t>y Uni vcrsiti Teknikal Mal :i.ysia (UTeM/. W.L Soo is '"Ith the Department ofElectricaJ Engineering, UTeM, Malaysia. M .M Ahmed is wilh the Department of Electric11l Engineering. UTeM.
Malaysia (e-mail: musseciilUieM.edu.my).
375
development within that common framework. The software problems of communication between equipment from any
manufacturer can be accomplished by following this standard. [5J
In 1988, the In tern ational Electro-technical Commission (lEC) began publish ing a standard framework entitled
' fEC
870 Telc-conlrol equipment and systems'. This was developed in scagcs from 1900 to 1995 to completely define an open protocol for SCADA communications. During the same period, which IEC 870 was progressively released, theDNP3 protocol was developed and released in North
America. DNP3 was designed specifically for SCADA
applications.
f
6]Center oper ator interface hardware mostly often consists of standard PC computers and LCD monitors with appropriate desks an d consoles. Medium and larger systems -are normally built with redundant display capability with seating for two or more operator personal. Reports and sometimes alarm systems are also furnished. UPS hardware
is normall y provided to protect against power outages unti l backup generation can be placed on-line.
II. P peratoセ@ rNTERFACE SOFTWJIRE
An important aspect of every SCADA system is th e computer sofhvare used within the system. When software is well defined, designed, written, che.cked, and tested, a successful SCADA system will likely be produced. Many
SCADA systems employ commercial propriety software
upon which tbe SCADA system is developed. A SCADA software used in this research is chosen based on the flexibility to interface with different types of software an d hardware an d p rovides friendly fea tures in developing a user inter face.
Con figurable operator interface software provides a graphica l operator interface (GUI) funct ion to monitor processes. T he monitoring task is a chalJenging task for user especially when the substation panel contains so many different parts. The user not onl y nec.ds to monitor th e equipment aod status of the equipment, bu t they also need to understand how the equipment and the devices are integrated to one another. This requires a balance of understanding what informa tion is pertinent to d isplay and what information would cause information overload.
Operator interface sotlware includes a library of standard g(aphical symbols, many of which would however not be applicable to the type of applications encountered in distribution system. The SCADA software in this research does oot provide symbols used in distribution system but
/ntemational Confcrcnct: on £ng fncering and !CT flCEJ Z007)
these symbols can be easily created. All sucn these symbols have been created for the distribution system in this research.
Standard windows editing facilities are provided such as zooming, re-sizing and scrolling. On-line configuration and customi7.ation of the MMl is possible for the users \Vith the appropriate privileges. Links can be created between display pages to navigate from one view to another. Users are a llocated to groups, which have the
definition of read/write access privileges to the process parameters in the system and this featu re is necessary so that the system should not be available to the ordinary operator to do any changes on the process parameters.
ID. HARDWARE INTERORA TION AND INTERFACING
o.
D•
DOMOOUl.E
ャャsセis@
Zセ@
y !
OUTPUT INPUT
POWO! AIW.'t SER
CUSTOMER SERVICE SU8 SfATIOl4 PAHCL
CONSUMER PAllfl
LEVEL 1
セ@
o. LEVEL 1D• 11
l2
-RlU
LEVEL l
DI "10DUl.E DO/OJ MODULE
RS-48S RS-48S
i
t
•
OUTl'llTPOWER IHPUl ANALYSER
I+-
SERl/lCF SUOSTATIOH PANELFig. I. System Architecture
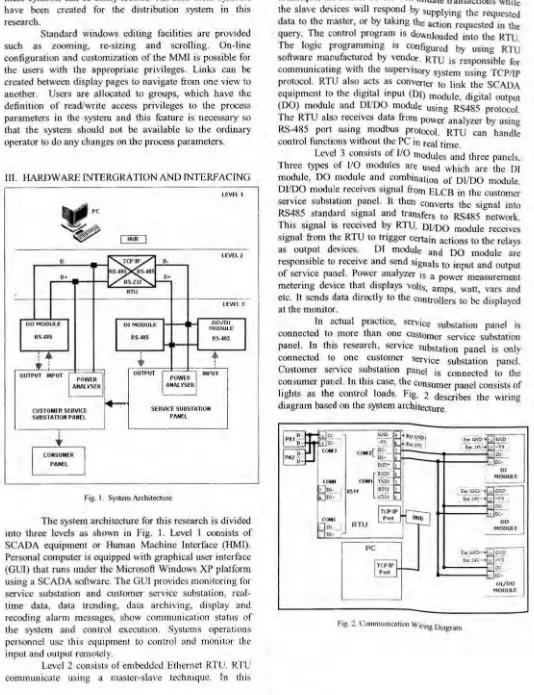
The system architecture for this research is divided into three levels as shown in Fig. I. Level l consists of SCADA equipment or Human Machine Interfuce (J-IMJ). Personal computer is equipped with graphical user interface (GUl ) that rw1s under the Microsoft Windows XP platform using a SC ADA sof1ware. The GUI provides monitoring for service substation and customer service substation. real-time data, data trending, data archiving, display and recoding alarm messages, show communication status of the system and control execution . Systems operations personnd use this equipment to control and monitor the input and output remotely.
Level 2 consists or embedded Ethernet RT U. RTU communicate using a master-slave technique. Tn this
376
technique, the master device will initiate tran sactions wh' I · the slavi:: de'Yiccs will
イ・ウーッセ、@
by supplying theイ ・アオ・
ウ エセセ@
data to the master, or by taking the action requested in tiI . 1e
query. t セ・@ contro ー イ セァイ。セ@ ts downloaded into the RTU. The logic programming is COofigured by using RTU software . ュ。 ⦅ョオヲ。」セ オイ ・、@ by vend?r· RTU is responsible for communicating with the supervisory system using TCP/lP protocol. RTU also acts as converter to link the SCADA equipment to the digital input (DJ) module. digital output (DO) module and _DI/ DO module using RS485 protocol. The RTU a lso イ セ」・ゥカ」ウ@ data from power analyzer by using RS-485 port using modbus Prntoeot. RTU can handle control functions without the PC in real time.
Level 3 consists of 1/0 modules and three panels. Tbree types of 110 modules are used which are the DI module, 0 0 module and combination of Dl/DO module.
DUDO module receives signal from ELCB in the customer service subslation panel. It then converts the signal into RS485 standard signal and transfers Lo RS485 network. This signal is received by RTU. DVDO module receives signal from the_ RTU to trigger certain actions to the relays as output devices. DJ module and DO module are
イ・ZG ー ッョセゥ「ャ・@ to receive and send signals to input and output
of scr:ice ー。セ・ ャN@ p ッキセ@ analyzer is a power measurement metering device エィ セエ@ displays volts, amps. watt, vars and etc. It sends data directly to the controllers to be displayed at the moni tor.
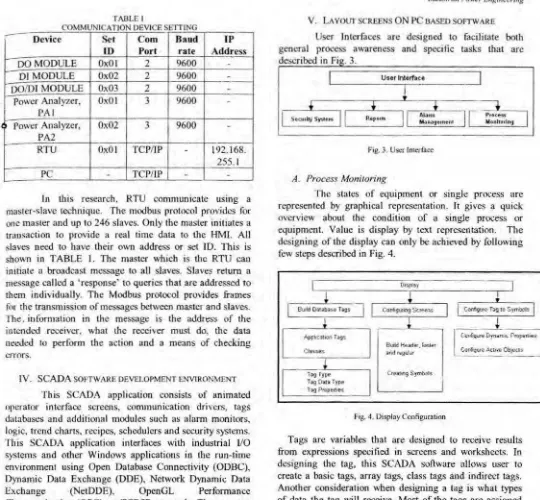
In actual practice, service substcition panel is connected to more tha n one customer service substation panel. Ta this resea rch, service substation panel is only connected to . one custo_mer service substation panel. Customer service substation panel is connected lo the c_onsumer panel. In th is case, エ ィ セ@ consumer panel consists of lights as the control loads. f 1g. 2 descri bes t be wiring dfagra m based on tbe system architecture.
Fig.'.!. Commu111cation Wiring Dtagr3m
MOO Ult
Ul/00 MOOIJI.(
[image:3.597.34.568.84.779.2]l"ABLE I
COMMUNI CATION OEVICF. SETTING ,
-
Device et Com Baud IPlO Port rate Address
DO MODULE
OxOl
29600
-DI
MODULEOx02
29600
-DO/DI MODULE
Ox03
2
9600
-Power Analyzer,
OxOl
39600
-PAI
0 Power Analyzer, Ox02 3
9600
-PA2
RTU OxOl TCPnP
-
192.168.
255. l
PC
-
TCP/IP --ln this resenrch, RTU communicate using a master-slave technique. The modbus protocol provides for
one master and up to 246 slaves. Only tbe mas ter initiates a transaction to provide a real time data to the HMl . All slaves need to have their own address or set ID. This is shown in TABLE I. The master whicb is tbe RTU cao
initiate a broadcas1 message to all slaves. Slaves return a message called a 'response' to queries that are addressed to chem individually. The Modbus protocol provides frames for che transmission of messages between master and slaves. The . iofom1ation in the message is the address of the intended receiver. what the rerei er must do, the data ueedcd to perform the action and a means of checking errors.
IV. SCADA SOl'TWAllE DEVELOPMENT ENVIRONMENT
Th is SCJ\DA appl ication consists of animated operator interface screens, communication dri vers, tags databases and additional modules such as alarm monitors logic. trend charts. recipes, schedulers and security systems: Th is SCADA application interfaces with industrial l/O systems and other Windows applications in the run-time environment using Open Database Connectivity (ODBC), Dynami c Data Exchange (ODE), Network Dyna mic Data
Exchange (NetDOE). OpcnGL Performance
Characterization (OPC), or TCP/JP protocols. The user can also operate the application through a standard Web browser such as Internet Explorer and Netscape.
The workspace window is a user-friendly interface that enables the user to find any application components such as tag, screens. and worksheets quickly and easily. The workspace contains four tabs which are database, graphics, tasks and comm (refer to communication). Database provides access to all databases tags and security-system components configured for the cu.rrent application. Graphics provide access to all screens and symbols in Lbe application . Tasks provide access to all task worksheets in the appli cation. Comm provides access to all drivers configured to establish communications with another devices or sollware progrnms usi ng available protocols.
377
Indus trial Power Engineerit1g
V. LAVOtJl SCREENS ON PC BASED SOFTWARE
User Interfaces are designed to facilitate both general process awareness and specific tasks that arc descrilx:d in Fi . 3.
Secmll)I SY"•m
User lnte!face
Rep Oii• Alaom
[image:4.597.26.566.54.554.2]M.:anage1ne.nt
Fig. 3. User lolerfilce
A. Process Monitoring
f"rocf!'H
Mo11llo11ng
The states of equipment or single process are represented by graphical representation. It gives a quick overview about the condition of a single process or equipment. Value is display by text representation. The designing of the display can only be acbieved by following few steps described in Fig. 4.
Build oセ 。「BGエ@ h g5
Tog Typ•
Tag Om Type Tag Propenin
bオ セ、@ Heade< . loole•
ond 1• 91Jf•1
CtoaMg Symbol s
Fig. 4. l)isplny Configu('llt.ion
Coniiguoe hg t o Symbol!
Ccnligure Dy,..n.1t Propenies
Tags are variables that are designed to receive resul ts from expressions specified in screens and worksheets. Io designing the tag, this SCADA software allows user to create a basic tags, array tags, class tags and indirect tags. Another consideration when designing a tag is what types of data tbe tag wi ll receive. Most of tbe tags are assigned with boolean or digital variables that represen1 0 or I. This data type is suitable to use fQr turning objects 'OFF' and ' ON ' or for closing and opening objects. Tag properties are attributes that are inherent to a database tag such as minimum and maximum val ues, size, description and so forth.
Application lags contain tags created during application development such as screen tags or tags that read from or write to field equipment. Class contains compound tags, called class tags. crcaled to associate a set of values rather than a single value with an object. Fig. 5 describes class C'fank. CTank contai ns class member which arc temperature, pressure and level.
International Co'!Jerence on Eng ineering and JCT (ICE/ 2007)
Name _ TYP.! _ 4 _ _ ーセ」セ ⦅ ッョ@
_J •
I 1 Temperature Real • rank temperature
I -
Mセ@
... ;
セZZセウオイ・@
Real • Tank pres-surer・セ i@ - · hnklevel
I __ _ •_ I 5
1 - -
--Fig" 5. Sanipk C T ank Worksheet
This SCADA application screen consists of three basic areas which are header, footer an d regular. Header is an object located at the top screen to provide standard information such as date and time, Footer is
an
object located at th e bottom of screen such an alarm object showing the last a lann. Reg ular is an area between th e header and footer to provide information about processes, alarm screens, trends, and so for th. This SCADA soflware allows building a symbol that represents certain equipment in the substation panel. Symbols can be built by grouping objects such as rectangu lar, line, polygon, and circle. Fig. 6 shows static objects toolbar that provides buttons to create these objects.fig. 6 . Static Object T oolbar
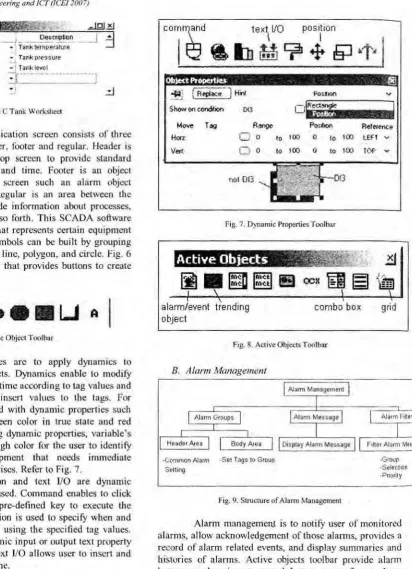
Dynamic properties are to apply dynamics to objects or a group of objects. Dynamics enable to modify object properties durin g runtime according to tag values and to execute commands or insert va lues to the tags. For example, an object assigned wi th dynamic properties such as position will turn to green color in true state and red color if in false state. Us ing dynamic properties, variable's data can be presented through color for the user to identify abnormality of th e equipment that needs immediate attention when a problem arises. Refer to Fig. 7 .
Command, position and text VO are dynamic proper ties that commonly used. Command enables to click on the obje.ct or press a pre-defined key to execute Urn
command at runtime. Position is used to specify when and where to display an object, using the specified tag values. Text 1/0 is to add the dynamic input or output text property to a selected text object. Text l/O allows user to insert and display tag values in real time.
Active objects shown in Fig. 8 provide user to create dynamic objects. Alarm/event control object is to add an alarrn/event control object to the application screen. Trend button is to exhibit trend curves of ta g data. Other active objects are list box, combo hox, smart messages text, push button, grid and alarm to display alarm messages.
378
*"'. ヲrセ
M I@ Kini Show on cor.di.i!W> 013J
Move Horr
Vert
ヲエセ@ Pos-ion r・ヲセ・ョ」MN・@
0
o 10 too o to 100 lfflL.1 o 10 too o to 100 TOP "
(14)! 0 13 -013
Fig. 7. Dynamic Properties Toolbar
セ@
liJ
111
セ@
[;;J
e
oAGセ@
セ@
r;J
セ セ@
alarm/event trending object
combo bo x
Fig. 8. Acrive Objects Toolbar
B. Alarm Jvfanagement
Alarm Management
l ·Ja11n gイセオーウ@ Alarm Message Header Alea Body Area Display Alarm Messa_ge
-C.on1mon Alarm -Set Tags to Group Setting
Fig, 9. Stntctur.: of Alarm Managemt:oL
grid
F11!e1 Al;;rm MeSSi'l' I
-Group -Selec110n -Pnoril y
Alarm managemen.t is to noti fy user of monitored a larms, allow acknowledgemenl of th ose alarms, provides a record of alarm related events, and display summaries and hish.ii"ies of alanns. Active objects toolbar provide alarm button or ala rm/event contTOI button lo configure a larm group, filtering alarm messages and displaying the alarm messages. Fig. 9 describes the ウエ イオセ エオイ ・@ of alarm management.
Alarm message is displ ayed to inform user of any problems or changes o f state du.ring process so that user can take corrective action. Two types of alarm message can be displayed which are on-line alarm messages or history alarm messages. The form al of a larm messages cau be de fined whether to include date, t imes, names, tags, and messages. The a larm ュ ・セウ。 ァ・@ contains a list of all alarms that are currently active and unacknowledged, active and
[image:5.595.154.567.53.623.2]acknowledged and cleared and unacknowledged.
Alarm filter is another feature that allows specifying filters for alarm messages. It contains some important field to define the filtering of alarm messages. Group field is to select and display alarm messages based on alarm groups which are digital or analog. Selection field is to display alarm messages that matched the character string specified by user in selection column. Priority range
0 field is to specify a range of alarm priority to be display as
alarm messages. For example, priority range field is assigned from 0 to 4. An object represents digital input is set to alarm priority 5. If object changed state and alarm is generated, it will not display alarm priority 5. Ack Tag field is to specify a tag name to filter and acknowledge the active alarm. Ack All Tag field is to specify a tag name to acknowledge all filtered active alarm. All tag will be assigned to certain alarm group. Alarm group is created in alarm worksheet. The alarm worksheet is divided into two areas. First area is header area which contains information for the whole group. Second area is body area where each tag in the group is defined with their alarm condition and messages. Header area contains common alarm setting which is described in Table 2.
TABLE2
COMMON ALARM SETilNG OF HEADER AREA
Field Description
Group Name Type a name to distinguish the alarm groups
Description Type a description of the alarm group for documentation purposes
Disable Type a tag to enable/disable all alarms
in the group
Remote Ack When the value of the tag in this field changes, the whole group will be acknowledged
Total Alarms Enter an integer tag to receive a value denoting the total number of active
alarms and unacknowledged
normalized alarms.
Total UnAck Enter an interger tag to receive a value
denoting the total number of
I unacknowledged alarms, regardless of
the alarm state
Display/ Save Specify the following parameters show
area in Table 2.
TABLE3
DISPLAY/SAVE AREA PARAMETERS
Parameter Description
Summary check-box When selected, sends alarm
messages to an alarm object on the screen
Ack check-box Demands the acknowledgment of
the alarm messages.
Beep check-box Sounds the beep until the alarm is acknowledged
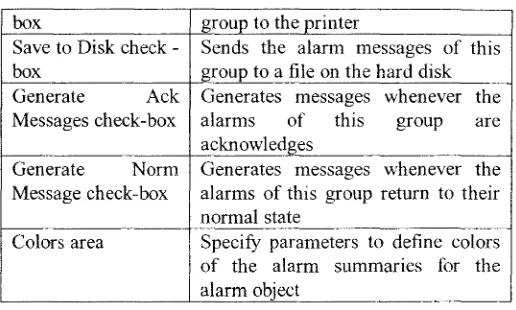
To Printer check- Sends each alarm message of this
379
Industrial Power Engineering
box group to the printer
Save to Disk check - Sends the alarm messages of this
box group to a file on the hard disk
Generate Ack Generates messages whenever the
Messages check-box alarms of this group are
acknowledges
Generate Norm Generates messages whenever the
Message check-box alarms of this group return to their normal state
Colors area Specify parameters to define colors of the alarm summanes for the alarm object
Table 4 shows how the SCADA software for Alarms module counts alarm event messages for the Total Alarms and Total UnAck field total. Body area contains alarm setting is describe in Table 5. Alarm states are defined as in Table 6.
TABLE4
COUNTS ALARM EVENT MESSAGES
Alarm Acknowledgement Counted Counted State State for Total for Total Alarms UnAck
Tag? Ta2?
Active Unacknowledged Yes Yes
Acknowledged Yes No
Normalized Unacknowledged Yes Yes
Acknowledged No No
TABLES
COMMON ALARM SETTING OF BODY AREA
Field Description
TagName Type a tag to be monitored by the alarm group
Type drop- To select one of the following alarm types: down list HiHi: Alarm limit is too high
Hi: Alarm limit is high Lo: Alarm limit is low LoLo: Alarm limit is too low
Limit Type a value-to limit the alarm generation
Message Type an alarm message to display
Priority Type an ゥョエセァ・イ@ number between 0 to 255 to indicate the priority within a group Selection Type a string to filter in the alarm
summary objects
Alarm When the alarm history file is enabled for
Summary a group, IWS saves the file as
ALyymmdd.ALH m the application's
[image:6.595.299.557.69.224.2].
c
/11tcm(J1i(J11al Conference Oft £11gi11l!ermg and /( / (TIE/ 2007)
TABLE6
,\l..ARM STA Tf'S
Alarm State Descript ion
Nonna I N o a la rm condition exists
Active Alarm is an d has been acknow ledged Acknowledged by the operator
Active Alarm is active but not
Unackn owledged ackn owledged by the operator C leared A larm condition has return ed to Unacknowledged normal State wi th out operator
acknowledgement.
C. Report
Reports features designed to select and display or prin t written s ummaries of his torical dara. Alarm/event object contains alarm fi lter tha L allows user to fi lter the data based on requirem ent s uch as filter by selection, filter by priority or filter by date.
D . Password-Based Security System
Security system is to configure their access privileges to tools a11d applications. User interfaces must be
designed to con trol user access. Access level assigned to an individual will dictate which workstations. in terfaces. and displays
a
user has access to, and w hi ch operations th e user can perform. Records of op erator acti ons should include th e operator' s identity, as confirmed by user accoun t logia in formati on.User groups are defined to group users under specific grou ps. Security level defines the securi ty level for
a group (0 to 255).Every object used for data inpu t on
a
screen has a security level fie ld. New users a re creaLed and associated these users to the gi:oup accounts crea ted for them. B y check the User which is blocked checked-box, the user is not able to access th e application.In the system user enlry modu le, user can enter th e system 's user name, password and pennissions. The system usage permissions can be divided into two categories which are genera l operator and system administrator. As gen eral system operator, one can only use data query m odule, and graphics d isplay module etc. As system adminis trator, th e user can use all modules available.
VT. l lMJ SCREEN ARCHITECTURE
I
Login StroenI
I I
I
Oispl•y Oa10 S<•••nI
I
I I l
: I Con1tol Sue•n I
I
Alom1 11 Event 11 T1ondi119I
I 01he1s IM11i1H-cree11.5(:1 。 ヲ セi oi sci@ even1.1c1 91aphselec1iou.set about.scr
StrvkeSnbstarion.stl 91oph_Al.s<1 user.scr
c オウQP QQQ P Qs・イカゥ 」・sオ ャ^ウエイゥッョャNウ セ Q@ 91•ph_A2.•t1 ltS.el j セcA ossNscヲ@
91 aph_ Vl.sc1 91•ph_l/'2.1C1 hlsda1a .s<:1
1ab Al.sci
IJb -A2 .w
ldb- V1 .s<I
1'1(V2 .s<:1
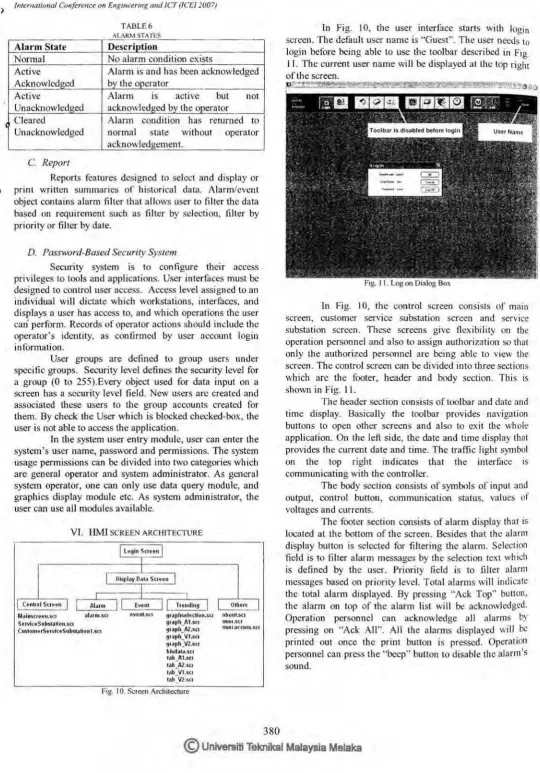
Fig. 10. Screen Architecture
380
In Fig. I 0, the user interface s tarts with login screen. T he default user na me is ''Gues t". The user needs
to
login before being able to use th e tooJbar described in Fig. 11. The current user name wi ll be displayed at th e top right of th e screen.Fig. 11. Log on Dia log Box
In Fig. 10, the control screen consists of mairi
screen, customer service s ubstation screen and service substati on screen. These screens give tl exibili1 y on the
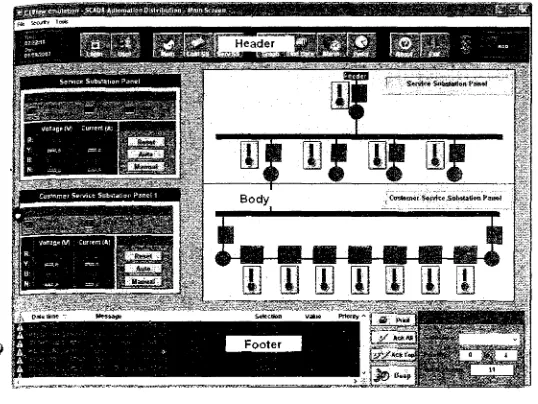
operation personnel and also to assign authorization so that only the authorized personnel are bei ng able to view the screen. The control screen cao be divided into three secti ons which ar e th e footer, header and body section . This is s hown in fi g. 11.
The header section consists of tool bar an d date and time display. Basicall y the toolbar provides naviga tion buttons to open other screens and also to exi t th e whole application. On the left side, the date and Lime dis play that provides th e current date and time. The traffi c light symbol on the top ri ghc indi cates that th e interface is communicating with the controller.
The body section consists of symbols or input a11d output, con trol button , communication status, va lues of voltages and currents.
The footer section cons ists of a larm di spla y th at is located at the bottom of th e screen. Besides that th e a larm di splay button is selected for filtering th e alarm. Selecti on field is to filter alarm messages by the selection text whi.:h is de fined by the user. Priority fi eld is to filter alarm messages based on priority level. Total alarms w ill indicate the total alarm dis played . By pressing "Ack T op" button. th e aJarm on top of th e alarm list wil l be acknowledgi:d. Operation personnel can acknowledge all a larms by
pressi ng on "Ack A ll". All th e a larms displayed wi ll be printed out once the print button is pressed. Operat ion p ersonn el ca n press the "beep " button to disable th e alarm's sound.
[image:7.595.21.562.55.829.2]Fig. 12. The Main Screen
Fig. 12 shows the main screen. Main screen displays both panels which are service substation panel and customer service substation panel. Each symbol created is assigned to a tag that is already issued to certain network address that linked to the variable in SCADA hardware application.
' The symbols changed to red color to indicate false lt status and green color to indicate true status. Appendix B.2 shows the service substation panel and customer service substation panel.
The displayed data on the screen consists of alarm screen, event screen, graph screen and table screen. Fig. 13
e
shows the alarm screen. History alarms display alarm messages from the history database while online alarms display current alarm messages.Fig. 13. Alarm Screen
Each tag is configured to the alarm parameters such as group, priority, selection, message, type and limit. Group is refers to the type of group and whether it is digital or analog. Priority is to indicate the priority within the
381
Industrial Power Engineering
alarm group. Tags with a higher priority must have a higher priority value. Selection is used to filter in the alarm summary objects. Message is to message the associated alarm that will be displayed on the Alarm/Event Control object. The type is refers to the type of alarm such as "Hi", "Lo", "HiHi" and "LoLo". Limit is the limit value associated to the alarm.
Event screen displays the list of event triggered by the operation personnel. For example, the event of pressing the reset button will be captured and displayed in event screen. Operation personnel can set specific date of event to be displayed or clicked on "today" button to display event that happened today. Fig. 14 shows the event screen and Table 7 listed the captured events.
Fig. 14. Event Screen TABLE 7
LIST OF CAPTURED EVENTS
Date Time Event
01/08/2007 11. l 0.34.593 Manual button (lampl) is pressed -off
01/08/2007 11. l 0.34.593 Manual button (lamp2) IS
pressed -off
01/08/2007 11.10.34.593 Manual button (lamp3) IS
oressed -off
01/08/2007 11.10.34.593 Manual button (lamp4) IS
pressed -off
01/08/2007 11.10.34.593 Manual button (lamp5) IS
oressed -off
01/08/2007 11.10.34.593 Manual button (lamp6) IS
pressed -off
01/08/2007 11. l 0.34.593 Manual button (lamp7) IS
pressed -off
01/08/2007 11.10.34.593 Manual button pressed
The graph will provide on-line data of voltage and current from the power analyzer. "Cursor" a button at the top of the graph can be dragged to know the value along a certain position of the graph. X-axis and Y-axis can be set to the user preferences. A combo box on the left side of the graph is to change the x-axis. Start Date, Start Time and
[image:8.595.18.287.71.273.2] [image:8.595.298.556.249.447.2] [image:8.595.23.558.487.698.2]international Conference on Engineering and JCT (ICEJ 2007)
duration are to set the y-axis. Fig. 15 describes the trending screen for service substation panel to display current values.
Fig. 15. Gruph Current for Service Substation Panel
By
clicking on the "Show Tabular" button, screen shown in Fig. 16 will be displayed. This screen is to display the graph data in a table form . The value is archived from the graph shown in the trending screen. "Reload'' button is to update the table based on the graph.,.,.
..
,._,._
,,_·-U'1,... ,,,.
..
-
.._
·-
..
-""""
.._ttl)"l'Mit
'"""
...
-,.
...._
.,,.,.-
,,_
-
..
-,.,,._
...
-
-""""
-
··-
-...
- -
...
_
-U1l,. . . . .
""'" "**
·-
,._
-
"""" ...·-
-
-
-
..
-
--...
IJ セ I LNNN@...
-
.._- -
--
·-
-
--
,_.-
-
--Fig. 16. Table of Current Data for Service Substation Panel
User dialog box is to create new user, delete user, block and unblock user. Fig. 17 shows the user dialog box.
When "New User/ Delete User'' button is pressed, the screen shown in Fig. 18 will be displayed. User can be blocked from accessing the application by clicking on "Block User'' button. "Unblock User" button will undo the block user action. User can be removed by clicking on " Remove User". ''User Access" is to set which screens that are allowed to be accessed under certain user g roup. Fig. 2 1
illustrates the user access dialog box.
382
··u
セ i@ [image:9.595.27.557.55.809.2]• セイ@ セ@
... ,..,
Qィ・ Nイ h 。 ュ セZ@ .._
_______
__,,..._.I
bャエセuウ・ イ@l
.UnBlock UserI
Remove UserI"
. User Acx:ess,·
Fig. 17. User Dialog Box
User Account: •
r-j-- ···-· . . · - - - -
MMM セ セ@lai _ _ ___ -- --
-Group Account:
Q
eョァセ・セイ M
-I
I
J
I
New .•.
Delete
[ Settings ... ]
!Guest
OperGl!or
0
User is blockedDK
Fig. 18. User Account Dialog Box
" New'' button is to create new user and a dialog box as shown in Fig. 19 and will be displayed. "Delete'· button is to delete user. A confirmation message box will displayed to confirm the deleted action. "Setting" but1on is to change the password of the selected user as shown in Fig. 20. User can also be blocked by checking lhe check box which indicates that this "user is blocked".
- - -
.
•New User Account
[8J
UserName: f
User Full Name:
c=---.
New Passw01d:r -·
..____ _
_ J
Confirm Passwoid: セMMᄋ@
..
Security Group: セ g[Z[M・セ@ - v
j
1 - - - - -- - - -- --i - - - -.... EngineerThe 'Usei Full
Nam1i!ll•••••••I
documentation purp Operator'--'---'
CanedFig. 19. New User Account Dialog Box
User Full Name:
!!II
New Password: . •••
Con/i1m Paseword: ·
The 'User Full Name' is an oplional setting used for
documentation purposes only.
[image:10.595.34.561.26.830.2]I.
OK JI
CancelFig. 20. Setting Oialog BolC
User Group:
Screelf Allowed To a セ・ウウ[@
Ouser.
O Main
ッ 」セウウ M P aエセョMq N@
OS·ervss·
...
Fig. 2 I. User Access Dialog Box
VfL SYSTEMOPERATION
After success login to the sysldm, control screen to be displayed is chosen from the toolbar. An example is shown in
h g.
22, when "Serv SS" button is pressed, the service substalion screen will be displayed. Currently all outputs are in healthy conditions. Tbe communication status shows no communication error with the modules as well as the power analyzer.セ@
....
Fig. 22 . Healthy Condition セエ@ Service Substation
Panel-383
Industrial Power E11gi11eeri11g
If fault occurs, all symbols that represented the outputs will change to red colors pattern showing that all
tl1e circuit breakers are turned off. This is show11 in Fig. 23 Alarms wi ll be triggered and displayed on the screen.
Fig. 23 . Unhealthy Condition at Service Substation Panel
In the alarm list, the blLle color text indicates that the output has changed to healthy status and the red color text indicates that the output is still remained unhealthy. Once the fault points have been checked and repaired, the " Reset" button is pressed to reset the counter and logic programme.
Fig. 24. Fault Isolation at Service Substation Panel
YUL CONCLUSIONS
The main contribution oft.h e work in this research project is to develop and design a distribution automation system aimed at the low voltage (L V) distribution system. It
is to develop a customi zed SCA DA system which operated and controls the LV system in an automated manner. The
SCADA system provides grap hical user interface, alarm, data logging and report management facilities for the
International Co11fert!11ce 011 engineering and !CT (ICE/ 2007)
operator to interact with the equipment in service substation and customer service su bstation . Much of the manual verification can now be done at the click of a mouse. This research helps to optimize staff efficiency by deploying staff to on-site location only when necessary. The usage of RTU allows for future expansion. Tht: customized SCADA , system is capable of improving the ability to monitor and control equipment at the service substation and customer d ervice substation.
IX. FUTURE SUGGESTION
This research project is a step towards developing customized SCADA for low voltage (LV) distribution system and much more work lies ahead in evaluating new SCADA technology and in developing new SCADA applications. However, the outcome of this research as first effort has been very encouraging and bringing beneficial to the distribution system in SCADA research development in the future. Here are few suggestions that wiU lead a new research p rojects in the future:
a) Using web base application as GUl supported by IP-based computer networks and internet connectivity as ,communication network to remote sites.
b) An automated solutions ro the distribution system comprising automation-ready buiJding blocks such as a synthesis of srate-of-the-art indi"idual components (distribution switchgear, fault passage indication, RTU, local power supplies, and communications interfaces), integrated to form complete functional devices. These devices are assembled into a system to solve the complete control or automa tion needs of each distribution network.
c) Data collection of not only the status of circuit breakers and relays but also status of each component in the panels. This will help to reduce black-out due to equipment malfunctions.
X. REFERENCES
l 1 J Colin Bayliss. "Transmission and Distriburion Electrical
Engineering··, Second edition 1999. ISBN 0 7506 4056
[2) Gordon Clarke, "Prartical Modern SCIJDA protocols: DNPJ. 60870.5 and Related Sy.rtems ". 2004. ISBN 07506 7995, pp. 15
(3 J Gordon Clarke, "Practical Modi:rn SCIJDA prowcols: DNPJ. 60870.5
and Related Systi:ms", 2004, ISBN 07506 7995, pp. 15
(4) Invensys Systems. Inc, "SCADA Snlution for Power Delivery ... Copyright 2005
(5) Gordon Clarke, "Practical Modem SC ADA protocols: DNPJ. 60870.5
and Related Systems", 2004, ISBN 07506 7995, pp.57
[6) Gordon Clarke, "Practical Modem SCADA proto,·ol.r: DNPJ, 60870.5
and Related Systems··. 2004, ISBN 07506 7995. pp.77
[7] Customi1Ald Non-i111em1ptible Distribution Automation System, Short Term Pro1ect No. PJP/2006/FKE (1), UTeM. 2005-2006
[8] Intelligent Distribution Autom3tion Sym.em: Customized SCADA Based RTU For Dismbuuon Automation System, M.Sc. Research Project. UTeM. 2005-2007.
384
XI. BIOGRAPlHES
Or. Musse Mohamud Ahmed is a scn10 lecturer at Faculty of electrical Eng1neerin r Universni Teknikal Malaysia Melalul Hャヲtエmセ@ He graduated from Somali National Univeis1
fy
(SNU) tn 1984. NWFP uョゥセウゥエケ@ of Engineering & Technology. Peshawar, Pakistan in 1996 and Uruversiti Tek.nologi Malaysia t | セ@ (t.rrM) in RPセP@ and got his B.Sc. , M.Sc. and セ@ Ph.D. respccuvcly. He worked Multimedia : 1; セ@ 11
1 "
University (MMU) as a lecturer at the Faculty eofEngineering & Technology in Malacca campus
from 2000 10 2002 . He joined UTEM in March 2002 asa lecturer. Jo October
2002, he was appointed as deputy dean, postgraduate studies, research & development at the Faculry of Elc!etrical Engineering. UfEM, a positioo he held till Match 2007. Since then he has been worbng ill UTEM. Dr. mオ セウ・@
has been IEEE-PES member for seven years and Executive Committee for tht· ャ。セゥ@ five years. His research ゥョエ・イ・NセエNウ@ include; Distribution Automation System. Power Sysh:m Operation and Coor.rol Simulation & Modeling of Large Powc1
Systems, lntc.lligent Power Systems, Energy & Renewable Energy a.nd Risk
Assessment of Elccuicity Supply
o Wai l..ian was born in l\ofal3cca, Malaysi3. un June 3. 1978. She received her B.S degree in electrical engineering from the University Tcclmology M:ilaysia (Ul'M ). She 1s studying in Un 1versi11 t・ォョャォセi@ Malaysia Melaka (UcTM) for master 、セN@ She is SJltleializiog m power system.