Large eddy simulation of flow past road vehicles subjected
to pitching oscillation
S. Y. Cheng1 and M. Tsubokura2
Hokkaido University, Sapporo, Hokkaido 060-8628, Japan T. Nakashima3
Hiroshima University, Higashi-Hiroshima, Hiroshima 739-8527, Japan and
Y. Okada4 and T. Nouzawa5
Mazda Motor Corporation, Aki-gun, Hiroshima 730-8670, Japan
We examine the unsteady aerodynamic effect on pitching stability of road vehicle by large eddy simulation. To probe the vehicle's dynamic response, a forced-sinusoidal-pitching oscillation was imposed on the vehicles during the simulation. For validation purpose, we compare the numerical result with wind tunnel measurement. The simulation result shows the strong influence of unsteady flow structures around the rear end of the vehicles on their pitching stability. These flow structures include the front and rear pillar vortices and cross flow component above the trunk deck. The configuration of curved front pillar coupled with sharp-edged rear pillar produce a trend for the unsteady aerodynamic force to restrain the pitching motion, while the presence of front pillar vortices, which are associated with sharp-edge front pillar configuration, resulted in a tendency for enhancing the pitching motion.
I.
Introduction
ONVENTIONALLY, development of road vehicle aerodynamics was mainly focused on the steady-state component, particularly the drag coefficient, which was obtained through wind tunnel measurement or CFD computation. This trend was first carryover from aeronautical practice in the early 20 century. At that time, low engine power and bad road condition did not permit high driving speed, and thus aerodynamic was not playing any important roles. Hence, beside the attempts to reduce drag for achieving higher driving speeds, not much attention has been paid in regard of other aspects of vehicle aerodynamics. Today however, vehicles can run at much higher speed, and thus aerodynamic influences on driving stability become significant. Consequently, the mean drag coefficient alone can no longer adequately reflect the vehicle’s performance in real life. To improve realism in
vehicle’s aerodynamic assessment, it is important to take into consideration the dynamic aspect of the aerodynamic forces and moments.
In this study, we conducted Large Eddy Simulation (LES) on flow past two vehicle models to investigate their pitching stability characteristics. During the LES, sinusoidal-forced-pitching oscillation was imposed on the vehicle
1
Ph.D. Student, Division of Mechanical and Space Engineering, Graduate School of Engineering, Hokkaido University, Kita-13, Nishi-8, Kita-ku, Sapproro, 060-8628, Japan.
2 Associate Professor, Division of Mechanical and Space Engineering, Graduate School of Engineering, Hokkaido University, Kita-13, Nishi-8, Kita-ku, Sapproro, 060-8628, Japan. Member AIAA; [email protected] (Corresponding Author)
3 Assistant professor, Department of Social and Environmental Engineering, Graduate School of Engineering, Hiroshima University, 1-4-1 Higashi-Hiroshima, Hiroshima, 739857, Japan, member. Member AIAA.
4
General Manager, Vehicle Testing & Research Department, Mazda Motor Corporation, Aki Gun, Hiroshima 7308670, Japan.
5 Staff Manager, Engineering Systems Department, IT Solution Division, Mazda Motor Corporation, Aki Gun, Hiroshima 7308670, Japan.
models to probe their dynamic responses. The computed pitch moment was phase averaged, and decomposed to estimate their aerodynamic damping factors. Then, flow visualization was performed to examine the damping mechanism which causes the difference in the pitching stability behavior of the notchback models.
II.
Simplified vehicle models
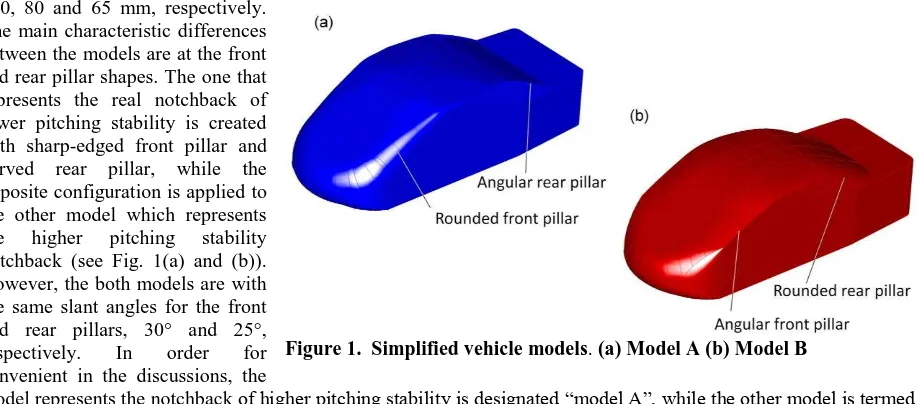
Two 1:20 scale simplified vehicle models represent the real production vehicles of different pitching stability characteristics were investigated. The models have the same measurements in height, width, and length, namely, 210, 80 and 65 mm, respectively.
The main characteristic differences between the models are at the front and rear pillar shapes. The one that represents the real notchback of lower pitching stability is created with sharp-edged front pillar and curved rear pillar, while the opposite configuration is applied to the other model which represents the higher pitching stability notchback (see Fig. 1(a) and (b)). However, the both models are with the same slant angles for the front and rear pillars, 30° and 25°, respectively. In order for convenient in the discussions, the
model represents the notchback of higher pitching stability is designated “model A”, while the other model is termed
“model B”, thereafter.
III.
Numerical Methods
A. Computational Code
We performed the LES computation by using an in-house CFD code “FrontFlow/red-Aero”, which was
originally developed under the project “Frontier Simulation Software for Industrial Science”, and optimized for
vehicle aerodynamics simulation by Tsubokura et al (2009a) under the projects “Revolutionary Simulation Software
(RSS21)”. The code has been validated successfully in the previous works by Tsubokura et al (2009b) by comparing the numerical results with wind tunnel measurements. For instance, the good agreement is obtained in the pressure distribution along the centerline of ASMO model, and flow field around a full-scale production car with complicated engine room and under body geometry. For the details of the validation, readers are referred to Tsubokura et al (2009b).
B. Governing equations
The governing equations being solved in the LES are spatially filtered continuity and Navier-Stokes equations:
0 ui xi
(1)
2
p
Sij SGS
ui u u
i j
t xj xi xj
(2)
/ 3/ u ui j u ui j p
P
(3)where ui, p, ρ, and ν are the i-th velocity component, pressure, density, and kinematic viscosity of the fluid. The over-bar indicates the spatially filtered quantity. The strain rate tensor Sij are defined as
1 2
uj u i Sij
xi xj
(4)
The standard Smagorinsky model [7] is used to model the subgrid-scale (SGS) eddy viscosity νSGS in Eq. (2):
s
ij ijSGS
C
f
2
S
S
2
(5)where ∆ is the width of the spatial filter which is determined by the volume of numerical element. The model coefficient Cs of 0.15 is used. As for the dumping of the effect of νSGS in the vicinity of solid boundary, Van Driest dumping function fd is used:
25 /
2
1
yd
e
f
(6)where y+ is the wall distance. C. Discretization
The governing equations are discretized by using the vertex-centered unstructured finite volume method. In this method, the governing equations are arranged in the following integral form that describes the conservation of any intensive properties Φ of the flow (for mass conservation, Φ = 1; for momentum conservation, Φ = ν; for conservation of a scalar, Φ represents the conserved property per unit mass):
t
V
dV
S
ν
.
n
dS
Sgrad
.
n
dS
(7) where the second term on the left hand side and the term on the right
hand side are convective and diffusion terms, respectively.
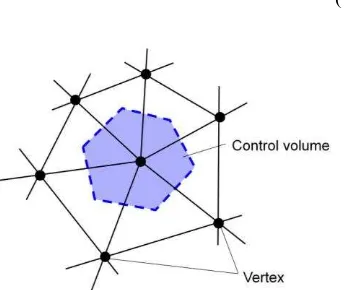
We defined each dependent variable on the vertex of the numerical elements and constructed a virtual control volume around the vertex. Fig. 2 shows a simplified two dimensional graphical illustration of a vertex-centered control volume). Governing equations are integrated over the volume.
The second-order central differencing scheme was applied for the spatial derivatives and blending of 5% first-order upwind scheme for the convection term was exploited for numerical stability. For time advancement, Euler implicit scheme was used. The pressure-velocity coupling was preserved by using SMAC (Simplified Marker and Cell) algorithm.
D. Computational domain and boundary conditions
The shape of the computational domain resembles a rectangular duct, which covered 3.14L upstream of the vehicle model, 6.86L downstream, 4.0W on both sides, and a height of 7.2H. It encompasses 16 million elements with 5 million nodes. In addition, finer elements are constructed nearby the vehicle models to capture more details of the flow information around the vehicles (see Fig. 3). Fifteen layers of prism mesh are generated from the surface of the vehicle models with the first layer’s
thickness of 0.1 mm. The typical wall distance of the first nearest grid point is less than 4 in the wall unit (y+), so it is well within the logarithmic layer of the mean velocity profile.
At the inlet boundary, the approach flow was set to be a constant, uniform velocity of 16.7 m/s, which corresponds to Reynolds number Re of 2.3 x 10⁵, based on the vehicle model length L. At the outflow boundary, zero gradient condition was imposed. The ground surface was divided into two regions. The first region which was 3.0L from the inlet was defined as free-slip wall boundary. This setting is to simulate
the suction floor effect which prevents formation of boundary layer. The remaining ground surface was treated by wall-model with the assumption of fully developed turbulent boundary layer. For the vehicle models’ surface, a
log-Figure 2. Vertex-centered control volume.
law distribution of instantaneous velocity was imposed. Finally, the ceiling and lateral boundaries of the domain were treated as free-slip wall boundary.
E. Periodic pitching oscillation setting
To probe the dynamic response of the models, we conducted dynamic simulation in which the models were forced to oscillate in a sinusoidal fashion about a lateral axis. Motion of the models is accomplished by Arbitrary Lagrangian-Eulerian (ALE) technique (Hirt et al, 1974). The rotational axis was fixed at the location corresponds to the front wheel axle of real vehicle. This is to consider the road test results of Okada et al (2009) in which the notchback type vehicles were experiencing more rear-ride height fluctuation than the front. Hence, the simplified vehicle models are set into pitching motion in a manner that simulating the rear-ride height fluctuation of real production vehicles during road test. The pitch angle θ is defined as θ = θ0 + θ1 sin(2πft). By setting θ0 and θ1 equal to 2, the vehicle models were forced to oscillate between 0° to 4°. To minimized numerical grid distortion, the initial grid is created with the vehicle models inclining
at 2° pitch. Then, ALE technique was employed to rotate the vehicle models at the maximum deviation of 2° in both positive and negative directions. The frequency f is 10 Hz, which is equivalent to Strouhal number St of 0.13. This value is chosen considering the road test St of 0.15 by Okade et al (2009). Phase-averaged results presented in this paper are averaged of 15 cycles after the LES computation achieved a stable periodic condition. Figure 4 shows the convention of aerodynamic pitching moment. Due to very high computing resources required in the LES that involve ALE algorithm,
high-performance computing technique presented by Tsubokura et al. (2009a) is employed. F. Validation
Validation of numerical method adopted in the present study is performed by comparing the LES results of stationary cases to wind tunnel measurements. The chosen model was model B in virtue that it has a more complicated flow structures than model A. Fig. 5 compares the experimental and LES results for distributions of time-averaged total pressure coefficient Cptot at a transverse plane 5 mm behind the model, which is defined as Cptot
= (½ ρU² + p)/(½ ρU²inlet), where ρ = fluid density, U = velocity, p = pressure, and Uinlet = inlet velocity. This plane is chosen for validation with the consideration that most of the predominant flow structures generated around the model are present here. In the figure, zone A and B are dropped of total pressure due to the side edge vortices shed from the front and rear pillars. Meanwhile, zone C and D are total pressure dropped due to the circulatory structure in the wakes behind the rear shield and rear end of the model. The ability of LES to capture the front and rear pillar vortices is very important because this structures play an important role in affecting the pitching
stability characteristics of the models, which will be discussed in the following sections. Qualitatively, the LES results are in very good agreement with the wind tunnel measurements.
Figure 4. Sign convention for aerodynamic pitching moment.
Figure 5. Distribution of Cptot 5 mm behind model B.
z
[image:4.612.72.538.429.707.2] [image:4.612.220.539.463.662.2]IV.
Results and Discussion
A. Transient aerodynamic effect on pitching stability
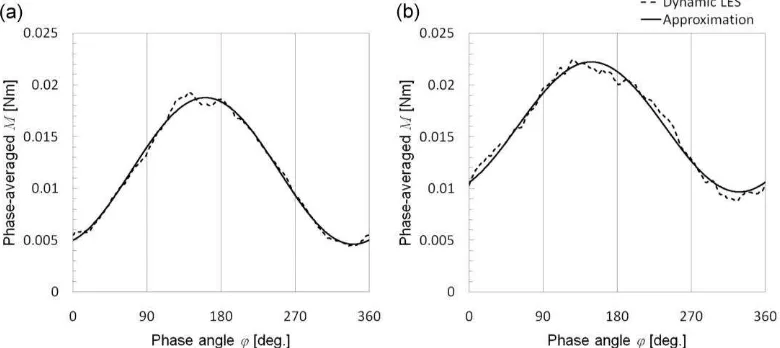
The phase-averaged aerodynamic pitching moment M acted upon the model A and B during periodic-pitching oscillation is as shown in Fig. 6. The quantity can be approximated by the non-linear function defined as M = M1 + M2 sinφ(t)+ M3 Cosφ(t) where, M1, M2, and M3 are numerical coefficients. The coefficients are determined by fitting the non-linear function to the M data sets by least mean squares regression.
During one cycle of oscillation, the work done W by M on the model is
2
0
1
t
d
dt
d
M
W
(8)Substituting M and θ into Eq.(8) and rearranging
2
0 2 1
3 2
0 1 2 2
0 1
1
cos
wtd
t
M
sin
wt
cos
wtd
t
M
cos
wtd
t
M
W
(9)Here, the first and second integrals equal to zero, while the third integral equals to π. Hence, only M3 reflects the dynamic response of the model.
Table 1 copares the M3 values of model A and B. As depicted, they are with negative sign, thus implies that the aerodynamic pitching moment is resisting (or damping) the pitching motion of both model A and model B. Between them however, model A has a higher aerodynamic damping, by about 22.3%. This trend agrees with our expectation because model A is created based on the notchback of higher pitching stability.
B. Transient characteristics of pillar vortices during pitching
Figure 7 shows the phase-averaged flow structures (rendered by ISO surface of second invariant of velocity gradient) around the two models at momentary pitch angle of 0°, 2° upward, 4°, and 2° downward. The ISO surface is thresholds at the stream wise location where distribution of surface pressure around the rear section of the models is plotted so that the corresponding flow structures can be clearly seen from the back.
In general, the surface pressure across the trunk deck has a higher value at the center and lower value at the sides. Between the two models however, the higher value region in model A is quite level and occupied about 67% of the trunk deck span. Near the sides, it drops sharply attributed to the strong, concentrated rear pillar vortices which located right above the side of the trunk deck. In the case of model B, the value decreases gradually from the center to the sides owing to the weaker and less concentrated rear pillar vortices (see Fig. 5).
In Fig. 7, when the pitch angle increases, the rear pillar vortices attenuate. As a result, the corresponding induced pressure at the side increases. This implies that when the tail of the model is moving upward, the pressure force acting upon the trunk deck surface increases, thus imparted a tendency to resist the vehicle motion. While this holds in model A, the situation is more complex in model B due to the existence of front pillar vortices.
Figure 6. Transient effect of pitching on vortices and induced pressure. (a) Model A (b) Model B
Table 1. M3 of model A and B.
Model M3
A
-0.00669
In model B, the surface pressure near the central region drops dramatically due to the strong cross flow generated at this instant. This occurrence is associated to strong interaction between the front and rear pillar vortices during the time they are brought closer to each other by the upward motion of the trunk deck. Figure 8 shows the phase-average vorticity magnitude and cross flow velocity vectors for flow above the trunk deck of model B at momentary pitch position of 0° and 4°. It is apparent that when the rear pillar vortices were elevated at 4° pitch, it shifted the front pillar vortices a little sideward, and deflected the path of the cross flow component that passes through them. This implies that when the induced pressure increases at the sides (by virtue of attenuated rear pillar vortices), it decreases at the center (due to the increased cross flow). Therefore, the vortex-induced effect depends on the net pressure gain or lost over the entire trunk deck surface. If the dropped of pressure at the central region is larger, which is the case in model B, a tendency to enhance the vehicle motion is implied during tail up motion.
V. Concluding Remarks
The present study investigated the stability characteristic of notchback-type vehicle under the influence of transient aerodynamics by large eddy simulation. Dynamic response of the vehicle models can be presented by the coefficient M3, which indicates the aerodynamic damping for the pitching oscillation of the models. For the simplified notchback models investigated in the present study, a configuration with rounder front pillar and sharp-edged rear pillar produces a higher M3 than the one with sharp-edge front pillar and rounder rear pillar.
Acknowledgments
This work was supported by the 2007 Industrial Technology Research Grant program from the New Energy and Industrial Technology Development Organization (NEDO) of Japan. Development of the base software FFR was
supported by the FSIS and “Revolutionary Simulation Software (RSS21)” projects sponsored by MEXT, Japan. The first author’s Ph.D. program is sponsored by Ministry of Higher Education and Universiti Teknikal Malaysia
Melaka, Malaysia.
References
Periodicals
1
Tsubokura, M., Nakashima, T., Kitoh, K., Sasaki, Y., Oshima, N. and Kobayashi, T., "Development of an Unsteady Aerodynamic Simulator Using Large-Eddy Simulation Based on High-Performance Computing Technique," SAE, Paper 2009-01-0007, 2009a.
2
Tsubokura, M., Kobayashi, T., Nakashima, T., Nouzawa, T., Nakamura, T., Zhang, H., Onishi, K., and Oshima, N., "Computational visualization of unsteady flow around vehicles using high performance computing," Computers & Fluids, No. 38, 2009b, pp. 981-990.
3Smagorinsky, J., "General circulation experiments with primitive equations," Monthly Weather Rex., Vol. 91, No. 3, 1963,
pp. 99-164.
4Hirt, C.W., Amsden, A.A. and Cook, J.L., "An Arbitrary Lagrangian-Eulerian Computing Method for All Flow Speeds,"
Journal of Computational Physics, Vol. 14, 1974, pp. 227-253. 5
Okada, Y., Nouzawa, T., Nakamura, T. and Okamoto, S., "Flow structure above the trunk deck of sedan-type vehicles and their influence on high-speed vehicle stability 1st report: On-Road and Wind-Tunnel Studies on Unsteady Flow Characteristics that Stabilize Vehicle Behavior", SAE, Paper 2009-01-0004, 2009.