Abstract—This research was aimed at determining the impact of conservation techniques including bench terrace, stone terrace, mulching, grass strip and intercropping on soil erosion at tobacco-based farming system at Progo Hulu subwatershed, Central Java, Indonesia. Research was conducted from September 2007 to September 2009, located at Progo Hulu subwatershed, Central Java, Indonesia. Research site divided into 27 land units, and experimental fields were grouped based on the soil type and slope, ie: 30%, 45% and 70%, with the following treatments: 1) ST0= stone terrace (control); 2) ST1= stone terrace + Setaria spacelata grass strip on a 5 cm height dike at terrace lips + tobacco stem mulch with dose of 50% (7 ton/ ha); 3) ST2= stone terrace + Setaria spacelata grass strip on a 5 cm height dike at terrace lips + tobacco stem mulch with dose of 100% (14 ton/ ha); 4) ST3= stone terrace + tobacco and red bean intercropping + tobacco stem mulch with dose of 50% (7 ton/ ha). 5) BT0= bench terrace (control); 6) BT1= bench terrace + Setaria spacelata grass strip at terrace lips + tobacco stem mulch with dose of 50% (7 ton/ ha); 7) BT2= bench terrace + Setaria spacelata grass strip at terrace lips + tobacco stem mulch with dose of 100% (14 ton/ ha); 8) BT3= bench terrace + tobacco and red bean intercropping + tobacco stem mulch with dose of 50% (7 ton/ ha). The results showed that the actual erosion rates of research site were higher than that of tolerance erosion with mean value 89.08 ton/ha/year and 33.40 ton/ha/year, respectively. These resulted in 69% of total research site (5,119.15 ha) highly degraded. Conservation technique of ST2 was the most effective in suppressing soil erosion, by 42.87%, following with BT2 as much 30.63%. Others suppressed erosion only less than 21%
Keywords—steep land, subwatershed, conservation、terrace, tolerance erosion
I. INTRODUCTION
AND degradation due to soil erosion from upstream areas of a watershed bring harmful onsite and offsite impacts. Onsite impacts including land productivity and farmers income declining, which transform a productive agriculture area into critical land at upstream area. With or without consideration to the upstream area, downstream regions always affected by the offsite impacts such as sedimentation, water pollution, drought
Jaka Suyana and Komariah are with the Sebelas Maret University, Jl. Ir. Sutami 36A, Surakarta, 57261 Indonesia (phone: +62-857-436-481-89 fax: +62-271-632477; e-mail: [email protected]).
Masateru Senge, is with Gifu University, 1-1 Yanagido, Gifu, 501-1193, Japan (e-mail: [email protected]).
and floods.
Incorrect land management would lead to soil erosion, hence loss its function as a production element, water regulator media and environment protector media. Erosion is closely related to water availability, especially for crop growth and production. Accordingly, erosion indirectly engenders agricultural production decreases [12]. The losses of agricultural production caused by erosion will eventually threaten the world food availability. In some places, loss of land due to erosion is a major cause of food crisis and malnutrition [22].
Soil Erosion Assessment
Soil erosion rate could be determined using the Universal Soil Loss Equation (USLE) method (Wischmeier and Smith, 1978), computed with (1):
A = R × K × LS × C × P (1) note; A: actual erosion in ton/ ha/ year
R: rain erosivity factor K: soil erodibilty factor LS: slope length factor C: crop management factor P: conservation factor
Rain erosivity factor (R) is the values of monthly rainfall erosion index (Bols, 1976 in Arsyad, 2000) and calculated with (2):
∑
==
121 I
i 30
)
(EI
R
Note; EI30: monthly rainfall erosion index EI30 is predicted using (3):
EI30 = 6,119 (Rain)1,21 (Days)-0,47 (Maxp)0,53 (3) note; Rain : monthly mean rainfall in centimeter, cm
Days : monthly mean rainy days
Maxp: maximum rainfall of 24 hours in the month in centimeter, cm
Conservation Techniques for Soil Erosion
Control in Tobacco-Based Farming System at
Steep Land Areas of Progo Hulu Subwatershed,
Central Java, Indonesia
Jaka Suyana, Komariah, and Masateru Senge
Soil erodibility factor (K) is influenced by soil texture, structure, soil type and permeability, calculated using (4):
100 ) 3 ( 5 . 2 ) 2 ( 25 . 3 10 ) 12 ( 7132 .
2 1.14 − 4+ − + −
= M a − b c
K
note; M: (silt and very fine sand in %) × (100 – clay in %) A: soil organic content in %
b: soil structure code c: soil permeability code
Soil structure and permeability scores to determine K are presented in Table 1.
TABLE I
SOIL STRUCTURE AND PERMEABILITY SCORES
Structure and Permeability Value Code
Structure Type
Very fine granular 1
Fine granular 2
Medium, coarse granular 3
Blocky, platty, massive Permebility (cm/ hour)
Rapid >25.4 1
Moderate to rapid 12.7 – 25.4 2
Moderate 6.3 – 12.7 3
Moderate to slow 2.0 – 6.3 4
Slow 0.5 – 2.0 5
Very slow <0.5 6
Source: Arsyad (2006)
Slope length factor (LS) is the erosion ratio of a land with specific slope length to erosion of 9% slope and 22 meter length land (Arsyad, 2000), which computed with (5):
)
00138
.
0
00965
.
0
0138
.
0
(
S
S
2X
LS
=
+
+
(5)note; X: length in meter, m S: slope in %
Crop management factor (C) is the ratio between erosion of area with specific crop and management to area under clean-tilled continuous-fallow condition. Conservation factor (P) is the ratio of soil loss with contouring and/or stripcropping to that with straight row farming up-and-down slope. The values of C and P of most crops and conservation practices in Indonesia are recommended by Abdurrachman [1] and Arsyad [2].
Tolerance Erosion (ETol)
Tolerance Erosion (ETol), also called as Soil Loss Tolerance defined as the amount of soil that could be lost without a decline in fertility, thereby maintaining crop productivity indefinitely (Schertz and Nearing, 2006).
Nowadays, ETol is most commonly defined as the maximum rate of annual soil erosion that may occur and still permit a high level of crop productivity to be obtained economically and indefinitely.
Threshold value of erosion rate that employed in Land Evaluation Computer System/ LECS, which considering minimum soil depth and resources life can be used as an approach to compute ETol [21]. The formula is (6):
SFR
LUP
D
D
ETol
=
E−
MIN+
(6) note; DE: equivalent depth (soil depth factor × effective
depth)
DMIN: minimum soil thickness in millimeter,mm LUP: land use period in years
SFR: soil formation rate in mm/year
Effective soil depth is the depth that inhibits root growth. The values for soil depth factor of some soil sub-order are listed in Hammer [7]. Equivalent soil depth is the depth where soil productivity decreased by 60% at post-erosion, compared to that of non-eroded soil. Minimum thickness is a depth that should be maintained so that a sufficient volume of soil for better root growth, nutrient and water storage to support crop productivity remains exist. Minimum thicknesses of several crops are presented in [21].
Soil formation rate in wet tropical regions such as Indonesia is estimated double than that of temperate regions, due to higher temperature and rainfall. According to [2], soil formation rate in Indonesia could reach more than 2 mm per year. This is agree to [8] who reported that soil with the thickness of 25 cm has formed after 100 years since volcanic eruption of Krakatau mountain in 1883 at Rakata island (new island that built after the eruption, also called as “Anak Krakatau” which means the child of Krakatau mountain). This means that soil formation rate is approximately 2.5 mm per year.
ETol is determined to inform whether the farming system sustainable or not. If predicted erosion < ETol thus the farming system is sustainable. In the opposite, if predicted erosion > ETol means that the employed farming system is not sustainable and will become critical land in certain period. For that, innovations and alternatives particularly in crop management (C) and conservation practice (P) factors are urgent. In other words, it can be written as (7) or (8).
ETol
A
≤
orR
×
K
×
LS
×
C
×
P
≤
ETol
(7)LS
K
R
ETol
P
C
×
×
≤
×
(8)computed that those units can be converted using formula (9) and (10):
Predicted erosion = ETol × Bulk Density (BD) ×10 (9)
10 BD
erosion Predicted
× =
ETol (10)
Land Degradation of Progo Hulu Watershed
The erosion rate of dry-land farming in Progo Hulu subwatershed was predicted as 47.51 ton/ha/year (Watershed Management Development Center Project, 1990), while the erosion rate of land with slope more than 62% was noted as 53.72 ton/ha/year (Djajadi et al., 1994). Based on the map of erosion hazard levels, most of the dry-land farms at Progo Hulu subwatershed were classified as farms with heavy to very heavy hazard levels (Gadjah Mada University and Sub-BRLKT Opak-Progo, in Djajadi, [5]). This is because most of the farms slope generally more than 30% with high rainfall rate (>2,000 mm/year). Moreover, the farms are primarily planted with tobacco during dry season, while maize and vegetables are dominantly planted during rainy season. Such lands should be designated as a regional hydrology protection, but due to the economy demands, people who live in the area since hereditary used for tobacco-based farming. The condition of tobacco-based farming system at Progo Hulu subwatershed is described in Fig. 1.
Fig. 1 Condition of tobacco-based farming system at Progo Hulu subwatershed, Central Java, Indonesia
According to GGWRM-EU (2004), Progo Hulu subwatershed now has approximately 3,029 ha critical and very critical land that spread over 12.9% of its total area, primarily used for dry-land farming with tobacco-based system. Continued erosion that still occurs in this area has lead to land degradation in the form of land damage and soil fertility declines [5]. Land damage characterized by the loss of top soil layer and the appearance of parent material, rill erosion, and gully erosion. In the meantime, soil fertility declines identified by the increasing of manure needs year by year. Rachman et al. [17] reported that initially the manure dose for tobacco in this area was only 22.5 ton/ha, whereas [5] informed that manure demand in the same area had reached 30-48 ton/ha.
Land degradation due to erosion in Progo Hulu subwatershed will continue to take place, unless some immediate actions of conservation techniques are taken. The retardation of anticipation actions of this problem will lead to
more complex problems with higher cost and longer time for rehabilitation. Based on this, this research was aimed at determining the impact of conservation techniques including bench terrace, stone terrace, mulching, grass strip and intercropping on soil erosion at tobacco-based farming system at Progo Hulu subwatershed, Central Java, Indonesia.
II.MATERIALS AND METHODS A.Time and Location
This research was conducted from September 2007 to September 2009, located at Progo Hulu subwatershed, Central Java, Indonesia (Fig. 1). Progo Hulu subwatershed covers approximately 30,046 ha of area.
Fig. 2 Location of research
Experimental plots were carried out in two different locations, namely Pagersari and Wonotirto village. Pagersari village represented the regions of litosol soil type with rock fraction mainly covered the surface. On the other hand, Wonotirto village represented areas with slightly rock fraction at surface and dominated by yellowish-brown latosol soil type. The erosion observations were carried out during tobacco planting period, which was from April to September 2009.
B.Experimental Design
Fig. 3 Experiment plots in Pagersari village with stone terraces at slopes of 30% (left), 45% (center) and 75% (right)
Fig. 4 Experiment plots in Wonotirto village with bench terraces at slopes of <30% (left), 30% (center) and >30% (right)
1) ST0= stone terrace (control); 2) ST1= stone terrace + Setaria spacelata grass strip on a 5 cm height dike at terrace lips + tobacco stem mulch with dose of 50% (7 ton/ ha); 3) ST2= stone terrace + Setaria spacelata grass strip on a 5 cm height dike at terrace lips + tobacco stem mulch with dose of 100% (14 ton/ ha); 4) ST3= stone terrace + tobacco and red bean intercropping + tobacco stem mulch with dose of 50% (7 ton/ ha). Similar to that of Pagersari village, experiment plots in Wonotirto village were also grouped based on the slope, resulting the following treatments: 1) BT0= bench terrace (control); 2) BT1= bench terrace + Setaria spacelata grass strip at terrace lips + tobacco stem mulch with dose of 50% (7 ton/ ha); 3) BT2= bench terrace + Setaria spacelata grass strip at terrace lips + tobacco stem mulch with dose of 100% (14 ton/ ha); 4) BT3= bench terrace + tobacco and red bean intercropping + tobacco stem mulch with dose of 50% (7 ton/ ha). Experiments plots are presented in Fig. 3 – 4.
C.Determination Methods
Soil erosion was determined by measuring surface runoff and eroded soil from some experiment plots. Erosion rates were predicted using the USLE method refers to (1), and soil loss tolerance (ETol) was computed using (6). Erosion and surface runoff were measured during rainy days. Climate data were obtained from rain collectors that were installed in each of experiment fields in Pagersari and Wonotirto villages, owned by the Dept. of Irrigation. Soil physical characteristics, namely texture, structure, permeability, bulk density, stone appearance and soil drainage were analyzed and determined using the standard soil analysis method [20]. Topographic map series scale 1:25,000, soil map scale 1:50,000 and geologic map scale 1:100,000 were collected from Dept. of National Soil Survey,
BPDAS Serayu- Opak-Progo and Geology Research and Development Center, repectively.
Fertilization dose, either manure or chemical fertilizer (Nitrogen, Phosphor and Potassium) was according to the dose of local farmer. Similarly, planting space of 60 cm × 40 cm and crop variety of Kemloko cultivar were as to the local farmer’s custom. Statistic methods of F-test followed with HSD test of 5% probability level were occupied to determine the correlation between treatment effects.
The method to assess land degradation employed method proposed by Irawan, et al. [9] and Puslittanak [16] with slight modifications. According to the method, observations including natural factor and nature-human interaction factor. Natural factor namely parent material, rainfall, topographic and soil depth. While vegetation type, land cover and conservation practice are included in nature-human interaction factor. The assessment of degradation level was divided into two stages. 1) First stage by natural assessment; and 2) Second stage by antrophological assessment. Total scores then employed to determine the land degradation level, i.e.: <20 (severe), 20-25 (moderate); and >25 (light). Detail scoring for each parameter referred to Irawan, et al. (2002) and Puslittanak (2002).
III. RESULTS AND DISCUSSION A. Research Site Characteristics
brown regosol, reddish brown regosol, andosol, yellowish brown latosol and brown latosol. Research site divided into 27 land units, which obtained by overlaying soil maps, geological maps and land cover maps.
Fig. 5. Land use map of research site
C. Actual Erosion (A), Tolerance Erosion (Etol) and Land Degradation
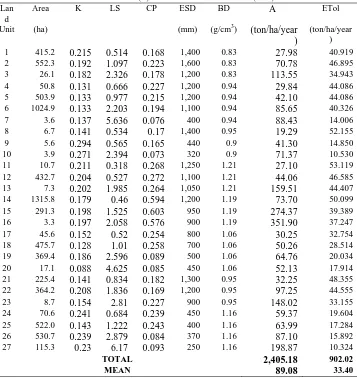
ETol of tobacco-based farming system at Progo Hulu sub-watershed varied from 10.32 tons / ha / year (Land unit 27) to 53.11 tons / ha / year (Land unit 11), as presented in Table 4. ETol differences in each land unit were caused by the different effective soil depth, soil depth factor, weight, volume of soil, minimum rooting depth and rate of soil formation. Effective soil depth ranged 250-1600 mm with the depth factor ranged from 0.90 to1.00, and soil bulk density ranges from 0.83-1.21. Based on the field observation, minimum rooting depth for tobacco is similar in all land unit that is 24 cm .
According to Hardjowigeno (2003), the time required for soil formation from rock parent material much longer than that derived from soft and loose parent material. Parent material of study site is basaltic andesites (augite-olivine andesite, olivine-augite-andesite, basalt-olivit-augin, and hypersthene-augite-andesite), which is categorized as "resistant" (Van Panhuys and Buurman, 1990 in Irawan et al., 2002).
TABLE II ACTUAL EROSION (A) AND TOLERANCE EROSION (ETol) CALCULATION Lan
d
Area K LS CP ESD BD A ETol
Unit (ha) (mm) (g/cm3) (ton/ha/year
)
(ton/ha/year )
1 415.2 0.215 0.514 0.168 1,400 0.83 27.98 40.919
2 552.3 0.192 1.097 0.223 1,600 0.83 70.78 46.895
3 26.1 0.182 2.326 0.178 1,200 0.83 113.55 34.943
4 50.8 0.131 0.666 0.227 1,200 0.94 29.84 44.086
5 503.9 0.133 0.977 0.215 1,200 0.94 42.10 44.086
6 1024.9 0.133 2.203 0.194 1,100 0.94 85.65 40.326
7 3.6 0.137 5.636 0.076 400 0.94 88.43 14.006
8 6.7 0.141 0.534 0.17 1,400 0.95 19.29 52.155
9 5.6 0.294 0.565 0.165 440 0.9 41.30 14.850
10 3.9 0.271 2.394 0.073 320 0.9 71.37 10.530
11 10.7 0.211 0.318 0.268 1,250 1.21 27.10 53.119
12 432.7 0.204 0.527 0.272 1,100 1.21 44.06 46.585
13 7.3 0.202 1.985 0.264 1,050 1.21 159.51 44.407
14 1315.8 0.179 0.46 0.594 1,200 1.19 73.70 50.099
15 291.3 0.198 1.525 0.603 950 1.19 274.37 39.389
16 3.3 0.197 2.058 0.576 900 1.19 351.90 37.247
17 45.6 0.152 0.52 0.254 800 1.06 30.25 32.754
18 475.7 0.128 1.01 0.258 700 1.06 50.26 28.514
19 369.4 0.186 2.596 0.089 500 1.06 64.76 20.034
20 17.1 0.088 4.625 0.085 450 1.06 52.13 17.914
21 225.4 0.141 0.834 0.182 1,300 0.95 32.25 48.355
22 364.2 0.208 1.836 0.169 1,200 0.95 97.25 44.555
23 8.7 0.154 2.81 0.227 900 0.95 148.02 33.155
24 70.6 0.241 0.684 0.239 450 1.16 59.37 19.604
25 522.0 0.143 1.222 0.243 400 1.16 63.99 17.284 26 530.7 0.239 2.879 0.084 370 1.16 87.10 15.892
27 115.3 0.23 6.17 0.093 250 1.16 198.87 10.324
TOTAL 2,405.18 902.02
MEAN 89.08 33.40
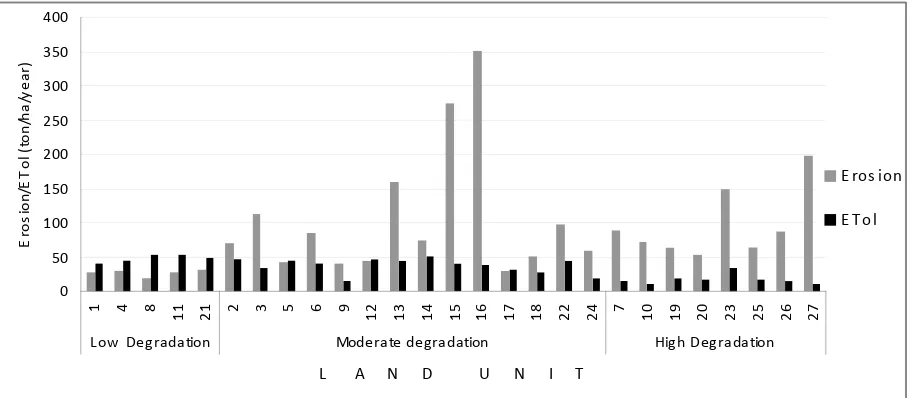
0 50 100 150 200 250 300 350 400
1 4 8 11 21 2 3 5 6 9 12 13 14 15 16 17 18 22 24 7 10 91 20 23 25 26 27
L ow Deg radation Moderate deg radation Hig h Deg radation
L A N D U N I T
E
ro
s
io
n
/E
T
o
l
(t
o
n
/h
a/
y
e
ar
)
E ros ion
E T ol
Fig. 6 Erosion and tolerance erosion (Etol) grouping by land degradation level
Considering the basaltic andesites parent material, soil thickness class is shallow to deep (25-160 cm), permeability class is slow-fast, texture of smooth to rough, and unconsolidated substratum, then soil formation rate is estimated as 0.85 mm / year.
Table 2 showed that the actual erosion rates of research site were higher than that of tolerance erosion with total of 2,405.18 ton/ha/year and 902.02 ton/ha/year, respectively. Meanwhile, the mean values were 89.08 ton/ha/year and 33.40 ton/ha/year, respectively for actual and Etol.
Fig 6 shows that not all of erosion that occurs in all land units exceeded the rate of tolerance erosion. Erosion rates were less than Etol at all land units with low degradation level (LU 1, 4, 8, 11, and 21). The erosion rates of some land units with moderate land degradation level were less than Etol (LU 5.12, and 17), but higher than Etol at most of land units (LU 2, 3, 6, 9, 13, 14, 15, 16, 18, 22, and 24). But, erosion rate is higher than Etol at all land units with high degradation level (LU 7, 10, 19 , 20, 23, 25, 26, and 27). These means that the tobacco-based farming system in Progo Hulu subwatershed promoted high soil erosion and thus does not sustainable for agriculture management.
.
5 1 1 9 .1 5 6 9 %
7 0 8 .7 1 1 0 % 1 5 7 0 .6 8
2 1 %
L o w ;L an d U n it:1 ,4 ,8 ,1 1 ,2 1
M o de rate ,L an d U n it:2 ,3 ,5 ,6 ,9 ,1 2 ,1 3 ,1 4 ,1 5 ,1 6 ,1 7 ,1 8 ,2 2 ,2 4
H igh ;L an d U n it:7 ,1 0 ,1 9 ,2 0 ,2 3 ,2 5 ,2 6 ,2 7
Fig. 7 Land degradation level and distribution
The high erosion rates resulted in high land degradation assessment in the research site, which were grouped into low (708.71 ha; 9.58%), moderate (5,119.15 ha; 69.19%) and high (1,570.68 ha; 21,23%), as presented in Fig. 7.
C. Precipitation in Experimental Plots
Daily rainfall data obtained from two rain collectors from April to September, 2009 is presented in Table3. Total rainfall in Pagersari village, where stone terrace plots located, was 600 mm with 30 rain days. Meanwhile, total rainfall was 645 mm with 26 raindays in Wonotirto village, where the bench terrace plots arranged. Rain erosivity (R) for erosion calculation is 1506.89.
TABLE II RAINFALL AND RAIN DAYS AT EXPERIMENTAL PLOTS APRIL-JULY, 2009
Month
Stone terrace treat. Bench terace treat. rain days rainfall rain days Rainfall
(days) (mm) (days) (mm)
April 9 207 9 207
May 17 320 13 339
June 4 73 4 99
July 0 0 0 0
August 0 0 0 0
Sept. 0 0 0 0
TOTAL 30 600 26 645
D. Erosion in Experimental Plots
The influences of treatment on erosion, during tobacco planting period (April-September, 2009) are listed in Table 4. Table 4 shows that the highest erosion rate occurred in ST0, which was 22.32/ha, followed by ST3 (19.51 ton/ha), ST1 (18.15 ton/ha) and ST2 (12.75 ton/ha). Compared to control (ST0), there were erosion decreases as much 42.87% in ST2, 18.68% in ST1 and 12.58% in ST3.
Treatment Rainfall (mm)
Erosion (m3/ha)
Total (m3/ha)
Mean
E.D. (%) slope
(m3/ha) (mm)* 30% 45% 70%
Stone Terrace
ST0 600 31.02 26.84 9.11 66.97 22.32 1.86
ST1 600 25.20 21.27 7.98 54.45 18.15 1.51 18.68
ST2 600 18.79 13.95 5.51 38.25 12.75 1.06 42.87
ST3 600 26.66 24.57 7.32 58.55 19.51 1.62 12.58
Mean 25.41 21.65 7.48 18.18 1.51
Bench Terrace
BT0 645 61.02 66.04 68.62 195.68 65.22 5.43
BT1 645 48.40 54.82 62.25 165.47 55.15 4.59 15.44
BT2 645 41.81 47.69 46.23 135.73 45.24 3.77 30.63
BT3 645 46.42 54.57 55.21 156.20 52.06 4.33 20.17
Mean 49.41 55.78 58.07 54.41 4.53
Note: * = bulk density 1.2 gram/cm3; E.D.= erosion decrease compared to control at each terrace treatment These mean ST2 was the most effective treatment to control
erosion compared to other stone terrace treatments, while ST1 was more effective than that of ST3.
In the meantime, table 4 also shows that in bench terrace main treatment, the highest erosion rate occurred in BT0, at the rate of 65.22 ton/ha. Lower rate occurred in BT1 (55.15 ton/ha), BT3 (52.06 ton/ha) and BT2 (45.24 ton/ha), successively. Compared to control (BT0), there were erosion rate decreases as much as 30.63% in BT2, 20.17% in BT3 and 15.44% in BT1. These mean BT2 was the most effective treatment in control soil erosion, while BT3 is more effective compared to that of BT1.
The stone assisted on strengthen soil structure thus erosion rates of bench terrace treatments were clearly higher than that of stone terrace. Beside that, soil physical characteristics of each region also influenced the erosion rate, in other words whether the soil is easily eroded or not. Area where stone terrace plots were taken has the litosol soil type (soil depth of 0.90-1.60 m) with sandy clay texture (73.98% sand, 7.92 silt and 18.10% clay). Meanwhile the physical characteristics of soil in the bench terrace plots were yellowish-brown latosol type (soil depth of 0.90-1.6 m), with clay texture (29.39% sand, 40.90% silt and 29.71% clay). Soil tillage during land preparation for tobacco planting is very intensive, soil is ploughed and turned until the depth of 30-50 cm, hence crushed soil aggregates (soil is non-stabile, aggregate index<40). In bench terrace experiment plots, yellowish-brown latosol soil type is dominated by light fraction (silt), therefore very easily dissolved and carried by surface runoff. So, the physical characteristic of soil in the bench terrace plots was easily eroded.
Compared to control treatments of stone terrace and bench terrace, namely ST0 and BT0, the conservation technique with Setaria spacelata grass strip and tobacco stem mulch 14 ton/ ha (ST2 and BT2) was highly effective in suppress erosion. That is due to crop residues of tobacco stem could block the rain drop on the ground so that prevent soil particle dispersion
and transport by surface runoff. Moreover, the scattered mulch over the ground could slow down surface runoff, thus increase infiltration capacity and reduce the destruction energy by rain drop. Many researches on mulches reported that mulching could reduce surface runoff and erosion, prevent water loss through evaporation, reduce soil dispersion, stimulate soil aggregation, improving soil structure, maintain water holding capacity, inhibits weed growth, and minimize soil temperature fluctuations (Kohnke and Bertrand, 1959; Lal, 1976; Suwardjo, 1981). Beside that, in the long term, the role of mulch will be similar to that of forest litter layer, thus effectively reducing the surface runoff hence resulting very low level of erosion, increase the soil organic C, total N and can the activity of microorganisms in the soil.
The effectiveness of crop residues mulch in suppressing surface runoff is determined by the amount and durability of the material decomposition process (Sinukaban et al., 2007). According to Arsyad (2006), the benefit of mulch is also determined by the percentage of soil cover by mulch material. At straw mulch with density of greater than 60% can reduce the erosion of at least 54%, while straw mulch with the density of only 30% can reduce erosion only 37% (Sinukaban et al., 2007). Beside the material characteristics, mulching effectiveness is is also influenced by the number, shape, and size. Suwardjo (1981) argues crop residues for mulch should be the material with moderate decomposition rate, such as rice straw, weeds, stems of maize and sorghum. This research observed in the field that the decomposition process of tobacco stem mulch was not too fast, even it has not been decomposed after more than one growing season.
reduce runoff and erosion. The grass is effective in suppressing surface runoff and erosion after 2,5-3 months from planting.
The application of red bean intercropping was because red bean is the local legume crops that have been well adapted to local climate and environmental conditions and it is able to grow well in the dry season (April-September). The plant height is 40-50 cm, 60-70 days old plants, and planting period April-May (early dry season). Besides that, local community likes red bean for vegetable (as a mixture of vegetable soup, vegetable chili, also substitute green beans Kumbu materials), and also have excellent prospect for export commodity.
IV. CONCLUSION
Tobacco-based farming system at Progo Hulu subwatershed engenders severe land degradation due to higher erosion rate than that of tolerance erosion rate in most of land units observed. Conservation techniques of combinating terraces, especially stone terrace with crop residues of tobacco stem mulching and Setaria spacelata grass strip at terrace lips clearly suppressed erosion rate.
ACKNOWLEDGMENT
Authors thank to the Higher Education General of Republic of Indonesia, Dean of Post-Graduate Program of Bogor Education Institute (IPB), Dean of Agriculture Faculty of Sebelas Maret University, Prof. Naik Sinukaban, Prof. Bunasor Sanim, and Dr. Yanuar Jarwadi P.
REFERENCES
[1] Abdurrachman, A., S.Abuyamin, dan U. Kurnia. ”Soil and Crop management for Conservation” (in Indonesian). Pemberitaan Tanah dan Pupuk. Pusat Penelitian Tanah. Bogor. 1984.
[2] Arsyad, S. ”Soil and Water Conservation” (in Indonesian). Institut Pertanian Bogor. Bogor. 1989.
[3] Arsyad, S. ”Soil and Water Conservation: Revised” (in Indoensian) Institut Pertanian Bogor. Bogor. 2000.
[4] Dariah, Ai. “Erosion level and soil quality on Cofee-based farming system in Sumberjaya, Lampung Barat District” (in Indonesian). Dissertation. Sekolah Pascasarjana, IPB. Bogor. 2004.
[5] Djajadi. “Erosion and Conservation of tobacco land in Temanggung District” (in Indonesian). 2000. (unpublished)
[6] Good Governance in Water Resource Managemet (GGWRM)-European Union (EU). 2004. ”Direction of Land Rehabilitation and Soil Conservation of Temanggung District” (in Indonesian). Pemkab. Temanggung coorporated with GGWRM-EU.Juni 2004.
[7] Hammer, W.I., 1981. Soil Conservation Consultancy Report. Technical Note No.7, Centre for Soil Research, Bogor, Indonesia.
[8] Hardjowigeno, S. 1987. Soil Science (Book, in Indonesian). Medyatama Sarana Perkasa. Jakarta. pp. 110-114.
[9] Irawan, Kusnadi, H., Djunaedi, M.S., Kusnadi, K., dan U, Kurnia. “Determining of Degraded Land” (Proceeding in Indonesian). Puslittanak, Balitbangtan, Dept. of Agriculture. 2002.
[10] Kohnke, H and A.R. Bertrand. Soil Conservation. Mc. Graw Hill Book Company. New York. 1959.
[11] Lal, R. Soil Erosion Problems on an Alfisol in Western Nigeria and Their Control. IITA Monograph No. 1. Ibadan. 1976.
[12] Pimentel, D., C. Harvey, P. Resosudarmo, K. Sinclair, D. Kurz, M. McNair, S. Crist, L. Shpritz, L. Fitton, R. Saffouri, and R. Blair. Land Use, Erosion, and Water Resources. College of Agriculture and Life Science, Cornell University, Ithaca, New York. 1995.
[13] Project of Watershed Management Project. ”Report on Conservation Technique of Opak subwatershed Temanggung District” (in
Indonesian) Proyek Pusat Pengembangan Pengelolaan DAS. Surakarta. 1990.
[14] Project of Watershed Technology Development. ”Result of Technical Study on Tobao farming in Progo Hulu subwatershed” (in Indonesian) BTPDAS, Surakarta. 1994.
[15] Puslittanak.”Manual of Land Evaluation” (in Indonesian). Agricultural Dept., Balitbangtan, Departemen Pertanian. 1993.
[16] Puslittanak. ”Annual Report of Soil and Agroclimate research of 2001” (in Indonesian). Puslittanak, Balitbangtan, Deptan. Bogor. 2002. [17] Rachman, A., Djajadi, dan A., Sastrosupadi. ”The influence of manure
and nitrogen fertilizer on tobacco production and quality” (in Indonesian). Balittas. Malang. Vol 3 (1): 15-21. 1988.
[18] Sinukaban, N. ”Building agriculture become sustainable industry with conservation farming” (in Indonesian). Direktorat Jenderal RLPS, Departemen Kehutanan. Jakarta. 2007.
[19] Suwardjo. ”The role of Crop residues in soil and water conservation” (in Indonesian). Dissertation. Fakultas Pascasarjana IPB. Bogor. 1981. [20] Tan, Kim. H. Soil Sampling, Preparation and Analysis. Marcel Dekker,
Inc. New York. 1996.
[21] Wood, S.R. & Dent, F.J. LECS. A land evaluation computer system methodology. Bogor, Indonesia, Centre for Soil Research, Ministry of Agriculture/UNDP/FAO. 221 pp. 1983.