July 2009
Variability analysis of Sukun durian plant (
Durio zibethinus
) based on
RAPD marker
ISMI PUJI RUWAIDA1, SUPRIYADI², PARJANTO²,♥
1Agronomy Program, School of Graduates. Sebelas Maret University. Surakarta57126, Central Java, Indonesia. 2Faculty of Agriculture, Sebelas Maret University, Surakarta 57126, Central Java, Indonesia. ♥email: [email protected]
Manuscript received: 29 November 2008. Revision accepted: 24 February 2009.
Abstract. Ruwaida IP, Supriyadi, Parjanto. 2009. Variability analysis of Sukun durian plant (Durio zibethinus) based on RAPD
marker. Nusantara Bioscience 1: 84-91.The purpose of the study is to assess the diversity of the durian varieties of Sukun, Sunan, Kani,
Monthong, and Petruk; and Sukun durian variety grown in different regions based on RAPD markers. Materials research is durian leaves of Sukun, Sunan, Kani, Monthong and Petruk from Ranukutri Garden Seeds, Karanganyar, and also Sukun durian leaf from Gempolan Karanganyar, Jepara and Salatiga. Then performed DNA analysis on samples of leaves that began the isolation of DNA, test of DNA quantity and quality, primer selection, and amplification with PCR. Visualization of PCR performed by electrophoresis using EtBr that generate DNA bands. DNA bands were then analyzed with NTSYS program to get durian diversity among varieties of durian and between Sukun durian at different planting areas. Six RAPD polymorphic primer was used, namely 01, 02, 07, OPA-16, OPA-18, and OPA-19. Banding pattern of DNA amplification show the existence of diversity among varieties of Sukun durian, Sunan, Kani, Monthong and Petruk and show the diversity of Sukun durian grown in different areas. Dendrogram indicated that five durian varieties tend to segregate, whereas Sukun, Sunan, Monthong and Petruk in one group, which split with Kani. Dendrogram also indicated that Sukun planted in different regions resulted in two groups, Sukun from Gempolan Karanganyar and Salatiga in one group, while the second group consisted of Sukun from Ranukutri seed garden Karanganyar and Jepara.
Key words: variation, DNA, Durio zibethinus, RAPD.
Abstrak. Ruwaida IP, Supriyadi, Parjanto. 2009. Analisis keragaman tanaman Sukun durian (Durio zibethinus) berdasarkan penanda
RAPD. Nusantara Bioscience 1: 84-91. Tujuan penelitian adalah mengkaji keragaman durian varietas sukun durian, sunan, kani,
monthong, dan petruk serta keragaman durian sukun yang ditanam pada wilayah yang berbeda berdasarkan penanda RAPD. Bahan penelitian berupa daun tanaman durian varietas Sukun, Sunan, Kani, Monthong dan Petruk dari Kebun Benih Ranukutri Karanganyar; serta durian varietas Sukun dari Gempolan Karanganyar, Jepara dan Salatiga. Selanjutnya dilakakukan analisis DNA terhadap sampel daun yang diawali dengan isolasi DNA, uji kuantitas dan kualitas DNA, seleksi primer, dan amplifikasi dengan PCR. Visualisasi hasil PCR dilakukan dengan elektroforesis menggunakan EtBr yang menghasilkan pita DNA. Pita DNA selanjutnya dianalisis dengan program NTSYS untuk mendapatkan keragaman durian antar varietas dan antar durian sukun dari wilayah yang berbeda. Primer yang digunakan adalah 6 primer polimorfik, yaitu OPA-01, OPA-02, OPA-07, OPA-16, OPA-18 dan OPA-19. Pola pita DNA hasil amplifikasi menunjukkan adanya keragaman antar varietas durian Sukun, Sunan, Kani, Monthong dan Petruk serta menunjukkan keragaman durian sukun yang ditanam di wilayah yang berbeda. Dendrogram pengelompokkan menunjukkan lima varietas durian cenderung memisah, yaitu Sukun, Sunan, Monthong dan Petruk merupakan satu kelompok yang memisah dengan durian Kani. Dendrogram pengelompokkan durian Sukun yang ditanam pada wilayah berbeda menghasilkan dua kelompok, yaitu kelompok durian Sukun dari Gempolan Karanganyar dan Salatiga serta kelompok lainnya dari Kebun Benih Ranukutri Karanganyar dan Jepara.
Kata kunci: analisis keragaman, DNA, Durio zibethinus, RAPD.
INTRODUCTION
Durian (Durio zibenthinus Murr.) is a tropical fruit from
Southeast Asia. The name is taken from the typical fruit leather that is hard and sharp as to resemble thorns. Durian was first discovered by Murray in the jungle of Malaya or Malaysia and by Wallace who referred the fruit as the "King of the Fruit". The spread of durian extends to various countries such as Indonesia, Thailand, Myanmar, India and Pakistan. In Indonesia, the durian is an important export commodity because the demand has increased from year to year (Nafsi 2007).
Local durian is favored by domestic consumers because it tastes sweet, slightly bitter, aromatic moderate to strong, attractive yellow color, thick meat and with high fruit productivity. Meanwhile, overseas consumers prefer durians that do not smell, taste sweet, slightly bitter, thick fruit meat and yellow fruit meat (Baswarsiati et al. 2007). Test (2005) found that in Indonesia there are 20 types of durian are 18 types of which are in Kalimantan. Most of the
cultivated durian comes from the species of Durio
zibethinus (Sarwono 1995a, b; Sumarsono et al. 2002).
the Ministry of Agriculture and distributed to the community to be developed. They are Sukun durian (Central Java), Petruk (Central Java), sitokong (Betawi), sijapang (Betawi), Simas (Bogor) , Sunan (Jepara), Monthong (Thailand), Kani (Thailand), si dodol and si hijau (South Kalimantan). Indonesia has more than 103 varieties of durian and each is morphologically different in its characteristics (Nafsi 2007), such as its leaf and fruit shape, flavor and aroma of fruit, and seed shape.
Several studies have been done in durian, including research identification and genetic diversity of durian mother plant in Central Java based on morphological and isozyme markers (Sriyono 2006) which indicates that there are variability based on the morphological characters. The diversity of durian will continue to increase because of the nature of cross-pollinated plant durian (Ashari 1995). Other research is the identification of morphological Sukun durian (Yuniastuti 2008). To use morphological characters is easy and fast, but there are constraints, namely the environmental factors that may affect the character of the phenotype, differences in plant age and plant tissues (Nandariyah 2007).
Alternative to assess the diversity of durian is to use molecular markers (proteins, isozymes, and DNA). Durian genetic diversity can be analyzed using several markers, including RAPD (Random Amplified Polymorphic DNA), RFLP (Restriction Fragment Length Polymorphism), AFLP (Amplified Fragment Length Polimorphisms), SSR or micro satellite that has been done by Nafsi (2007). Compared to some of these molecular markers, RAPD advantages can be said as easy, quick and only requires very little DNA as template, and without the need for early information on the target genome (Martasari and Sugiyatno 2007). Rowland and Levi (1994) in Maftuchah and Zainudin (2007) states that RAPD markers suitable for species of woody plants, so it can be used for the analysis of DNA diversity of Sukun durian.
The purpose of this study are: (i) Assessing the diversity of several varieties of durian, namely Sukun, Sunan, Kani, and Petruk Monthong based on RAPD markers. (ii) studying the diversity of Sukun durian varieties grown in different regions based on RAPD markers.
MATERIALS AND METHODS Place and time
Research conducted at the Laboratory of the Research Institute for Biotechnology and Forest Tree Improvement, Yogyakarta in November 2008 to January 2009.
Plant material
The research material for diversity among durian varieties is the leaves of Sukun, Petruk, Sunan, Kani and Monthong from the Ranukutri seed garden, Karanganyar District, Central Java. Materials research for diversity among Sukun durian populations in different regions is leaves of Sukun durian from (i) Gempolan Village, Kerjo, Karanganyar, (ii) Seed garden Ranukutri, Pendem, Karanganyar, (iii) Tahunan Village, Jepara, and (iv)
Brongkol Village, Banyubiru, Salatiga.
Research experiment
The experiment consisted of several activities, namely sampling, DNA isolation, including DNA extraction and purification, test of the quality and quantity of DNA, primer selection and amplification reactions and electrophoresis.
Sampling
Samples were taken from leaves of Sukun, Sunan, Kani, Monthong, and Petruk durian that are old. Samples were taken at random by taking a leaf which is still good in texture and color.
DNA extraction
Durian DNA was extracted from the old leaves by using
the method of CTAB (Hexadecyl Trimetgyl ammonium
bromide). Prior to extraction, extraction buffer prepared
beforehand, that their needs depending on the number of samples that would be extracted. Samples will be extracted and weighed (50-100 g), it was then cut into small pieces, put in 2 mL microtube with 2 pieces of buckshot, and 1.5 mL of extraction buffer therein. Samples were crushed with a mini bead beater for 10 minutes and incubated for 10 minutes at a temperature of 650C. Subsequently, the sample is separated from the solution below (taken in 1000 mL, was added to a new microtube size 2 mL), and added 800 mL of chloroform isoamyl, which functions to separate contaminants such as proteins with DNA. And then it was rotated for 20 minutes, centrifuged at 15 000 rpm, then taken as much as 700 mL, added with 700 mL of chloroform. It was then rotated for 20 minutes and centrifused at 15 000 rpm. 600 mL of the solution was taken, transferred in 1.5 mL microtube containing NaOAc with as much as 20 mL. And then it was added with 650 mL of isopropanol as a binder of DNA. It was centrifuged again for 10 min at 15,000 rpm, and dried by aspirator, in order to obtain the DNA pellet. Furthermore, the DNA pellet was washed with 1 mL EtOH (ethanol) 70% and 100%. Finally, DNA pellets dried by aspirator, was
dissolved in 200 mL H2O and storage conducted at a
temperature of -4oC.
DNA purification
DNA extraction does not produce pure DNA (crude DNA), therefore it is necessary to conduct DNA purification which aims to separate the DNA from other contaminants such as RNA. The method used here is the Gene Clean Kit III, with a step of mixing 50 mL of DNA solution with 150 mL of NAI, then centrifuging it briefly at 10,000 rpm, and adding 5 mL of silica as a binder of DNA. The supernathan of DNA solution was centrifuged, and then discarded pellets were washed with 375 mL of New Wash solution 3 times. DNA was centrifuged washing 3 times each of which was at speed of 13 000 rpm, 14,000 rpm, and 15,000 rpm. The next step, the DNA pellet dried
in desiccators for 10 minutes, then diluted with 65 mL H2O.
Test of the quality and quantity of DNA
Quant; 7 mL of DNA sample was taken and carried out for measurement of concentration, ratio, and absorbance (230 nm, 260 nm, 280 nm and 320 nm), then the DNA was diluted with H2O as needed. Gene Quant working principle is to calculate the ratio and concentration of DNA by using optical density (OD) of DNA on the absorption of several kinds of waves of light (230 nm, 260 nm, 280 nm and 320
nm). Sambrook et al. (1989), also states that the quantity of
DNA determined by UV spectrophotometer at a wavelength of 260-280 nm. DNA purity is determined by A260/A280 ratio of about 1.8 to 2.0. Wavelength 260 nm is the wavelength that can be absorbed maximally by DNA, whereas the wavelength of 280 nm is the wavelength of maximum absorbed by the RNA.
Primer selection
Primer selections from the Operon Technology (Almaeda, USA) was conducted to obtain primers that can produce amplification products and have a high polymorphism. Some primers that will be selected are: OPA-01, OPA-02, OPA-07, OPA-16, OPA-18, OPA-19, OPG-05, OPG-06, OPG-07, and OPG-08, OPH -05, OPH-06, OPH-07, OPH-08, OPR-05, OPR-OPH-06, OPR-07 and OPR-08. Selection of primers using 4 samples of DNA (DNA durian varieties of Gempolan Karanganyar Sukun, Sukun seeds from the garden Ranukutri, Sunan and Kani).
Reaction of amplification and electrophoresis
Preparation of PCR for amplification was performed in a tub of ice. Materials that were used included 4 mL of DNA sample (concentration of 2.5 ng / mL), 4.2 mL of oligonucleotide primers, and master mix consisting of H2O, 10xStoffel Buffer, dNTPs, MgCl2. Taq polymerase enzyme were put in the 0.5 mL microtube size, divortex and centrifuged, then inserted in the PCR instrument Applied Biosystem GeneAmp PCR System 9700. PCR reaction was performed by 45 cycles consisting of 3 phases, namely (i) denaturation for 30 seconds at a
temperature of 94oC, (ii) annealing for 30 seconds at 37oC,
and (iii) extension for 1.5 minutes at 72oC. This
amplification reaction takes ± 3 ½ hours.
The next step after completing the amplification is that reaction mix was amplified with 2 mL gel loading and
electrophoresed with 1% agarose (76 g H2O, 1 g agarose
(Promega), and 4 mL 20xTBE) at constant voltage of 120 volts for 2 hours. Gel was then soaked in ethidium bromide solution for 30 minutes. The results that were visualized on BioRad electrophoresis was then performed shooting. According to Sambrook et al. (1989) that with agarose gel electrophoresis is one of the means used to separate, purify, and identify DNA. Electrophoresis process is used to separate DNA molecules through the pores of the gel due to the influence of an electric field that is given.
According to Williams et al. (1990) that used the
Thermolyne Amplitron®-1 versi 2.11, PCR reaction
carried out by 45 cycles consisting of one minute at a
temperature of 94oC (denaturation), one minute 55oC
temperature (annealing), and two minutes at temperature of
72oC (extension). Furthermore, after the end of the PCR
reaction, amplification products was electrophoresed with
1.2% agarose and visualized on a UV transiluminator then carried out the shooting with film poraloid 667.
Data analysis
Data analysis was based on the presence or absence of DNA bands. DNA banding profiles translated into binary data provided a value of 0 for no band and 1 for the presence of DNA bands in a similar position of durian varieties being compared. Cluster analysis was carried out by using the program NTSYSpc version 2.02i with SIMQUAL function UPGMA method (Rohlf (2000). Matrix of genetic similarity was calculated based on Dice coefficient.
RESULTS AND DISCUSSION Primer selection
The primer selection is performed to find primers that can amplify DNA of durian, and to produce a clear DNA band and in large quantities. The primer criteria used for the analysis of DNA diversity is the primer that could produce polymorphic bands, with the state of clear tape, good reproducibility, and the resulting DNA bands which are relatively stable, and easy to read. According to
Williams et al. (1990) used for RAPD primers should
contain 40% G + C bases (usually containing 50-80% G + C). A total of 20 primers of the operon were selected and obtained six primers (OPA-01, OPA-02, OPA-07, OPA-16, OPA-18, and OPA-19) used in this study (Table 1.).
Table 1. The type and bases sequences of 20 selected primer
Primer Sequence of nucleotide
bases (5’-3’)
G+C content (%)
OPA-01* CAGGCCCTTC 70%
OPA-02* TGCCGAGCTG 70%
OPA-04 AATCGGGCTG 60%
OPA-07* GAAACGGGTG 60%
OPA-16* AGCCAGCGAA 60%
OPA-17 GACCGCTTGT 60%
OPA-18* AGGTGACCGT 60%
OPA-19* CAAACGTCGG 60%
OPG-05 CTGAGACGGA 60%
OPG-06 GTGCCTAACC 60%
OPG-07 GAACCTGCGG 70%
OPG-08 TCACGTCCAC 60%
OPH-05 AGTCGTCCCC 70%
OPH-06 ACGCATCGCA 60%
OPH-07 CTGCATCGTG 60%
OPH-08 GAAACACCCC 60%
OPR-05 GACCTAGTGG 60%
OPR-06 GTCTACGGCA 60%
OPR-07 ACTGGCCTGA 60%
OPR-08 CCCGTTGCCT 70%
Note: *: selected primer
nucleotide DNA primer with a nucleotide compiler (Hartati 2006). Primer election on the analysis of RAPD polymorphisms influence the band that is produced, because each has a primer attachment site of its own. As a result of polymorphic, DNA bands that were generated per primer were different, both in size and number of the base pairs of DNA bands. Polymorphism is an image obtained by amplification of DNA fragments where the differences were observed and scored as presence or absence of sequence differences, thereby indicating a variation (McGregor et al. 2000; Mansyah et al. 2003). In accordance with the statement of Hartati (2007) that the polymorphism is a form of genetic variations that occur in the DNA chain.
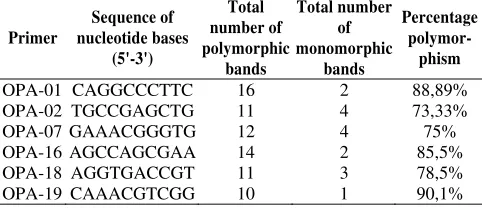
Amplification using six primers (Table 2.) produces the number of bands between 11 (OPA-19) to 18 (OPA-01). According to Hartati (2006) the differences in the number of bands generated per primer due to differences in primer nucleotide base sequence or interaction between the primer and template DNA. This difference illustrates the complex plant genome, so the more diverse genomes will result in an increasingly complex band.
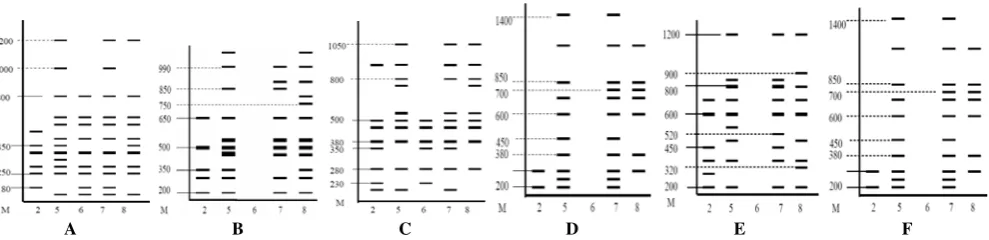
Figure 1. Amplification of the selection OPA-16 and OPA-17 using DNA samples of Sukun durian (1), Sunan (2), Monthong (3) and Petruk (4).
Table 2. Six polymorphic primers used, based on banding pattern produced
Primer
Sequence of nucleotide bases
(5'-3')
Total number of polymorphic
bands
Total number of monomorphic
bands
Percentage
polymor-phism
OPA-01 CAGGCCCTTC 16 2 88,89%
OPA-02 TGCCGAGCTG 11 4 73,33%
OPA-07 GAAACGGGTG 12 4 75%
OPA-16 AGCCAGCGAA 14 2 85,5%
OPA-18 AGGTGACCGT 11 3 78,5%
OPA-19 CAAACGTCGG 10 1 90,1%
Polymorphic DNA bands generated most of the OPA-01 (16 bands), whereas at least the resulting OPA-19 (10 bands). Band is a band-owned polymorphic in some individuals sample, while the monomorphic bands are bands shared by all individual samples. The number of polymorphic DNA bands generated to determine the
diversity of a population, because the polymorphic DNA band describes the state of the plant genome (Hartati 2006).
RAPD diversity among durian varieties
Amplification of the five varieties of durian by using six primers namely OPA-01, OPA-02, OPA-07, OPA-16, OPA-18 and OPA-19 show there is diversity among varieties of durian DNA like Sukun, Sunan, Kani, Petruk and Monthong. Cahyarini et al. (2004) states that the difference in varieties can be seen from the number of band, the band thickness and mobility. Analysis of five varieties of durian grouping based on banding pattern produced the separation of durian Sukun, Sunan, Monthong, and Petruk in a separate group with durian Kani (Figure 2).
Figure 2. Dendrogram grouping of five varieties of durian based on banding pattern with OPA-01, OPA-02, OPA-07, OPA-16, OPA-18 and OPA-19.
Durian varieties and Monthong sunan clustered at 0.84 similarity coefficient or having a similarity of 84%, then were clustered with durian Petruk at 0.83 similarity coefficient and clustered with Sukun and durian Kani respectively at 0.52 and 0.36 similarity coefficient . The result of such grouping when associated with morphological features obtained by the fact that the durian Kani has a different leaf positions with other varieties.
OPA-01
A B C D E F
Figure 3. DNA banding pattern of five varieties of durian with primers: A. OPA-01 B. OPA-02, C. OPA-07, D. OPA-16, E. OPA-18, F. OPA-19. Note: M: marker, 2. Sukun, 5. Sunan, 6. Kani, 7. Monthong, 8. Petruk.
OPA-02
Based on the interpretation of banding pattern with OPA-02 it appears that the durian Kani not able to produce amplification products (Figure 3B). This is possible because the sequence of nucleotide bases that make up the primer is not complemented with the DNA base pairs that make up the sample durian. Like the statement Sanjaya et al. (2002) that the primers used in short length also affect the results of amplification. In addition, according to Prana and Hartati (2003) the amount or concentration of PCR primers and different conditions affect the results of DNA amplification. Interpretation of banding pattern showed that the DNA bands generated in Sunan and Monthong durian as much as 3 distinct bands, namely the size of 1100 bp and 350 bp which is owned by durian Sunan, and the size of 900 bp which is owned by durian Monthong. When compared with durian Petruk, there are 4 bands of DNA that distinguish between durian sunan and Petruk, namely on the size of 750, 800, 900 and 1100 bp which is only possessed by durian Petruk.
OPA-07
The amplified with OPA-07 showed the existence of diversity among varieties of durian Sukun, Sunan, Kani, Monthong and Petruk (Figure 3C). Based on the results of amplification and interpretation of banding pattern on the image below, obtained by the total number of DNA bands generated by 44 bands, with bands most widely produced in Sunan and Monthong durian, which is 10 DNA bands. DNA bands generated by durian sunan and Petruk differ in one band, namely the size of 200 bp. Karsinah et al. (2002) states that the specific bands produced can provide hope as the identification of varieties. Gained as a marker of a specific band or as a differentiator varieties with other varieties is very important, because identification of varieties are generally based on morphological characters which require intensive observation of mature plants.
OPA-16
Amplification with the OPA-16 produced 35 DNA bands (Fig. 3D). DNA bands most widely produced in the sample of Monthong durian, which is as many as 11 bands of DNA. Band on the size of 1400 bp, 380 bp and 300 bp is distinguishing between the varieties of durian band Sukun, Sunan, Kani, Monthong and Petruk. Band on the size of
600 bp distinguish Monthong durian varieties from other varieties of durian. Petruk and sunan durians are distinguished by 4 bands of DNA, i.e. the band on the size of 200, 900 and 1000 bp which is owned by durian Sunan, and the band on the size of 600 bp which is owned by Petruk durian.
OPA-18
The amplified with OPA-18 produced a total number of DNA bands as many as 33 DNA bands (Fig. 3E). Durian varieties and Monthong sunan distinguished by three bands of DNA, the band size 550 bp and 500 bp owned sunan durian, and 520 bp bands owned Monthong durian. Band on the size of 800 bp has a different thickness between the Sunan and Monthong with durian Petruk. DNA bands of different thickness, according to Sanjaya (2002) due to low annealing temperature is below 50-600C, which can cause the resulting product has a low specificity.
OPA-19
The amplified with OPA-19 showed that durian sunan and Monthong have a similar banding pattern, only differentiated by the band on the size of 700 bp DNA alone (Figure 3F). This grouping indicates that the morphological diversity does not necessarily indicate a different genetic diversity (Cahyarini et al. 2004).
Diversity of Sukun durian population in different growing regions
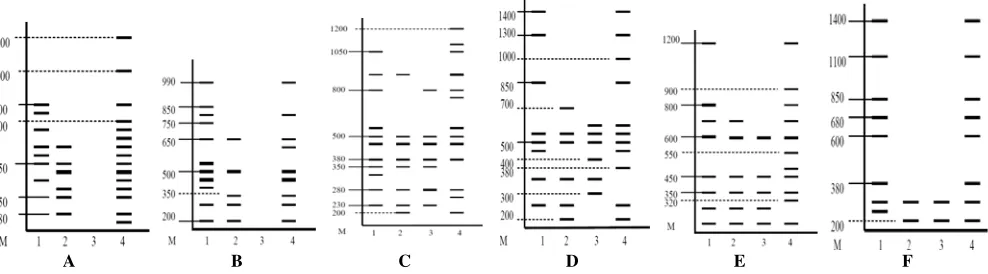
The amplified durian planting Sukun from different regions by using six primers showed the diversity of DNA that can be seen in the resulting banding pattern (Figure 4). Based on the pattern of DNA bands were then performed cluster analysis and dendrogram obtained by clustering durian varieties of Sukun. The analysis divides the four Sukun durian sample into two groups: group I consisted of Sukun durian from Gempolan, Karanganyar and Sukun durian from Salatiga. This shows that the durian from Salatiga called Sukun durian by farmers in the village of Brongkol, Salatiga allegedly did Sukun durian varieties like the one in Seed Garden Ranukutri, Karanganyar.
coefficient of 0.60 or it can be said to have a similarity level of 60%. Grouping Sukun durian grown in different regions show that Sukun from Gempolan, Karanganyar with Sukun from Salatiga have the same genetic makeup. Group II consists of Sukun durian from Garden Seeds Ranukutri, Karanganyar and durian from Jepara. This is probably because Sukun durian seedlings from Jepara comes from Sukun which is on Seed garden Ranukutri, Karanganyar originating from the same elders, so there is no genetic change. Conversely, Sukun durian from Gempolan, Karanganyar have further similarity level with Sukun durian of Seeds Garden Ranukutri. Sukun durian of Karanganyar and Jepara compared with the level of similarity with Sukun durian from Salatiga. This may be because these plants originated from different elders. In
accordance with the statement Cahyarini et al. (2004) that
like to say if less than 0.6 or 60%. Thus the grouping proves that Sukun durian seedlings from Jepara originating from seed garden Ranukutri, Karanganyar derived from the same elders.
Figure 4. Dendrogram grouping of Gempolan durian Sukun,
Karanganyar Ranukutri garden seed, Jepara and Salatiga based on banding pattern with 01, 02, 07, 16, OPA-18 and OPA-19.
OPA-01
Amplification with the OPA-01 produced a total of 28 DNA bands, with Sukun durian samples from Salatiga generate DNA bands at most. Image interpretation of diversity patterns of DNA bands show the diversity of banding pattern on the Sukun durian grown in different regions, namely the band on the size of 750 bp only owned
Sukun durian from Gempolan, Karanganyar and bands on the size of 150 bp and 700 bp are owned by the Sukun durian from Salatiga ( Figure 5A). These DNA bands that distinguish these four Sukun durian from different localities.
Band on 400 base pairs are also thicker than other DNA bands. This is probably due to the competition site on the DNA template primer annealing which caused one fragment was amplified in large quantities and other fragments amplified in small amounts, so that only a few are detected as a band after amplification (Grattapaglia et al. 1992). Sample number 3 is Sukun durian from Jepara not able to produce amplified DNA bands. This is possible because the sequence of nucleotide bases that make up the primer is not complemented with the DNA base pairs that make up the Sukun durian samples from Salatiga.
OPA-02
Based on the interpretation of DNA banding pattern it was obtained that there was diversity in Sukun durian grown in different regions. Sample No. 1 (Sukun durian from Gempolan Karanganyar) has a band on the size of 400 bp that distinguishes the other durian Sukun. In the sample No. 4 (Sukun durian from Salatiga) which has the tape on the size of 600 bp (Figure 5B).
OPA-07
The amplified with OPA-07 yielded a total of 39 band. Band on the size of 1200 bp, 1100 bp 750 bp is the only tape produced by Sukun durian from Salatiga (Figure 5C). Band on the size of 300 bp is also a distinguishing band of Gempolan Sukun durian, Sukun durian Karanganyar with another. Sukun durian from Salatiga able to generate DNA bands by the amount at most, which is 13 bands.
OPA-16
Amplification of DNA bands produced a total of 31 bands of DNA (Figure 5D). Samples Sukun durian from Salatiga is a sample of DNA that produces the most, while Sukun durian from Jepara generates DNA bands at least. Band on the size of 1000 bp and 380 bp DNA band which distinguishes a Sukun durian from Salatiga with others. Band on the size of 700 bp is also a distinguishing band of
A B C D E F
Ranukutri Sukun durian, durian Karanganyar with other Sukun. Meanwhile, the band on the size of 400 bp DNA band which distinguishes a durian Sukun durian from Salatiga to another. Based on Figure 22 below, the DNA bands generated by Sukun durian from Gempolan Karanganyar similar DNA bands generated by Sukun durian from Salatiga.
In the amplification with the OPA-16 all samples can produce amplification products. Grattapaglia et al. (1992) states that DNA amplification occurs if the primer attached to the two complementary sites that were located adjacent to each other and orientation are reversed. The distance between the site amplification produced DNA fragments with different sizes base pairs. Generally the number of base pairs that can still be amplified on genomic DNA of plants ranging from 200 bp to 2000 bp sometimes even to 5000 bp. DNA band located at base pairs (bp) of the same shows that the DNA band has the same migration and assumed as a homologous locus.
OPA-18
The amplified with OPA-18 obtained 30 DNA bands. DNA bands on the size of 550 bp, 500 bp and 320 bp only owned by Sukun durian samples from Salatiga (Figure 5E). This is a distinguishing band that can be assumed as a marker with another durian Sukun. The results showed amplification bands with different thicknesses, ie the band on the size of 600 bp.
OPA-19
Amplification reaction with OPA-19 produced DNA bands between 200-1400 bp size by the total number of DNA bands generated by 20 bands (Figure 5F). DNA bands generated by the durian seed from the garden Ranukutri, durian Karanganyar with Sukun from Jepara exactly the same, namely as much as 2 bands. Tape produced by the Sukun from Gempolan durian, durian Karanganyar with Sukun from Salatiga only distinguished by a band on the size of 200 bp, which is not owned by Sukun durian from Gempolan. Karanganyar and Salatiga are on the size of 250 bp is only owned by Sukun durian from Gempolan, Karanganyar . This tape can be used as a marker of durian Gempolan Sukun, Karanganyar.
Weeden et al. (1992) mentions that the intensity of
DNA bands amplified in each primer is strongly influenced by (i) the purity and concentration of template DNA. Template DNA containing phenolic compounds and the template DNA concentration is too small often result in amplification of DNA bands that dim and unclear, (ii) the distribution of primer annealing site on template DNA (Grattapaglia et al. 1992; Weeden et al. 1992), (iii ) the existence of competition where the primer attachment to DNA single mold that causes large amounts of amplified fragments and other fragments slightly. Amplification process may be initiated in several places, but only a few sets that can be detected as a band after amplification (Grattapaglia et al. 1992).
CONCLUSION
Amplification using the OPA-01, OPA-02, OPA-07, OPA-16, OPA-18, and OPA-19 produced banding pattern that shows the diversity among varieties of durian Sukun, Sunan, Kani, Monthong and Petruk, and diversity of durian grown in different regions. Clustering dendrogram with the UPGMA method in five varieties of durian tend to segregate, i.e. Sukun, Sunan, Monthong and Petruk in a group which split with durian Kani. Clustering dendrogram with the UPGMA method on Sukun durian grown in different regions resulted in two groups: group I consisted of durian from Gempolan, Karanganyar and Salatiga. Group II consists of durian from Garden Seeds Ranukutri, Sukun and from Jepara.
REFERENCES
Ashari S. 1995. Horticulture: the cultivation aspects. UI Press. Jakarta. [Indonesia]
Asins MJ, Herrero R, Navarro L. 1995. Factors affecting Citrus tree isozyme-gene expression. Theor Appl Genet 90: 892-898.
Azrai M. 2005. Utilization of molecular markers in plant breeding selection process. J AgroBiogen 1 (1): 26-37. [Indonesia]
Baswarsiati, Yuniarti, Suhardi, Harwanto, Rahmawati D, Soegiyarto M. 2007. Characterization of some properties of durian germplasm in Kediri District. Assessment Institute for Agricultural Technology (BPTP), East Java Province. Surabaya. [Indonesia]
Cahyarini RD, Yunus A, Purwanto E. 2004. Identification of the genetic diversity of some local soybean varieties in Java based on isozyme analysis. Agrosains 6 (2): 79-83. [Indonesia]
Directorate of Seed. 1996. Descriptions of fruits and vegetables varieties. Directorate of Seed. Directorate General of Food Crops and Horticulture. Jakarta. [Indonesia]
Grattapaglia D, Chaparro J, Wilcox P, McCord S, Werner D, Amerson H, McKeand S, Bridgwater F, Whetten R, O’Malley D & Sederoff R. 1992. Mapping in woody plants with RAPD markers: application to breeding in forestry and holticulture. Application of RAPD Technology to Plant Breeding. Joint Plant Breeding Symposia Series CSSA/ASHS/AGA. Minneapolis. 1 November 1992.
Hartati D. 2006. Genetic diversity sengon (Albazia falcataria L. Fosberg) through DNA markers. Research and Development Center for Forest Plantation (P3HT). Yogyakarta. [Indonesia]
Hartati D. 2007. Estimation of genetic diversity within and between provenances Pulai (Alastonia scholaris (L.) R. Br.) using RAPD markers. [Thesis S1]. Faculty of Agriculture, Gadjah Mada University. Yogyakarta.
Karsinah, Sudarsono, Setyobudi L, Aswidinnoor H. 2002. Genetic diversity of citrus germplasm based on RAPD analysis. J Bioteknol Pertanian 7 (1): 8-16. [Indonesia]
MacGregor TG. 2000. Genetic linkage mapping of the Avr1a avirulence gene in the soybean pathogen Phytophthora sojae. [Dissertation]. University of Western Ontario. Ontario, Canada.
Maftuchah, Zainudin A. 2007. Genetic variation of mango cultivars using Random Amplified Polymorphic molecular markers of DNA. Proceedings of the National Seminar on Horticulture. Sebelas Maret University, Surakarta, 17 November 2007. [Indonesia]
Mansyah E, Baihaki A, Setiamihardja R, Darsa JS, Sobir. 2003. Analysis of genetic variability of mangosteen (Garcinia mangostana L.) in Java and West Sumatra using RAPD technique. Zuriat 14 (1): 35-44. [Indonesia]
Martasari C, Sugiyatno A. 2007. Characterization of morphology and genetic diversity analysis of apple (Malus sp.) germplasm. Proceedings of the National Seminar on Horticulture. Sebelas Maret University, Surakarta, 17 November 2007.
Nandariyah. 2007. Identification of the genetic diversity of salak Java cultivars based on RAPD analysis. Agrosains 9 (2): 70-76. [Indonesia]
Powell W, Margonte M, Andre C, Hanafey M, Vogel J, Tingey S, Rafalski A. 1996. The comparison of RFLP, RAPD, AFLP and SSR markers of Germplasm analysis. Mol Breed 2: 225-238.
Prana TK, Hartati NS. 2003. Identification of DNA fingerprints of taro
(Colocasia esculenta L. Schott) Indonesia with the technique of
RAPD (Random Amplified Polymorphic DNA), primer screening and optimization of PCR conditions. J Natur Indonesia 5 (2): 107-112. [Indonesia]
Rohlf FJ. 2000. NTSYS-pc numerical taxonomy and multivariate analysis system. Version 1.80. Exerter Software. New York.
Sambrook J, Fritsch EF, Maniatis T. 1989. Molecular cloning: a laboratory manual. Cold Spring Harbour Laboratory. New York Sanjaya L, GA Wattimena, Guharja E, Joseph M, Aswidinoor H, Stam P.
2002. The resistance diversity of Capsicum accessions against antraknose (Colletotricum capsici) based on RAPD markers. J Bioteknol Pertanian 7 (2): 37-42. [Indonesia]
Sarwono B. 1995a. Durian from the forest. Trubus. December 1995. No. 313. Th. 24.: 14. [Indonesia]
Sarwono B. 1995b. Varieties of durian cultivation. Trubus. December 1995. No. 313. Th. 24: 15. [Indonesia]
Sriyono. 2006. Identification and genetic diversity of the parent tree durian (Durio zibethinus Murr.) Locally in Central Java based markers isoenzymes morphology and banding pattern. [Thesis]. Agronomy Program, School of Graduates. Sebelas Maret University. Surakarta. [Indonesia]
Sumarsono L. Syaefudin, Dimyati A, Abdurrahman. 2002. Durian seed grafting technique on different stage entres and buds models. Buletin Teknik Pertanian 7 (1): 10-13. [Indonesia]
Uji T. 2005. The diversity of species and germplasm sources of durio
(Durio spp.) in Indonesia. Buletin Plasma Nutfah 11 (1): 28-33.
[Indonesia]
Weeden NF, Timmerman GM, Hemmat M, Kneen BE, Lodhi MA. 1992. Inheritance and reliability of RAPD markers. Application of RAPD Technology to Plant Breeding. Joint Plant Breeding Symposia Series CSSA / ASHS / AGA. Minneapolis. 1 November 1992.
Williams JGK, Kubelik AR, Livak KJ, Rafalski JA, Tingey SV. 1990. DNA polymorphisms amplified by arbitrary primers useful as genetic markers. Nucl Acids Res 18: 6531-6535.