THE GLOBAL ECONOMIC CRISIS AND ITS EFFECT ON INDONESIAN AGRIBUSINESS EXPORTS?
Muhammad Firdaus
Department of Economics, Faculty of Economics and Management Bogor Agricultural University
ABSTRACT
The global economic crisis which started from during 2008 was expected to lower the global demand for agricultural products. Data from the Central Statistical Agency, Indonesia, shows that there was a significant decrease in the export value of non-oil and gas products from 2008 to 2010; and a significant increase from 2009 to 2010. Export values of some main exported products such as vegetable and animal oil, rubber, wood, coffee, tea and pepper decreased in almost all destination countries. The panel data method was applied in analyzing the determinants and impacts of the global economic crisis on some of the Indonesian major agricultural exports. This study found that the global economic crisis significantly depressed the commodity price. The volume of some main agricultural exports increased from 2008 to 2009; however, a large drop in commodity price reduced the export value. The panel data model found that the main determinant of Indonesian exports of CPO, rubber and coffee was the export price. The coefficient of economic distance was negative and statistically significant.
Keywords: economic crisis , agriculture, export demand, panel data model.
INTRODUCTION
The economic downturn in the US and EU countries spread across the world through reduced financial flows such as investment in stock markets, foreign direct investment and through a drop in demand for goods and services such as oil and gas, agriculture, manufactured products and tourism. Thus, the financial crisis not only harmed production in US and EU countries, but also led to drops in exports and production throughout countries which had relied on the US and EU markets fro their export growth. However, some countries are expected to have various experiences in impacts of the global economic crisis, depending on economic structure, integration into the global market and strengths of the economy as seen in foreign reserves, fiscal deficits and external debt (Wiggins, Keats and Vigneri, 2009).
The data from the Central Statistical Agency showed there was a significant decrease in export value of oil and gas also non-oil and gas products from Indonesia in 2008 compared to 2009 (14.97%, Table 1). Export values of agricultural products decreased to almost all destination countries. For example, values of Indonesian products in the EU decreased from US $ 14.1 million in the period of January-November 2008 to US $ 12.1 million in the January- November period 2009; in the US, from US $ 11.6 million into US $ 9.4 million. However, export value significantly increased from January up to March 2009 compared to January up to March 2010 (53.7%). These figures indicate that the global economic crisis has had a significant impact on the Indonesian economy. Some further analyses were required to investigate the impact of the global economic crisis on Indonesian agribusiness. This study was aimed to describe some impacts of the global economic crisis on Indonesian exports. Some major agricultural exports such as estate crops were analyzed using the panel data model to capture the determinants of exports and effects of the global economic crisis.
TABLE 1. INDONESIAN EXPORT VALUE IN 2008, 2009 AND 2010 (US S MILLION)
Year Total Oil and Gas Non Oil and Gas
2005 85,660.0 19,231.6 66,428.4
2006 100,798.6 21,209.5 79,589.1 2007 114,100.9 22,088.6 92,012.3 2008 137,020.4 29,126.3 107,894.2 2009 116,510.0 19,018.3 97,491.7
Change 2008-2009 -14.97 -34.7 -9.6
Jan-March 2009 23,029.2 3,331.6 19,697.6 Jan-March 2010 35,392.3 6,504.3 28,888.0
THEORETICAL AND EMPIRICAL MODEL
According to Massa and te Velde (2008), the recession in some advanced economies was expected to reduce growth in the developing world. The transmission of downturn in advanced to emerging economies included the following process. Firstly, it happened through movements of capital. The stock market fell as foreign investors liquidated portfolios fearing future losses from recession. Official aid reduced as advanced economies faced fiscal deficits. Secondly, it occurred through exchange rate depreciation. Countries that faced large outflows of capital or sharply adverse current accounts from falling commodity prices might see their currencies depreciated. The weaker currencies would tend to encourage production of exports and to discourage consumption of imports, however it also tended to raise domestic prices. Thirdly, less demand for exports from emerging economies led to drops in commodity prices then reduced earnings.
A study by Keats and Vigneri (2009) supported that the global economic downturn would lead to less demand for agricultural commodities, although for some foods the effects will be minor given the low income elasticity of demand for staples. Stronger effects might be applied for luxury foods such as meat and dairy, for vegetable oils and for industrial inputs such as cotton and rubber.
The global economic downturn was likely to reduce international prices of agricultural commodities. The World Bank predicted agricultural prices to fall by 21% in 2009, with foods and grains prices dropping more than raw materials prices. Some commodities still experienced a small decrease in 2010 and some are expected to rise back.
Based on the literature indicated, two hypotheses were proposed in this study. The global economic crisis reduced earnings from Indonesian agricultural exports. Determinants of demand for some main agricultural exports were commodity prices, national income, real exchange rates, distance and size of population.
and after the crisis (2005-2008 and 2009) were compared. To capture the effects of the global economic crisis and to determine the determinants of global demand for some Indonesian estate crops, this study used the gravity model. The gravity model was first proposed by Tinbergen (1962) and refined by Linnemann (1966). Tinbergen's original aim was to account for the factors that explained the size of trade flows between two countries. Two factors were the size of gross domestic product of the exporting and importing countries. Linnemann later added the size of the populations of the two trading countries to reflect the role of scale economies. The third factor was the resistance to trade such as costs of transportation, transport time, tariffs, quotas and other trade policies. The model became more popular since the introduction of the theoretical gravity model by Anderson and Van Wincoop (2004). Empirically the gravity model has been used largely in explaining the effects of different policies and other determinants of trade flows with the key variables of
economic size and distance. De (2009) conducted a study of India’s trade potential for
anticipating the global economic and financial crisis. By employing the gravity model, the author found that the trade facilitation has an important complementary role to
play in enhancing India’s trade after the global crisis.
The empirical gravity model in this study is formulated as follow: Xit= αit+ Z’ β + εit (1)
Where:
Xit : Export value of an exported commodity from Indonesia to country i at time t
Z : Vector of five exogenous variables which are as follow: 1. Price of exported commodity in US $ (Price);
2. Real Gross Domestic Product of country I (GDP); 3. Real exchange rate of country on US $ (Er);
4. Economic distance from Indonesia to country i (distance in mile times world
oil price), and
5. Dummy of the global economic crisis (1 for year 2009, an 0 for others).
RESULTS AND DISCUSSION
Indonesian Agribusiness Exports Before and After the Global Economic Crisis
Based on the data from the Ministry of Trade and Central Statistical Agency, the development of Indonesian agribusiness exports from 2005 up to 2009 are presented in Appendix 1. Agribusiness products contributed about 28.6% of non-oil and gas export values in 2009. Vegetable oil and fat was the main contributor. Its share was 12.5% of the total values. Vegetable oil export mainly comes from crude palm oil (CPO). Some other estate crops such as rubber and its fractions, cocoa, coffee, tea and pepper contributed 7.8 % of total values. These commodities then are analyzed by using the panel data model, which are presented in the next section.
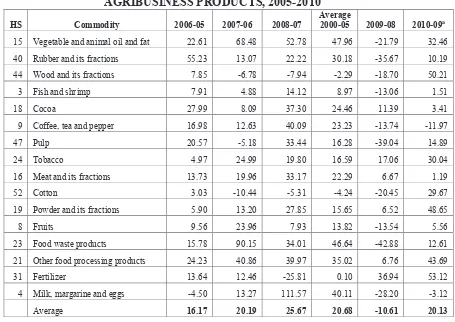
Table 1 shows the development of export value of Indonesian agribusiness from 2005 up to 2010. Overall the average growth of export value of agribusiness products was 20.68% annually. The decrease in export value in 2009 caused the growth of export value to become minus 10.61% from 2008 to 2009. Furthermore the data in Table 1 show that export value of agribusiness products increased at a rate of 20.13% from January up to February 2010 compared to January up to February 2009. The comparison among commodities shows that Vegetable and animal oil and fat experienced the highest growth for the period of 2005 up to 2009 (47.96%), followed by Food waste products, milk, margarine and eggs and other food processing products. A significant increase also was experienced by Vegetable and animal oil from January up to February 2010 compared to January to February 2009. Based on these figures, it can be concluded that the global economic crisis had a significant effect on Indonesian agribusiness exports. The export values of agribusiness products decreased from 2008 to 2009 and then increased from 2009 to 2010 significantly.
Effects of the Global Economic Crisis on Export of Main Agricultural Products
Table 2 below shows the development of export volume and price of CPO from 2005 up to 2009 in 15 destination countries including India as the main destination and the US as the trigger of the global economic crisis. The volume of exports of CPO increased from 2005 to 2008 in all destinations (13.4% in 15 countries and 81.9% in the US market). From 2008 to 2009, the volume of exports of CPO in 15 countries grew at a higher rate of 21.4% and a still 32.5% in the US market. However, the price of CPO decreased from 2008 to 2009 in all destinations. The price fell from 0.59 US $ per kg in 2008 to 0.43 US $ per kg in 2009. The drop in CPO price led to a decrease in export value of minus 11.2%.
TABLE 2. GROWTH OF EXPORT VALUE OF INDONESIAN AGRIBUSINESS PRODUCTS, 2005-2010
HS Commodity 2006-05 2007-06 2008-07
Average
2000-05 2009-08 2010-09a
15 Vegetable and animal oil and fat 22.61 68.48 52.78 47.96 -21.79 32.46 40 Rubber and its fractions 55.23 13.07 22.22 30.18 -35.67 10.19 44 Wood and its fractions 7.85 -6.78 -7.94 -2.29 -18.70 50.21
3 Fish and shrimp 7.91 4.88 14.12 8.97 -13.06 1.51
18 Cocoa 27.99 8.09 37.30 24.46 11.39 3.41
9 Coffee, tea and pepper 16.98 12.63 40.09 23.23 -13.74 -11.97
47 Pulp 20.57 -5.18 33.44 16.28 -39.04 14.89
24 Tobacco 4.97 24.99 19.80 16.59 17.06 30.04
16 Meat and its fractions 13.73 19.96 33.17 22.29 6.67 1.19
52 Cotton 3.03 -10.44 -5.31 -4.24 -20.45 29.67
19 Powder and its fractions 5.90 13.20 27.85 15.65 6.52 48.65
8 Fruits 9.56 23.96 7.93 13.82 -13.54 5.56
23 Food waste products 15.78 90.15 34.01 46.64 -42.88 12.61 21 Other food processing products 24.23 40.86 39.97 35.02 6.76 43.69
31 Fertilizer 13.64 12.46 -25.81 0.10 36.94 53.12
4 Milk, margarine and eggs -4.50 13.27 111.57 40.11 -28.20 -3.12
Average 16.17 20.19 25.67 20.68 -10.61 20.13
Note: a. Data on January-February 2010 and 2009
Source: Ministry of Trade and Central Statistical Agency (2010)
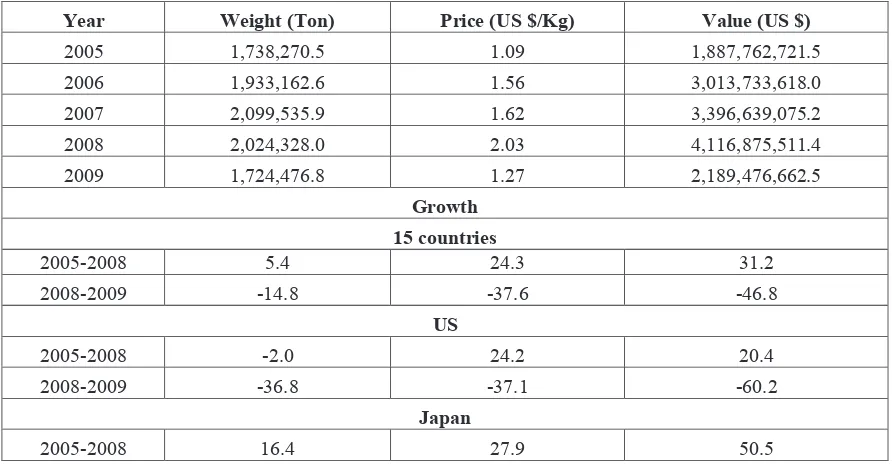
5.41% from 2005 to 2008 in all destinations, but at minus 2% in the US market. From 2008 to 2009, both volume and price of export of rubber in 15 countries decreased. The drop in both volume and price of rubber led to a significant decrease in export value of minus 11.2%.
TABLE 3. TREND OF EXPORT VOLUME AND PRICE OF INDONESIAN CPO, 2005-2009
Year Weight (Ton) Price (US $/Kg) Value (US $)
2005 8,714,615.2 0.30 2,618,303,088.3
2006 9,744,791.0 0.31 3,055,144,123.3
2007 9,838,661.5 0.50 4,878,718,116.3
2008 12,537,379.3 0.59 7,434,458,193.8
2009 15,221,215.8 0.43 6,600,788,532.4
Growth
15 countries
2005-2008 13.4 27.4 42.9
2008-2009 21.4 -26.9 -11.2
India
2005-2008 25.0 26.3 60.3
2008-2009 14.8 -27.6 -16.9
US
2005-2008 81.9 30.5 116.4
2008-2009 32.5 -28.9 -5.7
Note: The rests of destination are: China, Netherland, Pakistan, Malaysia, Singapore, Bangladesh, Germany, Ukraine, Egypt, Italy, Spain and South Africa
Source: Ministry of Trade and Central Statistical Agency (2010)
TABLE 4. TREND OF EXPORT VOLUME AND PRICE OF INDONESIAN RUBBER, 2005-2009
Year Weight (Ton) Price (US $/Kg) Value (US $)
2005 1,738,270.5 1.09 1,887,762,721.5
2006 1,933,162.6 1.56 3,013,733,618.0
2007 2,099,535.9 1.62 3,396,639,075.2
2008 2,024,328.0 2.03 4,116,875,511.4
2009 1,724,476.8 1.27 2,189,476,662.5
Growth
15 countries
2005-2008 5.4 24.3 31.2
2008-2009 -14.8 -37.6 -46.8
US
2005-2008 -2.0 24.2 20.4
2008-2009 -36.8 -37.1 -60.2
Japan
2008-2009 -31.9 -35.9 -56.3
Note: The rests of destination are: China, Singapore, Korea, Canada, Germany, Brazil, French, Spain, Netherland, Italy, India, Turkey and South Africa
Source: Ministry of Trade and Central Statistical Agency (2010)
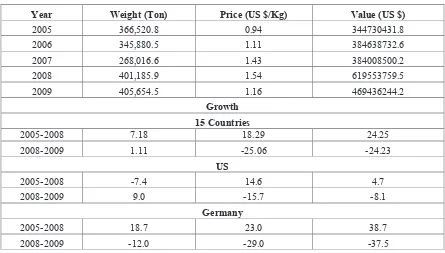
Table 4 shows the development of export volume and price of coffee from 2005 up to 2009 in 15 destination countries. US is the main destination, followed by Germany. Overall the volume of export of CPO increased from 2005 to 2008 in all destinations at the rate of 7.18% and at the rate of 1.11% from 2008 to 2009. The price and value of coffee exports experienced the same trend with CPO. The coffee price decreased from 2008 to 2009 which led to a significant decrease in export value. In the US market, the trend of export volume of coffee from 2005 to 2008 was reduced, because there was a huge drop of export volume from 2006 to 2007. From the figures in Tables 2, 3 and 4, it can be concluded that there were significant decreases in the values of the main Indonesian agricultural exports (CPO, rubber and coffee) from 2008 to 2009. This drop was mainly caused by a decrease in export prices rather than export volumes. As mentioned in the previous section, the global economic crisis led to a lower demand for agricultural products which decreased the world commodity prices.
TABLE 5. TREND OF EXPORT VOLUME AND PRICE OF INDONESIAN COFFEE, 2005-2009
Year Weight (Ton) Price (US $/Kg) Value (US $)
2005 366,520.8 0.94 344730431.8
2006 345,880.5 1.11 384638732.6
2007 268,016.6 1.43 384008500.2
2008 401,185.9 1.54 619553759.5
2009 405,654.5 1.16 469436244.2
Growth
15 Countries
2005-2008 7.18 18.29 24.25
2008-2009 1.11 -25.06 -24.23
US
2005-2008 -7.4 14.6 4.7
2008-2009 9.0 -15.7 -8.1
Germany
2005-2008 18.7 23.0 38.7
Note: The rests of destination are: Japan, Italy, Algeria, UK, Belgium, India, Egypt, Malaysia, Philippines, Georgia, Rumania, Australia
Source: Ministry of Trade and Central Statistical Agency (2010)
Determinants of Indonesian Agribusiness Exports and Effects of Global Economic Crisis
The results of estimation of the panel data model for each of the commodities are presented in Table 5. The diagnostic test indicated that the Random-effects model was the most robust one for all commodities observed. For the CPO model, the global economic crisis reduced the exports of Indonesian CPO statistically. This is indicated by the minus coefficient of crisis dummy with p-value less than 0.05. The effect of global economic crisis was also negative on the exports of Indonesian rubber and coffee. The coefficients of that effect have p-value of 0.085 and 0.111 for rubber and coffee.
The estimation of panel data indicated that the main determinant of export values of CPO, rubber and coffee is price. For CPO and rubber, a 1% decrease in export price will reduce export values of 1.50% and 1.56%. This means that export value is elastic to changes in export price. As mentioned in the previous section, the global economic crisis lowered the commodity prices. Thus even though the export volumes increased from 2008 to 2009, the lower prices decreased the export value of CPO, rubber and coffee.
The gravity model used in this study included the distance between the exporter and destination countries. The panel data model showed that economic distance affected the export value significantly. An increase of 1% in transportation cost reduced the export value of CPO (0.03%) and the export value of rubber (0.73%). The effect of transportation cost on CPO was relatively small because of very high demand for Indonesian CPO. Based on UN-Comtrade data, in 2009 Indonesia was the largest exporter of CPO in the world. The effect of the real exchange rate on export value was positive. However, the coefficient of the real exchange rate effect is statistically significant only in the coffee model. This may be related to high competition in the world coffee market. For the other two commodities, CPO and rubber, Indonesia still dominated the world exports. An increase of 1% in the real exchange rate of a destination country would increase by 0.18% the export values of coffee, because of the demand for coffee in that country.
Variable CPO Rubber Coffee
Price 1.4950a
(.0.000)b
1.5607 (.0.000)
.7581 (.0.000)
GDP -.0311
(.0.872)
.6726 (.0.000)
.2846 (.0.001)
Er .0610
(.0.630)
.0281 (.0.749)
.1835 (.0.014)
Distance -.0285
(.0.006)
-.7342 (.0.009)
.4907 (.0.006)
Crisis -.3222
(.0.018)
-.1268 (.0.111)
-.1354 (.0.085)
R-sq:
within between overall
Wald chi2 (5)
Prob > chi2
0.6194 0.7898 0.7748
134.91
0.0000
0.6194 0.7898 0.7748
97.19
0.0000
0.6194 0.7898 0.7748
129.36
0.0000
Note: a. Estimated parameter b. P-value
CONCLUSIONS
REFERENCES
Anderson, J. E., E. V. Wincoop, 2004, Trade Costs, Journal of Economic Literature, Vol. XLII, No. 3, pp. 691-751.
Central Statistical Agency. 2005-2010. Export Import Data. Jakarta.
De, P., 2009, Global Economic and Financial Crisis, RTNeT Working Paper Series No.6.
Hsiao, C., 2004, Analysis of Panel Data, Cambridge University Press, UK.
Linnemann, H, 1966, An Econometric Study of International Trade Flows. Amsterdam: North, Holland.
Massa, I., D. W. te Velde, 2008, The Global Fincancial Crisis: Will Successful African Countries be Affected? Background Note, December.
UN-Comtrade. 2009. World Trade Data.
Verbeek, M., 2007, Modern Econometrics, John Wiley and Sons Inc., US.
Appendix 1. Export of Indonesian Agribusiness Products, 2005-2009 (US $ Million)
HS Commodity Share (%)a 2005 2006 2007 2008 2009
15 Vegetable oil and fat 12.53
4,950.6 6,069.9 10,226.8 15,624.0 12,219.5 40 Rubber and its fractions 5.04
3,560.0 5,526.2 6,248.7 7,637.3 4,912.8 44 Wood and its fractions 2.40
3,111.3 3,355.6 3,128.2 2,879.8 2,341.2
3 Fish and shrimp 1.75
1,522.5 1,642.9 1,723.0 1,966.3 1,709.5
18 Cocoa 1.45
668.0 855.0 924.2 1,268.9 1,413.4 9 Coffee, tea and pepper 1.29
787.0 920.6 1,036.9 1,452.6 1,253.0
47 Pulp 0.89
934.2 1,126.4 1,068.1 1,425.3 868.8
24 Tobacco 0.61
323.7 339.8 424.7 508.8 595.6 16 Meat and its fractions 0.55
278.9 317.2 380.5 506.7 540.5
52 Cotton 0.54
755.0 777.9 696.7 659.7 524.8 19 Powder and its fractions 0.32
188.1 199.2 225.5 288.3 307.1
8 Fruits 0.27
206.1 225.8 279.9 302.1 261.2 23 Food waste products 0.25
146.4 169.5 322.3 431.9 246.7 21 Other food processing products 0.24
91.2 113.3 159.6 223.4 238.5
31 Fertilizer 0.23
171.6 195.0 219.3 162.7 222.8 4 Milk, margarine and eggs 0.22
133.4 127.4 144.3 305.3 219.2
Total Agribusiness Products 28.6 17,828.0
21,961.7 27,208.7 35,643.1 27,874.6
Total Non Agribusiness Products 71.4
48,600.4 57,627.4 64,803.6 72,251.1 69,617.1