UNVERSITY TEKNIKAL MALAYSIA MELAKA
MODELING AND ANALYSIS OF SWINE SKIN BIOMETRICS
FOUND ON LEATHER PRODUCTS
This report submitted in accordance with requirement of the University Teknikal Malaysia Melaka (UTeM) for the Bachelor Degree of Manufacturing Engineering
(Robotics and Automation) (Hons.)
by
NG RHUN HOCK B051010148 880511086239
FACULTY OF MANUFACTURING ENGINEERING
ABSTRAK
ABSTRACT
DEDICATION
To my beloved family,
For my respectable lecturers
And not forgetting,
For my thoughtful and thorough supervisor and co-supervisor,
Thank you for being so supportive as well as my gratitude for the willingness to guide and to sacrifice the precious time of yours to put me through this.
ACKNOLEDGEMENT
First of all, I would like to express my gratitude to Dr. Ahmad Yusairi B. Bani Hashim, my appointed supervisor for my final year project 1 (FYP 1) and final year project 2 (FYP 2). Apart from being dedicated himself, he never fails to guide me through the entire project from the start until the end of producing this report. Besides, he always gives a lot of opinions and suggestions through this project. I gave my very best not to let my supervisor down to succeed the final year project 2. Credits to him for sharing all the knowledge he had and practically he is willing to put his time off just to fulfill my enquiries on and off.
TABLE OF CONTENT
2.2 Fingerprint Liveness Detection Based On Quality Measures 5 2.3 Data Acquisition and Quality Analysis of 3-Dimesional Fingerprints 6
2.4 Biometric Systems 7
2.5 Quality Assessment of Biometric Systems: Comprehensive Perspective Based on Accuracy and Performance Measurement 9 2.6 Multimodal Biometric Person Recognition Base on Fingerprint &Finger
Knuckle Print Using Correlation Filter Classifier 10 2.7 Sequential Fusion of Decisions from Adaptive and Random Samples
For Controlled Verification Errors 12 2.8 Temporal Analysis of Fingerprints Impressions 13 2.9 A Better Matching Accuracy for Verification & Identification
Using Biometric Features 14
Enhanced Image Processing 20 2.12 Characterization and Functional Analysis of Skin-derived Dendritic
Cells from Swine without a Requirement for in Vitro Propagation 21 2.13 Mechanical Response of Pig Skin under Dynamic Tensile Loading 21 2.14 Development of Transgenic Cloned Pig Models of Skin Inflammation
by DNA Transposon-Directed Ectopic Expression of Human beta1
and alpha2 Integrin 22
2.15 Automatic Segmentation of Latent Fingerprints 23 2.16 Invariant Representation of Orientation Fields or Fingerprint Indexing 24 2.17 Feature-level Fusion of Fingerprint and Finger vein for Personal
Identification 25
CHAPTER 3: METHODOLOGY 27
3.1 Problem Statement Definition 27 3.2 Project Planning 27
3.2.1 Project Flow Chart 28
3.3 Material Selection & Preparation 31 3.4 Conceptual Design of Box for BAS System 35
3.5 Fabricate and Materials 38
3.6 Project Overview 42
3.7 Microsoft Visual Studio 2010 Professional 44 3.8 The Biometric Access System Flow Chart 46
CHAPTER 4: RESULT AND ANALYSIS 47
4.1 Introduction 47
4.2 Flow Chart for VB Program 48 4.3 Flow Chart for Analysis Data in MATLAB 49
4.4 The Samples Result 50
4.5 Analysis and Discussion 63
CHAPTER 5: CONCLUSION AND FUTURE WORK 69
5.1 Conclusion 69
A.30 Sample 2.15 84
A.31 Sample 3.1 85
A.32 Sample 3.2 85
A.33 Sample 3.3 85
A.34 Sample 3.4 86
A.35 Sample 3.5 86
A.36 Sample 3.6 86
A.37 Sample 3.7 87
A.38 Sample 3.8 87
A.39 Sample 3.9 87
A.40 Sample 3.10 88
A.41 Sample 3.11 88
A.42 Sample 3.12 88
A.43 Sample 3.13 89
A.44 Sample 3.14 89
LIST OF TABLE
3.1 Gantt chart for FYP I 29
3.2 Gantt chart for FYP II 30
3.3 List of Materials 39
LIST OF FIGURES
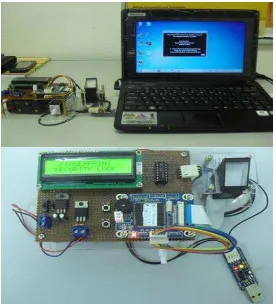
1.1 Hardware setup consists of an off-shelf-product (below) that was used to register a user, whose fingerprint data was saved in
a PC system. 2
2.1 The block-diagram of the proposed uni-biometric identification system based on minimum average correlation energy 11 2.2 Single minutia tracked throughout an 18-image impression sequence 13
2.3 Ridge Patterns 15
2.4 Block Diagram of Fingerprint Classification 16 2.5 Proposed Working of Fingerprint Classifier 17 2.6 Delaunay Triangulation on Fingerprint 18 2.7 Whole set of steps for representing a fingerprint 19 2.8 A Flow Chart of the Proposed Latent Fingerprint Segmentation
Algorithm 24
3.1 The Flow Chart of the Project 28
3.2 Shoes Leather Swine Skin 31
3.3 Shoes Leather Cow Skin 31
3.4 Life Swine Skin 32
3.5 Sample Size and Fingerprint Tester Size 32
3.6 Chop 33
3.7 Scanner 33
3.8 Stickers for Labeling 34
3.9 Sample Scan in Grayscale Image 34 3.10 Samples Label with Stickers 35
3.11 Sketch 1 36
3.12 Sketch 2 36
3.13 Solid Works 1 37
3.14 Solid Works 2 37
3.16 Box for BAS System 39
3.17 Acrylic Plate 40
3.18 Fabrication Process I 40
3.19 Fabrication Process II 41
3.20 Fabrication Complete 41
3.21 Project Diagram 42
3.22 Connection of BAS System to Computer 43 3.23 The Biometric Access System 43
3.24 Welcome Window 44
3.25 The Prompt Window for Connection of BAS System to Computer 45 3.26 Connection using USB to USRT Converter 45 3.27 Flow Chart for Biometric Access System 46
4.1 Flow Chart for VB Program 48 4.2 Flow Chart for Analysis Data in MATLAB 49 4.3 Example of Swine Skin Leather in Matrix 63
4.4 Graph of Sample 1.6 64
4.5 Example of Cow Skin Leather in Matrix 65
4.6 Graph of Sample 2.5 66
4.7 Example of Life Swine Skin in Matrix 67
CHAPTER 1
INTRODUCTION
1.1 INTRODUCTION
The usage of physiological or behavioral characteristics to identify the claimed identity of an individual defines biometrics. The examples of biometrics characteristics are face, hand vein, fingerprint, hand geometry, palm print and retina (Jain, Bolle, & Pankanti, 2005).
Figure 1: Hardware setup consists of an off-shelf-product (below) that was used to register a user, whose fingerprint data was saved in a PC system
1.2 PROBLEM STATEMENT
equipment detection to prevent the non halal leather product from exporting to Muslim country.
The aspiration is to recognize the unlawful animal skin that is found on leather products. This is to answer the requirement of religion beliefs. For example, Islam prohibits a Muslim to use swine skin for any applications. Using the BAS and additional tools, this project will propose characterization techniques that will define swine skin. Therefore, the niche of project will fall under the non Halal product theme.
1.3 OBJECTIVE
The objective of this project is to characterize swine skin presence on leather products.
1.4 SCOPE
This project will model the distinct characteristics found on swine skin and will propose generalized recognition algorithms. Therefore, the scopes of the project are:
i) Identification of the typical leather products made of swine skin; ii) Design of image capturing techniques and detection algorithms;
iii) Development of the image capturing techniques and the detection algorithms;
CHAPTER 2
LITERATURE REVIEWS
2.1 INTRODUCTION
2.2 FINGERPRINT LIVENESS DETECTION BASED ON QUALITY
MEASURES
A new fingerprint parameterization for liveness detection based on quality choices is presented as to comprehend that different sensors have different level of acquisition phases. Within the analysis and learnt vulnerabilities of finger print appreciation systems have led to an enhancement of the safety level offered by biometric systems (Galbally, Fierrez, Rodrigues-Gonzales, & Alonso-Fernandez, 2006). The liveness detection formulas are use to distinguish between real and false traits. It can broadly be divided into based methods and hardware-based methods. The software-based methods will be research to calculate the static and ever changing features for vitality detection by a new parameterization based on quality measurement in finger print liveness detection. Galbally, Fierrez, Rodrigues-Gonzales, & Alonso-Fernandez (2006) resolve the meaningful of parameterization will be properly reached to classified fingerprint real or false. Before than the category step, elect the absolute sensor that used in the acquisition and the final feature use as training data of the classifier the dataset. The finger print picture quality will be analyzed and assess by instrumented several choices which are ridge-strength choices which choices the energy concentration along the prevalent direction of ridges utilizing the intensity gradient, ridge-continuity choices which is computed as the average best difference of direction angle with the surrounding picture block and ridge-clarity choices which computed from the segmented foreground of gray level picture. The results consists of the category performance of each of the optimal subsets is computed on each of the datasets in terms of the Average category.
of the fingerprint is extracted from the unraveled 3D surface. Ridge depth is converted to gray level which contains the similar ridge information as in 2D inked fingerprint as well as other information like pores on the finger and height of ridges.
The NIST Fingerprint Image Software (NFIS) is a public domain source code distribution including several packages for fingerprint quality purpose system which are pattern classification system (PCASYS), minutiae detection system (MINDTCT) and fingerprint image quality system (NFIQ). Some quantitative measures will be developing for evaluating the performance of the presented 3D fingerprint scanning and processing. Statistical metrics including overall image quality, local image quality, minutiae quality, and classification confidence number and conventional 2D plain fingerprints with a Cogent CSD450 2D fingerprint scanner will be used to perform scanner evaluation. Both sets of data will compare by using NIST software. The 2D and 3D plain fingerprints will be processed and analysis with the three NIST components: PCASYS, MINDTCT and NFIQ. The results show that all the statistical metrics can be generated by the NIST software, for traditional 2D fingerprint quality evaluation and evaluate the quality of unraveled fingerprints obtained from the 3D scans. The scanner performance can be quantified by the scanned image quality. Higher quality of scans will lead to a superior performance of fingerprint recognition systems. 3D and 2D fingerprints almost have the same confidence number for best quality images. In conclusion, using the NIST software, new non-contact 3D approach provides the superior performance in terms of the number of high quality features. The future work will be proceed base on registration fingerprints with 2D and 3D images and improve the ridge depth precision of cameras and lens distortion correction (Wang, Hao, Fatehpuria, Hassebrook, & Lau, 2009).
2.4 BIOMETRIC SYSTEMS
pick up phase, the inherent biometric characteristics are displayed to the sensor. The signal processing module represents the core of the system is composed by sub modules implementing pre-processing functions (image filtering and enhancement), the feature extraction, and the matching between two features. The biometric systems used to store only a mathematical representation of the information extracted from the presented sample by the signal processing module that use to construct or compare against enrolment templates samples of the biometric feature. Then a transmission process is implemented to transmit the collected data to the signal processing section. During this transmission, some non desired effects are presented and would be taken into consideration. In particular, the channel effect is defined as the changes imposed upon the presented signal in the transduction and transmission process due to the sampling, noise, and frequency response characteristics of the sensor and transmission channel.
2.5 QUALITY ASSESSMENT OF BIOMETRIC SYSTEMS:
COMPREHENSIVE PERSPECTIVE BASED ON ACCURACY
AND PERFORMANCE MEASUREMENT
Accuracy of measurements evaluates the result of a measurement that applied the system on a standardized database. The accuracy is given by indexes evaluated using the concept of error. The second source of uncertainty need to be considers which may affect the overall accuracy. Here are the steps to compute the accuracy performance of the systems defining the proper indexes.
A. Step 1: Enrollment
The templates are computed and stored on disk. The presence of errors is monitored by using an index named REJENROLL, this phase is the rejection ratio due to fail,
timeout and algorithm crash processing situations.
B. Step 2: A General Matching Score Computation
For symmetric and asymmetric matching functions, each biometric template is matched against the biometric sample will stored in a matrix called genuine matching scores (GMS) and imposter matching scores (IMS). GMS refers to the matching that computed between samples of the same identity certified individually. IMS is the matching values of samples of different individuals. The result of GMS and IMS matrix values are compared and evaluated.
C. Step 3: Accuracy Indexes
receiving operating curve (ROC). The ROC is a graphical plot of the fraction of true positives versus the fraction of false positives for a binary classifier system as its discrimination threshold is varied. The second is the plot of FNMR versus FMR in a logarithmic chart, called the detection error trade off (DET) plot. The DET plot can be used to directly compare biometric systems. The purpose of these two plots is needed in order to directly compare biometric systems, the FNMR and FMR errors of the systems plotted in the DET plot must be evaluated on the same dataset. The equal error rate (EER) is need to be considered as it is computed as the point where FMR (t) = FNMR (t) and the score distributions often interpolated by the quantized data. (M. Gamassi, 2005)
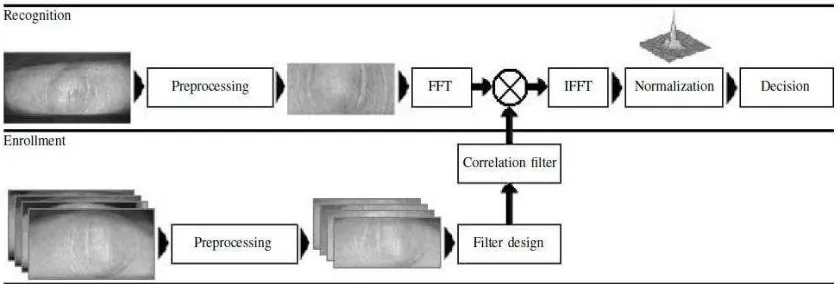
2.6 MULTIMODAL BIOMETRIC PERSON RECOGNITION
SYSTEM BASE ON FINGERPRINT & FINGER KNUCKLE
PRINT USING CORRELATION FILTER CLASSIFIER
domain via a discrete Fast Fourier Transform (FFT)) with the designed filter (enrollment) and the output correlation is subjected to an Inverse Fast Fourier transform (IFFT).
Figure 2.1: The block-diagram of the proposed uni-biometric identification system based on minimum average correlation energy. (Abdallah Meraoumia, 2012)
Matching Module (Correlation filtering)
a) MACE filter formulation (H = D−1X(X+D−1X)−1u)
To increase produces sharp peaks at the origin of the correlation plane. D is a diagonal matrix of size d × d, (d=no of pixels), X is matrix size, N is number of training images and + is complex conjugate (X = N x d). u is column vector of size N.
b) UMACE Filter Formulation (H = D−1X)
c) Matching process
For each class a single MACE (UMACE) filter is synthesized. Once the MACE (UMACE) filter H(u, v) has been determined, the input test image f(x, y) is cross correlated with it in the following manner:
c(x, y) = IFFT{FFT(f(x, y)) * H+(u, v)}
d) Similarity Measurement
Maximum peak size used to measure the similarity for image matching; the peak-to-sidelobe ratio (PSR) of parameter is used as a performance measure for the sharpness of the correlation peak.
In conclusion, FP and FKP are integrated in order to construct an efficient multi-biometric recognition system based on matching score level and image level fusion by minimize average correlation energy (MACE) and Unconstrained MACE (UMACE) filters in conjunction with two correlation plane performance measures, max peak value and peak-to-sidelobe ratio, to determine the effectiveness of this method. Final experimental results showed that the designed system achieves an excellent recognition rate and high resolution fingerprint database.
2.7 SEQUENTIAL FUSION OF DECISIONS FROM ADAPTIVE
AND RANDOM SAMPLES FOR CONTROLLED
VERIFICATION ERRORS