Faculty of Electrical Engineering
A THREE DIMENSIONAL (3D) VISION BASED DEFECT
INSPECTION SYSTEM FOR GLUING APPLICATION
Mohamad Haniff bin Harun
Msc. In Electrical Engineering
A THREE DIMENSIONAL (3D) VISION BASED DEFECT INSPECTION SYSTEM FOR GLUING APPLICATION
MOHAMAD HANIFF BIN HARUN
A thesis submitted in fulfilment of the requirements for the award of The degree of Master of Science in Electrical Engineering
Faculty of Electrical Engineering
UNIVERSITI TEKNIKAL MALAYSIA MELAKA
ii ABSTRACT
iii ABSTRAK
iv
DECLARATION
“I hereby declare that the content in this thesis is the result of my own work expect references and citations which I have clearly stated the source of origin”
Signature : ………
Name : MOHAMAD HANIFF BIN HARUN
v
DEDICATION
vi
ACKNOWLEDGEMENTS
I will like to express my gratitude to Universiti Teknikal Malaysia Melaka (UTeM) for giving me the opportunities and fully sponsored through Zamalah Scholarship to pursue my Master in Electrical Engineering.
I will like to express my profound gratitude to Engr. Prof. Dr. Marizan bin Sulaiman for his supervision, encouragement, suggestions and trusted throughout the duration of this research. A special thanks to Mr. Hairol Nizam Mohd Shah and Mr. Lim Wee Teck for their support in my research.
Also I would like to express my big thanks to all my colleagues for their support and time during my research study namely Ms. Jurifa, Mr. Hisham, Mr. Al-Hafiz, Mr. Hafiz, Mr. Bazli, Miss. Raihana, Ms. Miza, Miss. Jue, Miss. Zuraidah, Miss. Huda, Ms. Fizatul, Ms. Nuraziln, Miss. Niza, and Miss. Epah. I would like to thank to supportive technician Mr. Fauzi, Mr. Alif, Mr. Rahim, Mr. Omar and Mr. Fadhil for supporting in my research material.
viii
1.3.3 3D Recognition (Camera Placement) ... 15
1.4 Objectives of Research ... 16
1.5 Contributions of Research ... 17
1.6 Scope of Research ... 17
CHAPTER 2 (THEORETICAL BACKGROUND) ... 19
2.0 Introduction ... 19
2.1 Vision Based Algorithm ... 19
2.1.1 Theory of Shape Based Matching Application... 20
2.1.1.1 Gray-scale Transformation ... 24
2.1.2 3D Recognition Object based on 2D Images ... 36
2.2 Robot Vision System ... 38
CHAPTER 3 (SYSTEM DESIGN AND DEVELOPMENT) ... 43
3.0 Introduction ... 43
3.1 Computer Vision Development ... 43
3.1.1 CCD Camera (Samsung SDC-410N) ... 43
ix
3.2.3 Converting Robot Coordinate to Robot Coordinate ... 66
3.2.4 Defect Inspection Monitoring Application ... 69
CHAPTER 4 (DEVELOPMENT OF ROBOT VISION) ... 89
4.0 Introduction ... 89
4.1 Development of Robot Vision ... 89
4.1.1 Katana 6M Arm Robot ... 89
4.1.2 KUKA KR5 sixx R650 Robot Arm ... 90
4.1.3 Overall System ... 91
4.2 Hardware Development and Experimental Works ... 94
4.2.1 Experiment 1 (2D Matching) ... 98
4.2.2 Experiment 2 (Classification of Types of Defect) ... 100
x
4.3 Experimental Results ... 104
4.3.1 2D Matching ... 104
4.3.2 Classification of Types of Defect ... 105
4.3.3 Correction of Defects... 107
4.4 Discussion of Results ... 109
4.4.1 Constraint in Template Creation ... 110
4.4.2 Constraint in Camera Placement ... 113
4.4.3 Constraint in Workspace Area Size ... 114
4.4.4 Constraint in Katana Arm Robot ... 115
4.4.5 Advantages of Proposed Vision Algorithm ... 115
4.5 Comparison of Results ... 116
Appendix A - GUI User Guide ... 135
xi
Appendix C1 – Software Guide (HALCON) ... 173
Appendix C2 – Software Guide (Visual Basic 6.0) ... 175
Appendix D - Hardware Specifications ... 186
Appendix E – List of Publication ... 191
xii
LIST OF FIGURES
Figure 1.1: Time Evolution of the Robotics Research towards Service Robots (Garcia et
al., 2007) ... 3
Figure 1.2: World Robot Population (MITI, 2006) ... 5
Figure 1.3: Basic Process of Shape-Based Matching using HALCON (Xu et al., 2008a) ... 9
Figure 2.1: Enlarge Pixel from Resolution of LCD Monitor ... 21
Figure 2.2: Example Image of Three Simple Shapes ... 22
Figure 2.3: Image being divided by 10x8 Pixels Division ... 22
Figure 2.4: Image Rearranged into Digital Pixels ... 23
Figure 2.5: Gray Value Representation of Image ... 23
Figure 2.6: Process of Gray Scale Transformation... 24
Figure 2.7: Histogram of Example Images ... 26
Figure 2.8: Threshold Results for Example Images using Threshold Value of 50 ... 27
Figure 2.9: Threshold Results for Example Images using Threshold Value of 200 ... 28
Figure 2.10: Region of Interest Before and After Process ... 29
Figure 2.11: Median Filter Application ... 30
Figure 2.12: Median Filter Example Calculation for 1-Dimensional Data ... 31
Figure 2.13: Harris Point Application (Schmid et al., 2000) ... 33
xiii
Figure 2.15: Template Matching Process Evaluation ... 35
Figure 2.16: Placement of two Camera of 3D Recognition (Takahashi et al., 2006) ... 36
Figure 2.17: Proposed of two Camera Placement in 3D Recognition ... 37
Figure 2.18: Workspace of KUKA Robot Arm ... 39
Figure 2.19: Framework for KUKA KR5 sixx R650 ... 39
Figure 2.20: Workspace of Katana 6M Robot Arm ... 41
Figure 2.21: Framework for Katana 6M ... 41
Figure 3.1: Suggested Algorithm for Matching Object ... 47
Figure 3.2: (a) Original Image; (b) Image Model Template... 48
Figure 3.3: Result from HCD Process ... 49
Figure 3.4: Results of Combination HCD Process with Equation of Straight Line ... 50
Figure 3.5: Flow Chart of Defect Shape Matching (DSM) ... 51
Figure 3.6: Proposed of two Camera Placement in 3D Recognition ... 52
Figure 3.7: (a) Captured Image from Top Camera and (b) Captured Image from Front Camera ... 53
Figure 3.8: A New Point Appointed from Top and Front Camera ... 54
Figure 3.9: The Proposed of two Camera Placements in 3D Recognition ... 55
Figure 3.10: Integration of two Image Source in Finding New z-coordinate... 57
Figure 3.11: Information Gathered from two Source Images in Generate 3D Image from 2D Image ... 58
Figure 3.12: Flow Chart of Defect Shape Pointing (DSP) ... 59
Figure 3.13: Sample Calculation in Solving New Point in Line 1 (top camera) ... 60
Figure 3.14: Result for New Generated Point (top camera) ... 63
xiv
Figure 3.16: Result for New Generated Point (front camera) ... 64
Figure 3.17: Result of Image in x, y and z Data ... 66
Figure 3.18: Suggested Algorithm for Defect Inspection System ... 70
Figure 3.19: Template Using in Defect Inspection ... 71
Figure 3.20: Flow Chart of Defect Inspection Monitoring (DIM) and Correction of Defect (CoD) ... 73
Figure 3.21: Pointing Result from Table 3.2 (No Lighting) ... 78
Figure 3.22: Results of Image with Pointing Result in x, y and z Coordinates ... 79
Figure 3.23: Combination Data from Top and Front Camera ... 80
Figure 3.24: Results of Defect Inspection Monitoring (DIM)... 82
Figure 3.25: Curve Pyramid with 300 Circular Angle ... 85
Figure 3.26: Calculation for Arc Length of Contours ... 87
Figure 4.1: Katana 6M Robot Arm ... 90
Figure 4.2: KUKA KR5 sixx R650 Robot Arm ... 91
Figure 4.3: Overall System Design... 92
Figure 4.4: System Overview ... 93
Figure 4.5: Experimental Setup ... 95
Figure 4.6: Object Pyramid Developed using Plain Cardboard ... 98
Figure 4.7: 2D Matching Experimental Setup ... 99
Figure 4.8: Template Creation for Defect Model ... 100
Figure 4.9: Classification of Defect's Types Experimental Setup ... 101
Figure 4.10: Gap Defect Characteristic ... 102
xv
Figure 4.12: Correction of Defect Experimental Setup ... 104
Figure 4.13: Result for Defect Inspection Monitoring (DIM) ... 107
Figure 4.14: Graph Result of Correction of Defect (CoD) ... 109
Figure 4.15: Pyramid Shape and its Corresponding Template ... 111
Figure 4.16: Defect Gap and its Corresponding Template ... 111
Figure 4.17: Bumper Defect and its Corresponding Template ... 111
Figure 4.18: Poor Template for Image Pyramid ... 112
Figure 4.19: Good Placement of Required Features in Workspace ... 114
Figure 4.20: Required Features are Out of Workspace Area ... 115
Figure 4.21: Calculation for Real Pyramid Object ... 121
xvi
LIST OF TABLE
Table 2.1: Histogram Table of Example Images ... 26
Table 2.2: Link parameter for 6-DOF KUKA Arm Robot ... 40
Table 2.3: Link parameter for 5-DOF Katana Arm Robot ... 42
Table 3.1: Information Gathers from HCD Process ... 60
Table 3.2: Information Gathers from both Processes ... 65
Table 3.3: Data Recorded from Pixel and Robot Coordinate ... 67
Table 3.4: Experiment 1; Webcam Position = 60 cm (from base) ... 75
Table 3.5: Experiment 2; Webcam Position = 40 cm (from base) ... 76
Table 3.6: Experiment 3; Webcam Position = 80 cm (from base) ... 76
Table 3.7: Results for 15 Tested Images in DIM ... 83
Table 3.8: Description on Circular Motion of KUKA Arm Robot ... 86
Table 4.1: Hardware Description and their Tasks ... 96
Table 4.2: Defect Shape Matching (DSM) for 50 Tested Images ... 105
Table 4.3: Result for Defect Inspection Monitoring (DIM) for 50 Tested Images ... 106
Table 4.4: Result of Correction of Defect (CoD) for 15 Tested Images ... 108
Table 4.5: Comparison between Good and Poor Template Image ... 112
Table 4.6: The Results of Defect Detection ... 117
xvii
xviii
LIST OF SYMBOLS AND ABBREVIATIONS
SBM = Shape-Based Matching
ROI = Region of Interest
GDP = Gross Domestic Product
IMP3 = Third Industrial Master Plan HALCON = Machine Vision Software
3D = Three Dimensional
GUI = Graphical User Interface
RGB = Red Green Blue
DIM = Defect Inspection Monitoring CoD = Correction of Defect
1 CHAPTER 1
INTRODUCTION
1.0 Introduction
Automotive industry is a symbol of technical marvel by human kind. Being one of the fastest growing sectors in the world its dynamic growth phases are defined by nature of competition, product life circle and consumer demand. Today, the global automotive industry is concerned with consumer demands for styling, safety, and comfort. The industry is at the crossroads with global mergers and relocation of production centers to emerging developing economies. Due to its deep forward and backward linkages with several key segments of the economy, the automobile industry is having a strong multiplier effect on the growth of a country and hence is capable of being a driver of economic growth (Nag et al., 2007).
2
By introducing new automation system for the gluing process, it will helps in rebuilding new technology in the production to increase quality and performance of the car. It also reduces cost in hiring a person to assist the robot if there is an error occurred during the process. Automated inspection is desirable because human inspectors are not always consistent in their product assessments and automated vision inspection systems achieve superior performance in terms of processing speed and detection accuracy.
1.1 Background
3
Industrial robots, a combination of arm and hand, can advantageously be deployed in the manufacturing industry to automate many processes. Obviously, automation using robot shifts the use of human labour from direct interaction with a process to various indirect interactions. These indirect interactions include process monitoring, process diagnostic, equipment setting, equipment programming, the development of automation solutions and etc.
1.1.1 Industrial Robot
The wide use of robots in the automation industry will certainly have positive impact in five important aspects (Edler and Ribakova, 1994); productivity, flexibility, quality of products, quality of human life and scientific discipline. By implementing machine vision will provide more reliable robot vision application in automation industry. Machine vision system plays a vital role in manufacturing application, quality inspection and process monitoring as well. Inspection system is one of the famous processes that installed in industrial automation function to classify that the product is in better shape and
4
quality. There are many researchers invest in inspection system such as ‘Car-body Inspection System Using Industrial Robot’ by (Kang et al., 1992), ‘Semi-Automatic Pipeline Inspection Robot Systems’ proposed by (Jae Yeon et al., 2006), ‘A New Inspection Robot System for Storage Tank’ introduced by (Hua et al., 2008) and ‘A Novel Robot System for Surface Inspection’ developed by (Xu et al., 2008b) that highly improves in maintaining the quality of products produce batch by batch. The integration of vision sensor (CCD camera) in industrial robot mostly improves the system to be compatible with changes in system environment. It’s also simple to modify the system according to the
needs of system requirements.
1.1.2 Motivation of Research
Since the Industrial Revolution, many production technologies had been introduced and evolved to improve the production efficiency and reducing the production cost. Industrial automation is one of the widely used strategies by the manufacturers to improve their competitiveness, in terms of quality and operating cost. The concept of industrial automation is widely used by manufacturers in automobile, electronic and electrical, chemical and steel industries, for a better plan efficiency or a lower unit cost of production. For better performance of the system, integrating industrial robot with machine vision will helps in increasing production in terms of quality and quantity.
The motivation is to implement robot vision in developing inspection and correction system for gluing process of windscreen car. This is important to increase the quality of the product produce in the system. The use of industrial robot in industrial application was increasing every year in line with the MITI’s objectives in developing high
5
sector in Malaysia, industrial robot known as a backbone of Malaysian industries. Figure 1.2 shows the statistical of robotic used until 2008.
Industrial robot is not has greater influential as service robot in world robot population because its limitation to do the specific task. But in industrial application, it gives high impacts to industrial sector in improving the quality of product along with the increasing of production produces because of the system flexibility. This shows that future of industrial robot was unpredicted and surely gives benefits to the world.
1.2 Problem Statement
Automation is the use of control system and information technologies to reduce the needs for human work in the production of goods and services. In the scope of industrialization, automation is the step beyond mechanization. Whereas mechanization provided human operators with machinery to assist them with the muscular requirement of work, automation greatly decreases the need for human sensory and mental requirements
6
as well. In automobile industry, mostly every parts of the car are assembled directly using industrial robot as human need to be the second eye for the robot. However, the inspection of windscreen car gluing process still using human eye to classified the gluing quality. Not only that, the correction for defects done manually by human labor in ensuring the product can be reproduced as a quality product. This will effect to the quality of product as well as time consuming in achieving target of each product. Human also has a limitation on noise emission and undesired lift forces that causes of aerodynamic instability.
1.3 Literature Review
In this section, the literatures are differentiated from two points of view. One is on the vision system and another is on the industrial applications, which focus mainly on installing car windscreen in automation industry.
1.3.1 Machine Vision
First and foremost, the first literature review was entitled as “Intelligent Shape
7
objects under less constraint situations. They investigated on intelligent integration of different shape representation schemes and generation of the best shape recognition strategy using global shape properties. The proposed scheme effectively incorporates model-driven top-down and bottom-up approaches of shape analysis. By analyzing global shape properties, the essential features and their degrees of importance are determined quickly. In the representation phase, objects are described by using these essential features, in recognition phase, searching for the best candidate is restricted to the models represented by these features and the observed shape is matched to the candidate’s model
in the order of importance of the essential features. Systems are being developed for two and three dimensional shape separately since they are exploiting different visual data photometric and range, respectively.
This two literature reviews gives a lot of idea in implementation Region of Interest in this research. They entitled as “Flexible approach for Region of Interest Creation for Shape-Based Matching in Vision System” by (Teck et al., 2009) and “Implementation of Shape-Based Matching Vision System in Flexible Manufacturing System” by (Teck et al., 2010) that helps a lot in this research. The creation of Flexible Region of Interest (ROI) provides better application that extracts the main features of the image that using as Model Template. Most important thing, the data extraction through this creates a unique data for each model defects that easily to identify defects in matching application. The better creation of ROI gives better processing time in this system.
8
template matching act as a tool to provide a powerful solution in recognizing object from its model. First, before matching process takes place, the object must be specified and created object as a model in training phase. Then, the model being used in order to find and localized an object including optimizing the outcome of the matching by minimizing the search space of the object. This unique algorithm helps in handling the changes in illumination, clutter, various in size of object, and also affect in position and rotation of the object. Not only that, this algorithm may affect the relative movement of parts of the template.
9
1. Acquire Image – Base images that will be used as the reference image is obtain. 2. Pre-processing – Pre-processing is needed to modify the image so that the further
process can be simplified for acquiring a better solution in time consuming. Common pre-processing includes image filter and also image enhancement.
3. Determine Training Parameters – The essential parameters required are identified and created as a unique parameter for identifying certain image.
4. Train Model – The model are created based on the parameter develop in step 3, the speed of the process can be improved by creating Region of Interest (ROI) and also using image pyramid level. ROI create a region where as only focus on the main of interest needs to create an image as a model.
5. Apply Matching – The Test image is the applied for shape matching process. 6. Results – The results can be shown in sentences or images according to
requirement.
10
7. Destroy Model – The test image is deleted or is overwritten after the results have been obtained. This is important in reducing memory usage.
Region is one of the basic frameworks in determining object recognition. As proposed by (Gu et al., 2009) in “Recognition using Regions” stated that each region created, it represents by a rich set of image cues (shape, colour and texture) that accounts as a major target in image processing for recognition object. In this paper, the objective is to provide a region database of image by introducing Generalized Hough transform in detection and segmentation to generate hypothesis of object locations, scales and support, followed by verification classifier. This approach building on a novel region segmentation algorithm which produces robust overlaid regions. By proposed this approach shown that by creating a specific region able to recognize object robustly but proper region creation must be applied. As a result, there are two conclusions obtained 1) cue combination significantly boosts recognition performance; 2) region-based voting scheme reduces the number of candidate bounding boxes by orders of magnitude over standard sliding window scheme due to robust estimation of object scales from region matching.
1.3.2 Defect Inspection System
11
kind of defects. The algorithm is tested with 500 welding defect consists of all six type of defect to evaluate the defect detection capabilities. The results of this experiments represents defect detection of each defect’s type but overall this system able to generate 94.3% success rate in classifying defect’s type. 6 Types of defects are identified through
this research:
1. Air Hole – Usually are black, round and smooth in boundary and their locations and sizes are uncertain.
2. Crack – Cracks are black, in slightness and needle shape at least at one end, and usually parallel or vertical with welding lines.
3. Strip Inclusion – Strip inclusion are black, in strip and complex in boundary. 4. Round Inclusion – Round inclusion are black, round and complex in boundary. 5. Lack of Penetration – They are black, linear, and straight in both sides.
6. Metal Inclusion – They are bright in defects in the welding line images and their locations, forms and directions are uncertain.
12
Nowadays, there is too many techniques involved in applying inspection system in surface. According to research entitled as ‘A Review of Recent Advances in Surface
Detection using Texture analysis Techniques’ (Xie, 2008) described all the techniques used and its defect application in surface. The surface defects are loosely separated into two types; first is local irregularities which are the main concern for most visual surface inspection and the other is global deviation of colour and texture. The techniques being discussed in this paper used to inspect textured abnormalities are break to four categories, structural approaches, model based approaches, statistical approaches and filter based method. Every method has its own benefits and disadvantages. The most important thing in providing better services is to understand the formation and nature of the defects. It is important to be able to accurately localise the defective regions rather than classifying the surface as a whole. This can provide possibilities of classifying the defects and further studies of the characteristics of the defects.
In developing an automatic detection, there are a lot of filtering techniques available to that. One of that is Texture Features. Title research of ‘Automatic Detection of
13
of the difference entropy and the mean of the difference variance, for a distance o d = 3. On the other hand, the best Gabor features are at p = 6 (scale).
Other researchers are using optimised filter in classified texture defect. As shown in paper of ‘Optimised Filters for Texture Defect Detection’ founded by (Sobral, 2005) present a new approach to texture defect detection based on a set of optimised filter. The main purposed in introducing this method because it is applied to one wavelet sub-band and its size and shape are tuned for a defect type. The wavelet transform provide an excellent framework to deal with multi-scale defects. The first level of the wavelet packet decomposition divides the power spectrum into four square parts and the second level divides the same spectrum into sixteen parts and the third level in sixty four parts. Therefore the filter applied in higher wavelet those results in easier to detect defect by analysing only a small part of the spectrum. The result showed that this masks capable to detect most of the defect and achieved an acceptable detection rate.
Inspection system are not just specific to welding and surface, texture of materials also one of the important subject in using defect inspection system. Textured material can be classified as textile, web, paper and wood. One of the researchers done ‘Defect Detection in Textured Materials Using Gabor Filters’ by (Kumar and Pang, 2002)
14
In textile industry, there are so many problems involving defect inspection. Many fabric defects are very small and undistinguishable, which make the very difficult to detect. According to (Chan and Pang, 2000) entitled as ‘Fabric Defect Detection by Fourier Series Analysis’ by implementing Fourier series analysis to monitor the spatial frequency spectrum of a fabric. If defect occurs in fabric, the regular structure of fabric changed so that the corresponding intensity at some specific positions of the frequency structure would change. In this paper, the researchers classify defect as four classes: 1) double yarn; 2) missing yarn; 3) webs or broken fabric; and 4) yarn densities variation. Central spatial frequency spectrum approach is proposed that would reduce computational time for defect detection and provide more parameters for defect classification. According to the results, the method proposed is able to extract seven significant parameters that capable for classifying defects in fabric.
15 1.3.3 3D Recognition (Camera Placement)
3D recognition system is one of the famous applications that being develops that able to reconstruct the object structure architecturally through the images from several cameras with different orientation and position. According to (Takahashi et al., 2006), the two main point should be considered as important that may cause performance degradation in determining the 3D recognition of object; 1) quality degradation of input images depending on capturing device and conditions; 2) capturing viewpoint not suitable for distinguishing the object. By using two cameras that placed according to the suitable orientation and position calculate using the evaluation function based on universal eigenspace that captured main architecturally of the object. The effectiveness of this method shows a great increment in recognition rate almost 50% from the previous method in low resolution of image tested in the research.
16
3D recognition system acts as the backbone of the inspection system where it provides various data in x, y and z coordinates. The position and rotation depends to the requirement of the system that fits to their task but the mathematical approach need to be specified equally to the camera placement. This will help to generate new equation in findings x, y and z coordinates. Several of 3D inspection system applied in industry as described by using multiple cameras with different position and angle according to the task requirement. It seems as a great vision sensor where the entire object can be analyzed throughout the system.
1.4 Objectives of Research
The objective of this research is mainly focus to develop a vision based system that can be used in manufacturing such as control and inspection, especially the installation of car windscreen by using gluing application and identify the defects in the process using vision as its feedback and control method. Additionally, the algorithm of the system must also be able to accommodate changes quickly.
1. To analyze, develop and implement the robot vision system for automation glue processes by using Shape-Based Matching application.
2. To design suitable application of two camera application for 3D inspection in order to locate position (x, y and z coordinate) of each defect occurred.
17 1.5 Contributions of Research
The contributions in this research are mainly to increase flexibility and adaptability of the vision system in order to accommodate changes. A different point of view was exploited especially in automobile industry for windscreen car gluing process.
1. Capabilities of user define ROI creations replacing standard dedicated feature extraction methods that is unique as every solutions is different based on the problems and requirements that are needed specifically.
2. Capabilities of 3D vision inspection using 2D inspection method by just manipulating camera placement, inspection of multiple dimensions are also possible by adding more cameras at different viewing angle.
3. The implementation of inspection system that consume to detect whether the object gluing perfectly or error occurred in gluing line with providing additional data including x, y and z coordinates for gluing process.
4. Correction of defect application (consists of two application 1st CoD and 2nd CoD) provides a service to alter the uncertainties occurred during inspection system to ensure reject products still can be produced as a quality product.
5. The implementation of this vision system using Graphical User Interface allows everyone to be able to use it even without immense knowledge of the vision background.
1.6 Scope of Research
18
1. The vision system will focusing on recognizing 3D objects by using multi-camera application.
2. The vision system is applied to a control environment, the lighting conditions are assumed constant during the recognizing and identifying defects phase.
3. The GUI will be designed using Visual Basic 6.0 as medium to supervise all process in this research.
19 CHAPTER 2
THEORETICAL BACKGROUND
2.0 Introduction
This chapter will discuss mainly on the theory and current development in Vision System and Industrial Robot Application. This chapter is divided into two parts, one for Vision System and the other is for Industrial Robot Application.
2.1 Vision Based Algorithm
To achieve fully flexible automated system, one of the supporting systems is machine vision, which will be discussed in detail in this chapter; the other two is Process Automation and Transportation System. Machine Vision is the application of computer vision to industry and manufacturing sectors, mainly focused on machine based image processing. It is also the study of methods and techniques whereby artificial vision system can be constructed and usefully employed in practical applications (Davies, 2005).
When comparing traditional inspection or measurement gauge techniques to a vision based system, several advantages stand out (Rebner, 1985).
20
2. Standoff. The image sensor can be located several inches from the inspecting part, therefore reducing any interference between the part and the sensor, making the online inspection possible.
3. Speed. With the majority of vision based inspection systems employing solid state circuitry in both the camera sensor and supporting hardware, images can be quickly captured and measurements calculated within seconds or less. Also, image of objects in motion can be easily acquired and analyzed.
4. Multiple Features. Many features can be inspected almost simultaneously.
There is a wide range of different vision algorithm concept that each has its strengths and weaknesses. From all of these algorithms, shape-based matching using edge detection algorithm was chosen to be used in this research. This is because the requirement of this research is mainly on the inspection and recognition of constant and repetitive type of image. Additionally, because of the wide range of applications that might occurs, shape-based matching which takes only the outline edges of an object into considerations are the best fit for this research since everything has a shape.
2.1.1 Theory of Shape Based Matching Application
21
An image may be defined as a two-dimensional function, f(x, y), where x and y are spatial (plane) coordinates, and the amplitude of f at any pair of coordinates (x, y) is called the intensity or gray level of the image at that point. A gray scale digital image is an image in which the value of each pixel is a single sample, that is, it carries only intensity information. Images of this sort, also known as black-and-white, are composed exclusively of shades of gray, varying from black at the weakest intensity to white at the strongest.
When x, y and the amplitude values of f are all finite, discrete quantities, we call the image ‘digital image’. The field of digital image processing refers to processing digital
images by means of digital computer. Each of these elements f(x, y) is referred to as pixels. Figure 2.1 shows an image and it’s enlarging pixels. The enlarge image on the left hand side shows the pixel that are the basic cells that actually forms the entire images.
In order to simplify understanding of image pixel, a simple example is used to explain in detail how image pixel is created. Figure 2.2 shows the example image of three simple shapes in it, while Figure 2.3 shows the image segmented into a 12x8 pixels
22
division. The image is then rearranged into a digital image as shown in Figure 2.4 and converts into a 255 gray value representation as shown in Figure 2.5.
Figure 2.2: Example Image of Three Simple Shapes
23
Figure 2.4: Image Rearranged into Digital Pixels
24
As can be seen the higher the pixels quantity (e.g. 800x600 or 5 Mega Pixels) the better the image quality and also the more accurate the digital image representations of the actual images.
2.1.1.1 Gray-scale Transformation
Gray scale images store values for levels of brightness as opposed to colour information. A typical gray scale image is 256 shades of gray ranging from 0 (black) at the weakest intensity to 255 (white) at the strongest intensity. This method are given to transform the image from colour (RGB transformation) to gray scale (black and white) for simplifies the amount of information in the image. Although gray scale image contains less information than a colour image, the majority of important, feature related information is maintained, such as edges, blobs, regions, noise and so on. As shown in Figure 2.6, shows the process of gray scaling from original image to distinguish the RGB channel into gray scale.
25
The importance of gray-scale transformation is to reduce image information and characteristic to be extracted in the system. Colour image have plenty of information regarding on RGB transformation leads to the complex process in the system. In gray-scale, colour information being ignored and the system will focus on the object characteristic for easier processes.
2.1.1.2 Thresholding
Thresholding is an indispensable step in extracting pertinent information in image source. A gray-scale image often contains only two level of significant information: the foreground level constituting objects of interest and the background level against which the foreground is discriminated. A complete segmentation of an image, R is a finite set of others gray intensities present. Binarization can be accomplished by the choice of intensity, between the two histogram peaks, that is the threshold between all background intensities below and all foreground intensities above. The input image I1 is being transformed to an input binary segmented image I2, in the following way:
26
Where T is the threshold, for the object elements and stated for the background elements (Gonzalez, 2002). Successful threshold segmentation depends on the threshold selection.
By referring to Figure 2.2, its histogram is calculated in Table 2.1 and drawn as shown in Figure 2.7. From Figure 2.7, the x-axis represents the gray values range from 0 to 255 and the y-axis represents the numbers of pixels of the same gray value.
Table 2.1: Histogram Table of Example Images
Gray Value Pixels Quantity
0 71
60 8
150 9
210 8
27
From the histogram, the information can be used to extract the object from the background by selecting a threshold value, T that is suitable to separate the two different modes by using Equation (2.2). For instance, assuming that all three shapes were to be extracted from Figure 2.2, therefore the threshold value of 50 is selected. All pixels with gray value greater than 50 will then be converted into 1 and others will be converted into 0, the resultant result can be seen in Figure 2.8.
Similarly if threshold value were to be changed to 200, only pixels with gray value greater than 200 will be converted into 1 while all other pixels converted into 0. The result is shown in Figure 2.9.
28
A number of conditions like poor image contrast or spatial nonuniformities in background intensity can make difficult to resolve foreground and background. These cases require user interaction for specifying the desired object and its distinguishing intensity features.
2.1.1.3 Region of Interest (ROI)
The most critical step in applying machine learning is the identification of appropriate features known as Region of Interest (ROI). The raw data in each image basically consists of two attributes for each pixel: intensity and location (Wong and Bishop, 2006). This approach helps to make the data more amenable to machine learning how to draw the ROI based on human perception. Then the creation of ROI is to pick out the approximate region needed in the system by identifying the types of glue defects of the image. Once the approximate region is identified, the information needed must be separated with the model image and its background to ensure there is no other disturbances that might occur in the system.
29
According to Figure 2.10 shows that the left figure is source images used as template model defect in training phase describe in Chapter 3. In order to ensure the system is fully optimized, the approximate location of the desired image needs to be extracted, and then used for correction. This helps the system to differentiate between model and its background in contrast for limiting the space and required time consuming. Right figure of Figure 2.10 shows the resulting image of ROI where the system ignored the background of image and extract only space created through ROI. This algorithm creates a system to be more reliable for extracting using high quality images.
2.1.1.4 Median Filter
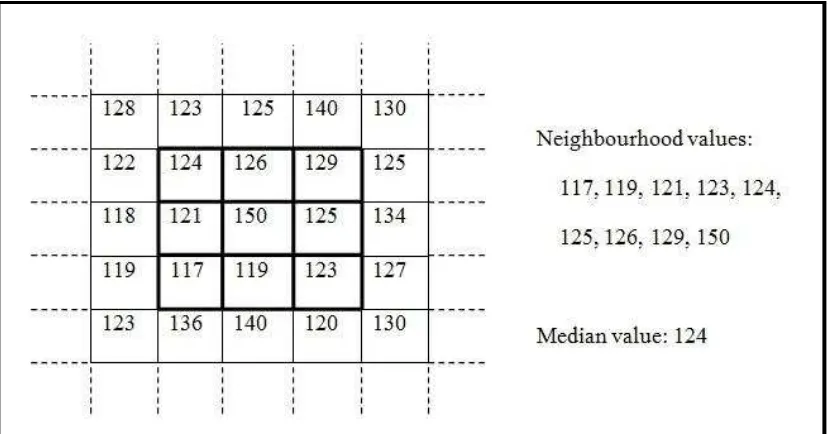
Median filter is one of the commonly used non-linear filters that replace the value of pixel by the median of the gray-level values of the neighbours of that original value of the pixel. The median is calculated by first sorting all the pixel values from the surrounding neighbourhood into numerical order and then replacing the pixel being considered with middle pixel value. This is given by (Zhang, 2009)
30
{ } (2.3) Where N (x, y) is the neighbourhood area (the filter mask) centered at (x, y). Figure 2.11 illustrates an example calculation.
The median, m, of a set of values satisfies such that half of the values in the set are less than or equal to m, while the rest are greater than or equal to m in order to perform median filtering at a point in an image, the values of the pixel and its neighbors should be sorted. Their median is the determined and assigned to that pixel. Median filter are particularly effective in the presence of impulse noise. It has the advantage of removing noise while keeping the original edges in the image. It can provide excellent noise-reduction capabilities, with considerably less blurriness than the linear smoothing filters of similar size. By removing noise, the image looks sharper in terms of edges and corners that will help mostly on this research. The following example shows the application of a median filter to a simple one dimensional signal. A window size of three is used, with one entry immediately preceding and following each entry.
31
For y [1] and y [10], extend the left most or right most value outside the boundaries of the image same as leaving left most or right most value unchanged after 1-D median. In Median filtering, the neighboring pixels are ranked according to the brightness (intensity) and the median value becomes the new value for the central pixels. It offers services in rejecting certain types of noise, in particular, “shot” or impulse noise in which some individuals pixels have extreme value. Median filters have its own specialties in terms of removing noise:
1. No reduction in contrast across steps, since output values available consists only of those present in the neighbourhood (no averages).
2. It does not shift boundaries, as can happen with conventional smoothing filters (a contrast dependent problem).
3. Since the median filter is less sensitive than the mean to extreme values (outliers), those extreme values are more effectively removed.
32 2.1.1.5 Harris Corner Detection
A corner can be defined as the intersection of two edges or point for which there are two dominant and different edge directions in a local neighborhood of the point. The Harris Corner Detector (HCD) also known as Harris Point is a popular interest point detector due to its strong invariance to (Schmid et al., 2000): rotation, scale, illumination variation and image noise. The Harris corner detector is based on the local auto-correlation function of a signal; where the local auto-correlation function measures the local changes of the signal considering the differential of the corner score with respect to the direction directly.
In this research, a fundamental of the corner point detection will be introduced. The Harris corner detection (Harris and Stephens, 1988) method avoids the explicit computation of the eigenvalues of the sum of squared differences matrix by solving the corner metric.
A corner is characterized by a large variation of M in all direction of the vector (x, y). By analyzing the eigenvalues of M, this characterization can be expressed in the following way:
1. If both ʎ1, ʎ2 are small, so that the local auto-correlation function is flat (little changes in R any direction), the windowed image region is of approximately constant intensity.
33
3. If both eigenvalues are high, so the local auto-correlation function is sharply peaked, then shifts in any direction will results in a significant increase; this indicates a corner.
In this research, each localization point occurs need to be classified by using the 3 conditions as state before. This is important for applying only a corner characteristic that will be used for indicating a critical point of object. Figure 2.14 shows the relation between the object with corner response map in determining the characteristic of each points occurred. Edge, flat and corner is represent using a simple example of square object (red square) combined with their corresponding region and range of determinant value as shown in corner response graph in Figure 2.14.
34 2.1.1.6 Template Matching
Template matching can be classified into two phases known as classification and recognition. Classification is concerned with establishing criteria that can be used to identify or distinguish different populations of objects that appear in images. Recognition is the process by which these tools are subsequently used to find a particular feature within and image. It functions at many different levels, including such different processes as finding a pyramid object in an image or matching the object to a specific type of object (Russ, 2007). Template matching is an algorithm that compares portions of images against one another. Before hand, the template of an object must be classified first before used it in recognize similar objects in source image (Jurie and Dhome, 2002).
35
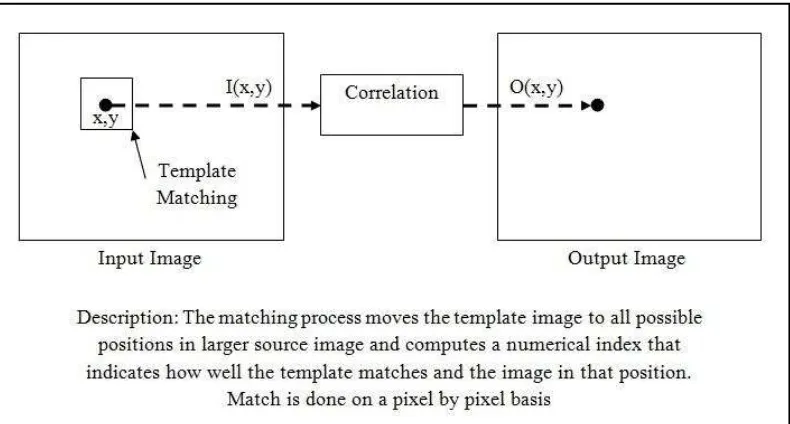
Figure 2.15 shows the process evaluation of the template matching by using correlation method in representing relationship between template and source images. Correlation is a measure of the degree to which two variables (pixel values in template and source images) agree, not necessary in actual value but in general behaviour. In correlation method, results of combination of differences between template gray level image, with average gray level in the template image, and difference between source image sections, with the average gray level of source image, ẏ are compared to the square root summation of the pixel differences between two images. Correlation value is between -1 and +1, with larger values representing a stronger relationship between the two images. Equation (2.4) shows the correlation relationship.
36
Correlation value totally depends on template creation throughout the system. Without proper contribution on it, may result to poor recognition rate. The important of ROI extraction method that delivers the precise region helps in findings the same object from various types of images.
2.1.2 3D Recognition Object based on 2D Images
Gluing process involves x, y and z-axis in determining the position according to the working space of the KUKA arm robot. Matching process involves one camera placed at the top of the object as a purpose in identifying the object that need to go for gluing process. Improvement of this system is created by applying another camera in front of the object for purpose in reviving the z-coordinate in the image. According to (Takahashi et al., 2006) the method used are to find the 3D object recognition defining as x, y and z-axis by using evaluation function in order to determine better position and orientation for camera placement. Figure 2.16 shows the proposed method by using two cameras from the researcher.
37
Referring to the Figure 2.16, this configuration has the ability to reproduce the 3D transformation according to the model template that being created in the system. The measurements of the camera takes account all the side of the object which will be process in determining the exact value of transformation with the original. From this application, the development of new proposed method by using two cameras with different positions and orientations in purpose of determining x, y and z-coordinate for further process in this research. The renovation of this new method being proposed is used in creating a z-coordinate according to the x and y-axis from images captured. Figure 2.17 shows the new proposed method developed in this research.
Requirement of the proposed method are to define coordinate x, y and z in order to get the clear view and information of the object for further process. First camera placed at the end of the KUKA arm robot to get clear view at the top of the image (more specific x and y-coordinate) and second camera at the front of the object for obtaining information about side of object (more correctly x and z-coordinate). Each image from both cameras is
38
differentiating through the x-coordinate by referring to the edge of the object. Both edges coordinate should exactly the same in order to define the z-coordinate through the front camera. The proposed methods describe on next chapter.
2.2 Robot Vision System
Flexibility is an increasingly high priority for many manufacturers, and the vision-guided robot has become an important asset to meet this demand. Robot Vision System (RVS) systems can enhance assembly, packaging, test and inspection processes, and they can perform in environments that are hazardous to human. Robots have been the forefront of flexible automation system for many years, but until recently robot vision still limited. Vision systems required a PC with a custom frame grabber to capture or “grab” images
from cameras, and custom software was needed to analyze the images. RVS for robot guidance provides the robot or handling system with information of where the component to be processed or moved is located spatially. This way, it is possible to automate handling, assembly and processing without having to precisely position and fix the components. This saves precious cycle time in production and reduces costs significantly
39
The D-H parameter for the KUKA is given in the Table 2.2 as the frame assignment is as shown in Figure 2.19. The associated interlink homogeneous transformation matrices are easily found from the D-H parameter values listed in Table 2.2. As the sixth link of this robot is also an end effecter, it is more efficient to numerically compute the forward kinematics function via a link-by-link iteration of the form.
Figure 2.18: Workspace of KUKA Robot Arm
40
Table 2.2: Link parameter for 6-DOF KUKA Arm Robot DOF
1 75 -90 335 θ1
2 270 0 0 θ2
3 90 90 0 θ3
4 0 -90 -295 θ4
5 0 90 206.1 θ5
6 0 180 -80 θ6
41
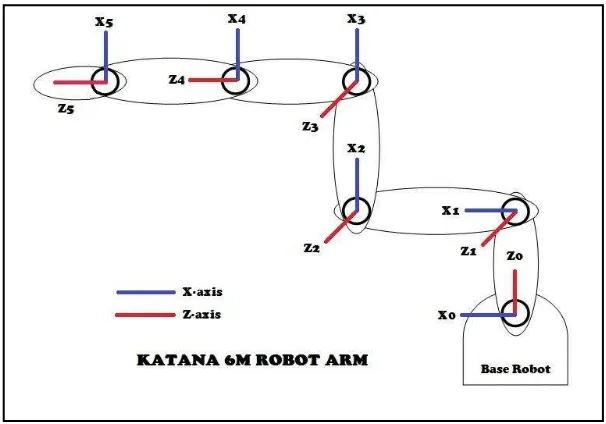
The D-H parameter for the Katana 6M are given in the Table 2.3 as the frame assignment is as shown in Figure 2.21. The associated interlink homogeneous transformation matrices are easily found from the D-H parameter values listed in Table 2.3. As the sixth link of this robot is also an end effecter, it is more efficient to numerically compute the forward kinematics function via a link-by-link iteration of the form.
Figure 2.20: Workspace of Katana 6M Robot Arm
42
Table 2.3: Link parameter for 5-DOF Katana Arm Robot DOF
1 0 -90 171 θ1
2 190 0 0 θ2
3 138 0 0 θ3
4 0 -90 0 θ4
43 CHAPTER 3
SYSTEM DESIGN AND DEVELOPMENT
3.0 Introduction
In this chapter, details of the complete development of the proposed system are discussed including machine vision, all the essential software, interface communication and also industrial robot application and the corresponding hardware. After that, the system is tested through a series of experiments to determine its efficiency; capabilities in providing complete system for gluing process
3.1 Computer Vision Development
Computer Vision Development consists of software development in building a system to assists human being in industrial application. HALCON and Visual Basic 6 software is used in this research as a compiler in building a better solution in solving inspection and correction system for gluing process by providing data and characteristics of each defect detected.
3.1.1 CCD Camera (Samsung SDC-410N)
44
four times faster than standard CCD sensor of the same resolution. This camera offers optimal resolutions of 1, 2 (4:3 and HDTV), and 4 megapixels, each in mono and colour. It provides more than 25 camera features, such as auto-gain and auto-exposure or the signal input debouncer, allow simple integration into many different application and system environments. The camera housing has a 58 mm x 52 mm footprint and provides screw holes for all five mounting positions. The industrial-proven aluminium body also includes screw holes for the safe locking of all cable connections. Samsung SDC-410N camera specifications are stated in Appendix D.
3.1.2 Software Description
45 3.1.2.1 HALCON Software
HALCON (GmbH, 2012), one of the image processing software provides an Integrated Development Environment (IDE) for machine vision which provides a comprehensive vision library based on the latest and most advanced technology with more than 1100 image processing operators, the software development is supported by the interactive tool HDevelop, which are used mainly for vision process manipulation. HDevelop is a highly interactive environment that enables to build image processing solutions fast and efficiently – even while acquiring images from a capture device. HDevelop consists of 4 main windows that required fulfilling the job in image processing:
1. Graphic Window – shows all the process required by displayed results of each process.
2. Variable Watch – provided the complete variable used in the system.
3. Program Window – shown the entire algorithm developed from this system. 4. Operator Window – to add, edit and display operator with all its parameter.
3.1.2.2 Visual Basic 6 Software
46
Matching (DSM) Application, 2) Defect Shape Pointing (DSP) Application and 3) Defect Inspection Monitoring (DIM) Application. This application is developed to show the respectful result to more convincing ways.
3.2 Development of Vision System
In this research, suggested vision system are developed into 4 phases which each of them have their own application and algorithm. This system developed according to the requirements and needs of the research according to the problem statement stated before.
3.2.1 Defect Shape Matching Application
47
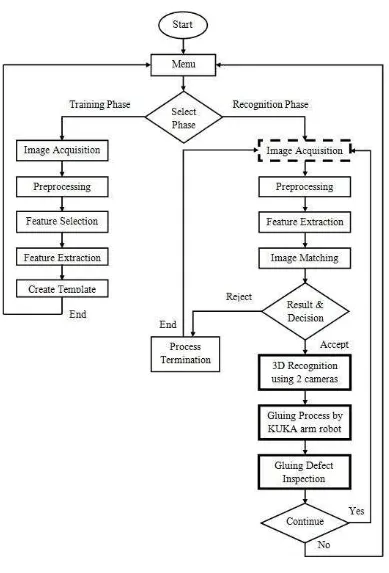
As shown in Figure 1.3, DSM is divided into two phases; 1) training phase and 2) recognition phase. The crucial part is in determining the best model template in training phase. From the original image, model template need to be extracted from its background by using Region of Interest (ROI) technique. This technique helps in reducing a large number of unused sizes occur by considering only the extracted region to meet the task requirement. Then, filtering method such as fill interlace technique is applied to improve the quality image of the template and remove noise which can greatly influence obtained recognition rate. Next process is to implement the median filter as effective method to remove noise occurs from the image in order to give a new life for the image look as more productive than before. The template created are then stored in the memory. As long as the template is in high quality, recognition rate for matching purposes definitely in high
48
percents. Figure 3.2 shows the transition step from original image until model template being created.
According to Figure 3.2, from original image turned into template image by applying all the method stated before to improve desired image for recognition purposes. The template is stored into the system memory for able to calling it each time of matching step is takes place. In recognition phase, template matching is used by comparing the template image with the process image pixels by pixels by referring to template image saved in the memory. The matching process moves the template image to all possible position in larger source image and computes a numerical index that indicates how well the template matches and the image in that position. The result of the template matching known as recognition rate which it depends on how much region its cover according to the template creation. DSM is robust to noise, clutter, occlusion, and arbitrary non-linear illumination changes. Objects are localized with sub-pixel accuracy in 2D.
(a) (b)
49
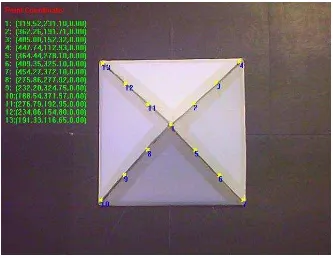
After results are obtained, the system decides whether to go further process or went back to previous process (recognition phase) are depends on the recognition rate of the process to ensure the correct batch are running at that time. According to Figure 3.5, matching fail means the system looping back to recognition phase and continue with another image object which means if there is other type of object included in the process, system can identified and continue again with the correct one. Matching success allow the system continue to Harris Corner Detector (HCD) process. HCD is a critical interest point detector due to its strong invariance to rotation, scale, illumination variation and image noise. This feature enables the system to locate the corner position of the image in order to gain data for generate other points based on mathematical equation of straight line (Sastry). Figure 3.3 shows the result for HCD process with additional data from x, y and z coordinates.
50
Result from Figure 3.3, shows that HCD process occurred in point 1, 2, 3, 4 and 5 where the system detects the entire possible corner appear on the image. In order to define the other points as shown in Figure 3.4, the additional of mathematics application is introduced in this system. Equation of straight line is applied to find the other point location between two points in the image. This application is introduced to provide additional data in defining the gluing line for further process in the system as shown in Figure 3.4.
According to the results obtained, the corner point and generated point stated in x and y-axis with no coordinates for z axis. In order to integrate system with arm robot, the generated coordinates information must consist x, y and z axis. Hence, the next process known as Defect Shape Pointing (DSP) provide with another installed camera that will be placed in front of the object to meet the requirement of robot vision system in acquiring the 3D information. In giving more illustration about DSM process, Figure 3.5 shows the step
51
by step process that will include from training phase until recognition phase and the next process occur after DSM process had been done.
52 3.2.2 Defect Shape Pointing Application
Defect Shape Pointing (DSP) application develop based on the information of 3D transformation (x, y and z coordinates) used in this research. In order to create application with all these information, development of application by using two cameras each of them placed at different angle and rotation (Takahashi et al., 2006). The proposed method as shown in Figure 3.6, introduced two cameras application where one of them placed at the top of object and the other placed in front of it. Based on this, the x, y and z coordinates can be generated by combining images capture from both cameras act as medium in determine z coordinate.
Camera placement has been developed according to the needs of the system requirement as described before. The arrangement helps in determining z-coordinate by applying two-dimensional image. The z-coordinate are based on combination of two pixel coordinate of 5.0 megapixels CCD camera placed as shown in Figure 3.6. In order to develop system that involve with 3D transformation all the x, y and z-coordinate must be
53
appointed which means the image should have length, width and height. In providing system with such information, Harris Corner Detector (HCD) process is introduced once again in determining the perfect location of object’s corner for both situations as shown in Figure 3.7. The transformation of z-coordinate in 3D involves of two images which are taken from both camera, top and front. The information of each corner is recorded to ensure the positioning of each corner is located perfectly. The information gathered will be used to generate additional point throughout the gluing line for better solution in gluing the object.
(a) (b)
Figure 3.7: (a) Captured Image from Top Camera and (b) Captured Image from Front Camera
54
the two points needed to be calculated and labelled as (xn-1, yn-1) and (xn, yn). Then, the points are applied it into the equation to define the slope of the line in pixels coordinate.
(3.1)
After that, value of the slope and point is used in the slope-intercept equation to define the intersection of the line. mn = ( yn - yn-1) / ( xn– xn-1)
(3.2)
Then, the distance in x-axis and y-axis between two points is calculated and defines it as k and l. The point will then be integrated into Equation (3.1) and Equation (3.2) to find new location of the point based on the information obtained. Lastly, new point being declared and classified as one of the point needed in the system. The pointing results of both images are shown in Figure 3.8.
(a) (b)
55
In applying glue application, the point of each coordinate must be accurate for precise operation. Therefore, the findings of this z- coordinate provide an additional data in order to minimize error of the system. In real operation, the shape of object is not exactly the same as the image taken. So, by providing a mathematical approach of straight line helps in rebuilding the z-coordinate based on their own image taken through the systems. In order to reconstruct 3D image from both 2D images, there are 3 steps to follow respectively with addition of sample calculation at the end of this sub chapter.
1. Determine position of camera.
In order to get the exact value from both images, the object captured must be adjusted for obtaining better position from both cameras. Every centimetre different will result to inaccurate size of image. For beginning, set the top and front camera as 50 cm from base. Let the top be constant at 50 cm and front as adjustable in acquiring exact value of x-coordinate for both as shown in Figure 3.9.
By adjusting the position of second camera step by step, then compare the coordinate determine through the system in order to identify a better position for
56
acquiring exact size of object from both images. The results determine should be able to synchronize with the x-coordinate where it’s as a backbone for completing the 3D image construction.
2. Comparing both images by using x-coordinate.
57
Measurement of the height (z-coordinate) of each point should be done by using mathematical approach which point 7 and 10 appointed as a reference point. All the data generated will be used as an additional data in doing glue process to ensure the systems work smoothly and efficient.
(3.3) Figure 3.10: Integration of two Image Source in Finding New
58 3. Combine features from both images.
The next step is to combine all data gathered from step 1 and 2 for constructing 3D image from 2D image. The height of each point appointed are being illustrated as shown in Figure 3.11 where the transformation of 3D image are developed. The transformation is based on the 2 reference image that used in determining the height of each point.
According to the Figure 3.11, the development of 3D image are based on x, y and z-plane where it’s consists of length, width and height. This application helps in rebuilding data of 3D image by using two cameras which have their own position and rotation that are important in classifying the 3D transformation. For top camera, image extracted gives information in x and y coordinates. As for front camera, image extracted must be synchronized in x coordinate from top camera to gain information of x and z coordinates. As a result, image constructed from both Figure 3.11: Information Gathered from two Source Images in Generate 3D Image
59
2D images able to 3D transformation. Hence, this method is proposed according to the needs of the system in this research. Figure 3.12 shows the flow chart of Defect Shape Pointing (DSP) process from image acquisition of both cameras until the 3D transformation data are obtained through it.
60
In this section, sample calculation will be added to give more details on determining the new point between the object gluing line. Also sample calculation in generate z coordinate of the object as useful information in gluing process.
1. Sample Calculation for New Point between Object Gluing Line
According to Figure 3.13, the generated point comes from Harris Corner Detector (HCD) process. This information is used to find new generated point in Line 1 as shown in figure. The information is recorded in Table 3.1.
Table 3.1: Information Gathers from HCD Process
Point X coordinate Y coordinate
1 447.74 112.93
2 191.33 116.65
3 319.52 231.10
4 188.54 371.57
5 454.27 372.10
61
Firstly, use data available at point 1 and 3 as information to generate new point between them in first object gluing line.
62
[ ]
[ ]
Data obtained are range between each point in x and y coordinates. This point will be used in determine second and third point in gluing line.
[ ( ) ]
[ ]
[ ]
[ ]
( )