DOI: 10.12928/TELKOMNIKA.v14i4.4012 1432
Audio Spike Detection on Gamelan using Envelope
Shape Pattern Analysis
Solekhan*1, Yoyon K Suprapto2, Wirawan3 1,2,3
Department of Electrical Engineering, Institut Teknologi Sepuluh Nopember, Surabaya, Indonesia 1Department of Electrical Engineering, Muria Kudus University, Kudus, Indonesia
*Corresponding author, e-mail: [email protected]
Abstract
Spike detection is important for the analysis of gamelan signal processing, in detecting the onset, transcription, and spikes occur on gamelan percussion instruments. Since the current methods: absolute value and NEO, could not detect spikes properly, we proposed to develop a new spike detection method. In this paper, the early stage of spike detection in gamelan music audio was the determination of the peak signal to obtain the form of a signal pattern (envelope like) which was then used as threshold for determining the spike locations. We also demonstrated the effectiveness of their method using shape pattern analysis to detect spikes.
Keywords: audio spike, threshold, envelope
Copyright © 2016 Universitas Ahmad Dahlan. All rights reserved.
1. Introduction
Indonesia is a nation with rich cultural diversity, including its traditional musical instruments. Gamelan which is a group of musical instruments played in Javanese orchestra is one example [1], consists of many instruments with specific functions. The uniqueness of gamelan is that it has different tone scale and the way to play it compared to that of the Western musical orchestra which is more popular. Therefore, a study in gamelan audio processing is more challenging than the Western one. A study of Gamelan recordings found, that some of its instruments produced spike’s signals, especially the percussion instruments that affected the onset detection. Onset detection is a method to identify a location or the onset in a musical audio signal [2-4], that is required in the analysis and further processing of audio signals (beat tracking, setting the tone, structure songs, chords, etc.). Saeed V. Vaseghi [5] showed, that gamelan spike noise pattern was similar to the symptoms of impulsive noise events, and the natural spike was similar to that of the transient noise. So, the references used for this research were those related to spike, impulsive and transient noises.
Some of spike detection algorithms based on the detection of changes in the energy of the signal, The algorithm is absolute value (AV) and nonlinear energy operators (NEO), or also called Teager Energy Operator (TEO). As stated in J. F. Kaiser [6], this algorithm was used for the detection of spikes [7-9]. The advantage of this method was that it could improve the spike location based on the increase of signal energy or amplitude, and relatively simpler to implement, in either digital or analog domain. Other spike detection algorithm was associated with the application of envelope detection [10], where the envelope was used to detect the presence of signal spikes. Some spike detection methods had been developed, including those that specifically utilize detection envelopes to determine the location [11]. Spike detection that is typically used to detect the presence of a spike in biomedical signals, in this study is also tested with NEO and AV detection methods. From testing the detection of audio gamelan using NEO and AV methods, spike detection results show too much but less accurate detection, so it is necessary to develop a spike detection for the gamelan audio.
2. Spike Detection
Spike detection is a proces to detect the location of the spike on a signal, Some spike detection methods such as by using absolute values method, using nonlinear energy operators (NEO) method and by using the envelope method.
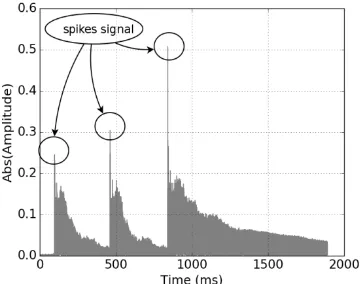
Figure 1. Spikes on gamelan signal marked with circles
Figure 2. An absolute signal of Figure 1 Spike marked with circles
Figure 1 represent the image from audio signal gamelan and Figure 2 is an absolute signal of Figure 1, from the visible image containing the spike, to detect the presence of the spike, spike location detection is carried out. The goal this research is to determine of the spike position time.
2.1. Spike Detection by using Absolute Value (AV)
The detection of this method is based on finding the absolute value of a signal [7]. To determine the spike existence, the presence of threshold is necessary, and only those that exceed the threshold will be considered as spikes.
��(�) =�1 |�(�)|>Thr
0 |�(�)|≤Thr� (1)
From equation (1) the value of the spike signal sp(m) will be equal to one, if the value of x(m) exceeded or greater than the threshold Thr and will be zero if the value does not exceed x(m) equal to or less than the threshold value. [10]
2.2. The Spike Detection using NEO
The detection of the Nonlinear Energy Operator (NEO) or Teager Energy Operators (TEO) method is based on the multiplication of the previous value with the following value minus its squared value [6][8][9]. In this method, the determination of the threshold is similar to that of the absolute value. It will be considered a spike only if its value exceeds the threshold.
����(�)=x2(�)− �(� −1)⋅ �(m+1) (2)
Equation (2) is a NEO equation. With xneo a symbol of Nonlinear Energy Operator signal, x is a symbol of the input signal, and the threshold obtained from the following equation,
��(�) =�1 ����(�) >�ℎ�
0 ����(�)≤ �ℎ�� (3)
2.3. Detection through Envelope Shape Pattern
Envelope-based detection method is a signal detection method which is based on the shape of the signal envelope. There are several method can be used to get the signal envelope, including one that uses squared low pass filtering (LPF), and the Hilbert transform.
Signal envelope is equivalent to a signal envelope outline, and an envelope detector connects all the peaks in this signal. The envelope detection is widely used in the field of signal processing fields and communications.
This envelope detection method is applied by squaring the input signal and sends this signal through a low pass filter, in which the signal samples are lowered to reduce the sampling frequency. Down sampling can be done if the signal does not have a high frequency. Two additional operations must be performed to maintain the correct scaling. First, amplify the signal by a factor of two, only by keeping the bottom of the signal energy, the energy gain is adjusted to the original energy and takes the square root of the signal to reverse the distortion scale.
Envelope detection method is easy to implement and can be done with a low-order filter that minimizes the output location. Another envelope detection can be done through the analytic signal of the input using Hilbert transformation. An analytic signal is a complex signal, where the real part is the original signal and the imaginary part is the Hilbert-transform of the original signal.
2.3.1. Spikes Detection with Envelope
The method using envelope for the spike was introduced by Byunghwa Lee, Minsoo Hahn, Kwangki Kim, Jinsul Kim 2014 [10]. This method utilizes the envelope to detect the presence of signal spikes, by using Equation (4) and (5) below as a reference,
���(�) =��� �����(� −1),��(�)�� (4)
��(�) =�1 ���(�) >�ℎ�
0 ���(�)≤ �ℎ�� (5)
With λ as the envelope’s decay coefficient, the value of spike signal sp(m) will be equal
to one (1) if the value of the env(m) exceeded or greater than the threshold Thr and will be zero if the value does not exceed the env(m) equal to or less than the threshold value.
3. Proposed Method
In the application test, both the absolute value and the NEO methods for audio signal spike detection, were unable to detect spikes well. Based on this experience, we proposed to use the shape of the envelope pattern as the reference. This step aims to develop a spike detection algorithm based on the envelope shape.
There are many spike detection algorithms employed to determine the location of the spike. This research tried to design a detection technique which is expected to be integrated in the existing algorithms. This method is expected to generate a new algorithm for spike detection that is applicable to detect spikes and dynamic to the envelope signal pattern.
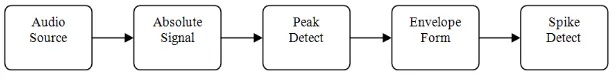
Figure 3.System Design
The word spline is adopted from the name of a flexible metal strip which is usually used to assist curved line drawing. Mathematically, spline is a numerical polynomial functions consists of polynomial function pieces (known as knots) [12]. Like polynomial interpolation, spline interpolation incurs a smaller error than linear interpolation and the interpolate is smoother. The Spline interpolation is easier to evaluate than the high-degree polynomials used in polynomial interpolation.
In numerical mathematical analysis, spline interpolation is a special form of polynomial slices which is practically called as a spline. Spline interpolation is usually more preferred than the original polynomial interpolation since the interpolation error can be minimized, even by using the low-degree polynomial [13].
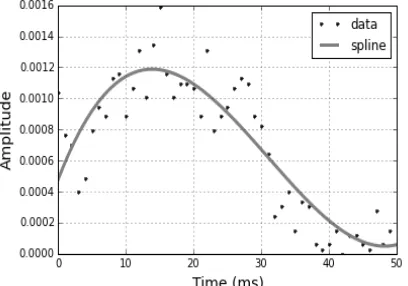
Figure 4. Spline illustrative examples of known data
Splines have a variety of forms including cubic spline, b-spline, T-spline, and smoothing spline, In this research using smoothing spline to find a pattern form of a signal. As shown on Figure 4, the spline can create a pattern of data with very nice and smooth.
��(�) =�1 �(�)− ���(�) >�ℎ�
0 �(�)− ���(�)≤ �ℎ�� (6)
The signal envelope pattern through result spline function, is then used as a threshold, to determine the spike, a test is performed using Equation (6) if the value of s(m)-env(m) is greater than the threshold. The previous research activities related to spike detection so far, were unable to answer the present needs. The existing spike detection algorithms were relatively static, so that in some circumstances are not applicable if the magnitude were not uniform, which, in turn might cause errors in detecting spike locations. This research tries to solve such problem in oder to solve such problem.
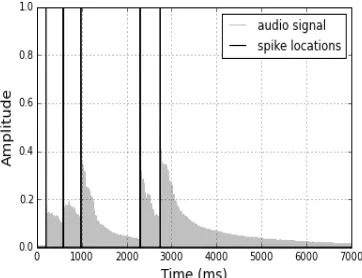
Gamelan audio recordings that contain spikes were taken from gamelan owned by the Electrical Department of ITS, and used as the signal source in this experiment. In the first step, the input was used for detecting the peak-signal which was then used to generate a spline pattern for obtaining the threshold to determine the spikes. This envelope pattern was then used as a threshold referring to equation (6), and with the obtained thresholds, the signal spikes could be determined as shown in Figure 5 and 6.
Figure 5. Envelope shape pattern of signal Figure 6. Spike locations
4. Experimental Results
As an experimental material, the tested audio recordings showed that it contained a lot of spikes, in this research to detect and determine the location of the spike. Gamelan audio recordings that contain spikes were taken from gamelan owned by the Electrical Department of ITS, and used as the signal source in this experiment. In the first step, the input was used for detecting the peak-signal which was then used to generate a spline pattern for obtaining the threshold to determine the spikes.
The AV and NEO methods, is excellent and easily implemented to detect the spikes in medical signals. To determine the performance of the method in detecting the audio signal spike in gamelan, conducted experiments to test with the audio gamelan music data.
In this test on Table 1, we used audio recordings of gamelan music that has 6 locations spike, with variations in threshold testing with 0.6, 0.4 and 0.2. The test results using these two methods as shown in Table 1, the first column to the method of absolute value, and second column for the method of NEO.
Table 1. Detect audio spike using Absolute value and NEO method
AV NEO Thr
2 at 1 locations 2 at 1 locations 0.6
31 at 2 locations 31 at 2 locations 0.4
3300 at 3 locations 3300 at 3 locations 0.2
The detections of both methods appear low at a high threshold (0.6). At the 0.4 threshold, detection increased to 33 spikes and the 0.2 threshold, detections increasingly redundantly, until 3300 spikes. From the spike detection testing in gamelan audio music, these methods perform poorly to be applied in the detection of spikes in gamelan music audio.
Table 2. Detect audio spike using envelope pattern
Part Signal Spike real Spike est.
I
S0 5 5
S1 3 3
S2 2 2
II
S4 10 10
S5 9 8
S6 28 27
Total spike 57 55
For number of real spikes are presented in the column three, while the number of estimated spikes are presented in the column four. From the experimental results showed in Table 2 (part I and II), no error was found from three times tests. As seen in Table 2 part I, and several errors from Table 2 part II. The first visible result of 3 times the experiment error detection zero, while some errors were found in Table 2 part II. There were only 2 errors from of the total number of real spikes (10 + 47) = 57, from the estimated spikes of 10 + 45 = 55. Thus, the error percentage was only 3.6%, which implied that this method could be used to detect the spike location of audio gamelan in 96.4%.
The success of this method depends on the envelope formation patterns, and these patterns were determined by peak detection. So, the selection of the appropriate the parameters were important for determining the envelope pattern.
5. Conclusion
Spike detection tests were performed on the gamelan audio. The absolute value and NEO methods performed poorly for implementation in spikes detection of gamelan music audio. The envelope pattern approach through a spline, could be used to detect the presence of spikes, and by utilizing this pattern, the threshold could become more adaptive to the envelope. So that the spike pattern with small amplitude, also be well detected. Such method could detect 55 out of 57 spikes, which means 96.4 percent correct detections.
Acknowledgements
The reported work was supported by Directorate General of Higher Education (DGHE), Ministry of National Education, Republic of Indonesia. The authors are also thankful to Zed Nahdi, M. Iqbal and members of B303 ITS for their help during the work.
References
[1] Sumarsam. Gamelan Interaksi budaya dan perkembangan musikal di Jawa. Yogyakarta: Pustaka Pelajar. 2003.
[2] Z Xu, Z Ping. Sample entropy analysis of surface EMG for improved muscle activity onset detection against spurious background spikes. Journal of Electromyography and Kinesiology. 2012; 22(6): 901-907.
[3] DP Wulandari, A Tjahyanto, YK Suprapto. Gamelan Music Onset Detection based on Spectral Features. TELKOMNIKA Telecommunication Computing Electronics and Control. 2013; 11(1): 107-118.
[4] A Tjahyanto, YK Suprapto, DP Wulandari. Spectral-based Features Ranking for GamelanInstruments Identification using Filter Techniques. TELKOMNIKA Telecommunication Computing Electronics and Control. 2013; 11(1): 95-106.
[5] Saeed V Vaseghi. Advanced Digital Signal Processing and noise Reduction. Fourth Edition. John Wiley&Sons, Ltd. 2008.
[6] JF Kaiser. On a simple algorithm to calculate the energy of a signal. In Proc. IEEE Int. Conf. Acoust., Speech, Signal Process (ICASSP ’90). 1990; 1: 381-384.
[7] I Obeid, PD Wolf. Evaluation of Spike-Detection Algorithms for a Brain-Machine Interface Application. IEEE Trans. Biomed. Eng. 2003; 51(6): 905-911.
[8] KH Kim, SJ Kim. Neural Spike Sorting under Nearly 0-dB Signal-to-noise Ratio Using Nonlinear Energy Operator and Artificial Neural-Network Classifier. IEEE Trans. Biomed. Eng. 2000; 47(10): 1406-1411.
[9] S Mukhopadhyay, GC Ray. A New Interpretation of Nonlinear Energy Operator and Its Efficacy in Spike Detection. IEEE Trans. Biomed. Eng. 1998; 45(2): 180-187.
[10] Byunghwa Lee, Minsoo Hahn, Kwangki Kim, Jinsul Kim. Efficient transient Signal Detection in Spatial Cue Based Multi-Channel Audio Coding. 2014 International Conference on Information Science and Applications (ICISA). 2014.
[11] Sarah Paige Gibson. Neural Spike Sorting in Hardware: From Theory to Practice. Los Angeles: University of California. 2012.
[12] Chen Wai-Kai. Feedback, Nonlinear, and Distributed Circuits. CRC Press. 2009: 9-20.