ISSN: 1693-6930
accredited by DGHE (DIKTI), Decree No: 51/Dikti/Kep/2010 675
Improved Bacterial Foraging Algorithm for Optimum
Economic Emission Dispatch with Wind Power
Sajjad Farajianpour*, Ali Mohammadi, Saeed Tavakoli, S. Masoud Barakati Faculty of Electrical and Computer Engineering, University of Sistan and Baluchestan, Iran
e-mail: [email protected]*, [email protected], [email protected], [email protected]
Abstrak
Pada makalah ini, algoritma penuaan bakteri (IBFA) yang telah diperbaharui diterapkan untuk memecahkan permasalahan operasi ekonomis sistem tenaga (EED). Dengan memperhatikan keberadaan sumber daya energi terbaharukan yang makin menarik beberapa tahun terakhir ini, penting sekali untuk memasukkan pembangkit tenaga angin dalam permasalahan EED. Kondisi nyata yang harus diperhatikan, telah membuat EED memiliki dua obyektif yakni biaya dan pengurangan emisi gas NOx. Permasalahan yang timbul dalam penerapan BFA adalah penghilangan bakteri yang tidak efektif yang mengakibatkan kinerja yang buruk. Untuk mengatasi hal ini, BFA yang diperbaharui diusulkan dalam alur langkah reproduksi dan diberi nama algoritma penuaan bakteri yang diperbaharui (IBFA). EED diselesaikan dengan dan tanpa menyertakan pembangkit tenaga angin, hal ini dimaksudkan sebagai batasan dan perbandingan dalam penggunaan BFA. Hasil simulasi menunjukkan peningkatan ketepatan konvergensi dengan IBFA yang lebih baik dibandingan BFA.
Kata kunci: algoritma penuaan bakteri, operasi ekonomis sistem tenaga, pareto-optimal front, permasalahan multi-obyektif, tenaga angin
Abstract
In this paper, an improved bacterial foraging algorithm (IBFA) is employed to solve economic-emission dispatch (EED) problem. Regarding to more interest to renewable energy sources especially wind energy in recent years, it is necessary to use of incorporate wind power plants into EED problem. To consider realistic conditions, EED is included bi-objective of cost and NOx emission. The problems encountered with BFA are ineffective bacteria elimination resulted in poor performance. To overcome this, a modified BFA is proposed in reproduction step termed as Improved Baterial Foraging Algorithm (IBFA). EED is solved, with wind power plant and without it, subjected to couple of constraintsusing BFA an BFA in a comparative manner.Simulation results show enhancement in convergence accuracy with IBFA rather than conventional BFA.
Keywords: bacterial foraging algorithm, economic-emission dispatch, multiobjective problem, pareto-optimal front, wind power
1. Introduction
Economic dispatch is one of the most important issues during the operation and programming of the power plants generation, being of great importance in financial saving especially due to the fossil fuel resources shortage. Hence, it is noticeably expected to obtain the most appropriate generation arrangement to power plants considering constraints in the power grid to minimize objective functions. In this study, in addition to generation cost, pollutant gas emission is considered in the optimization function[1]. It is fashionable to integrate thermal power plants in economic dispatch (ED) but in this study, in light of the advantages taken by renewable energy resources, there has been an attempt to contribute wind power plants[2-4]. According to the load profile and local wind characteristics, wind plant is able to produce 10%-40%out of the total demand load, in this case, is assigned as 10%[5].
conventional BFA, introducing IBFA.In Section 2, EED is mathematically represented and the problem constraints are defined. In this section, an improved BFA and its application in EED in two systems, with and without wind power plant are presented. In Section 3,details regarding to the proposed IBFA are presented. Section 4 is dedicated to convert the multi-objectiveoptimization EED problem to the single-objective optimization using weighted-sum technique. The simulation resultsfrom conventional BFA and IBFAare presented and compared for both with wind pland and without it in Section 4.
2. Problem Statement
EED is a multi-objective problem to obtain output power of the generative units so that all objectives meet minimum values based on their priority.
2.1.Objective Function
The EED objectives can be listed as follows [11]:
Function 1: F1 is total fuel cost of the thermal units that can be formulated approximately by
using a quadratic polynomial in terms of the generative power, as
) ( 1
1
F
P
iN i
i
F
∑
=
=
(1)
P
c
P
b
a
P
F
i i i i i2
)
( = + +
(2)
wherePi is the power of the i th
generating unit; ai, bi, and ci are the cost coefficients of the ith generating unit.
Function # 2: F2 as total emission gas NOxis also represented in the quadratic equation.
∑
=
+ + =Ng
i i
i i i
i
P
e
P
f
d
F
1 2
2 ( )
(3)
where, d1i, e1i, f1i are emission coefficients.
2.2. Wightted-Sum Method
Weighted-sum method is extensively used to solve multi-objective problems [12]. Generic procedure to this method is based on allocating each of the functions according to their priority on interval [0 1] to form a new objective function. The sum of the assigned weights should be unity. This function is represented as follows:
)]) ( (F WkFk Pi
Min =
∑
(4) subject to :
∑
==
M
k1
w
k1
( 0≤
w
k≤1) (5)where M is the number of objective functions and, wk, is weight of the kth assigned.
Regarding to above EED bi-objective function can be converted into a single objective function as:
F
w
F
w
F
= 1 1+ 2 2 (6)subject to:
1
2 1+
w
=w
0 , 12
1 ≤
≤
w
w
(7)2.3. Constraints
Load Balance: Sum of load demand and power losses must equal to the total generating power.
P
P
P
Demand Loss Ni i
+ =
∑
=1 (8)
where PLoss, network losses and PDemand, load demand, respectively.
Generating Unit Capacity Limits: Each generator is allowed to generate at a predefined range due to the special operation.
P
P
P
i,min≤ i≤ i,max (9)where Pi is the output power of i th
generator; Pi,min and Pi,max are the minimum and maximum power outputs of ithgenerator, respectively.
2.4. Network Losses
Losses of the transmission lines are described in terms of the active power of generating units and the B-coefficient matrix [13].
∑
∑∑
= = =
+ +
=N N N
g g g
i i i i j i ij j
Loss
P
B
P
B
P
B
P
1 0 00
1 1
(10)
where B is coefficient matrix, B0is column vector of the network losses and B00is constant coefficient of the network losses.
2.5. Wind Power Plant Constraints
Considering the wind power plant as a generation unit in the power network, the power balance equation is changed as:
P
P
P
P
Demand W Loss Ni
i= − +
∑
=
) (
1 (11)
where Pw is the load demand portion generated by the wind power plant.
The other constraint wind power plant imposes the wind power availability as:
∑
=
≤ −
+ Ng
i
av i Loss
Demand
P
P
P
P
1 (12)
3. Improved Bacterial Foraging Algorithm (IBFA)
In this section, BFA fundamental is introduced and required modification is made to improve the efficiency algorithm.
3.1. Bacterial Foraging Algorithm (BFA)
BFA is inspired by foraging behavior of E.Coli bacteria where they forage based on different principles such as the bacteria with more poor foraging strategy are almost eliminated. Various biological aspects and bacteria behavior is available in [14].
bacterium in j-th movement step, kthgeneration step ,lth elimination and dispersion step. J(i,j,k,l) denotes the cost function of ithbacterium positionθi(j,k,l) and Nc refers to the bacterium life time measured by the number of movement steps. To model swimming, a random movement of length ϕ(j) is produced:
) ( ) ( ) , , ( ) , , 1
(j k l i j kl C i j
i
ϕ
θ
θ
+ = + (13)where C(i)>0 is the step length randomly taken by swimming performance. If the bacterium cost function J(I,j+1,l) in positionθi(j+1,k,l) less than the bacteriumcost in positionθi(j,k,l), this task is accomplished to maximum steps number (NS). After Ncmovementstep, ageneration step is taken. In generation, the most proper bacteria (from stand point of the least cumulative cost per life time) are reproduced and the others are eliminated. Thus, the population is maintained constant. After the reproduction steps, elimination and disperse step is taken how each bacterium in population of possibilityPed is eliminated and a newbacterium replaced for eliminated. Bacteria always have attracted and repellant mode, in other words, bacteria colony containing better position, attracts the others and bacteria colony with worse position repels.
(14)
where Wrepellant, hrepellant, Wattract and hattract are repellant and attract index coefficients. So the
general objective function is:
) , ( ) , , ,
(i jk l J P
J + ccθ (15)
The BFA conventional code is summarized as below:
FOR (each bacterium i =1:S)
θi
(1,1,1)= rand_post( )
J(i,1,1,1)= derivative_value(θi
(1,1,1)) END FOR
FOR (elimination-dispersal loop l =1: Ned) FOR (reproduction-loop k =1: Nre)
FOR (chemotactic-loop j =1: Nc) FOR (each bacterium i =1: S) Calculate
J(i, j, k, l)= J(i, j, k, l)+ Jcc(θi(j, k, l), θ(j, k, l))
Set Jlast = J(i, j, k, l)
Tumble:
Find the direction of possible movement from thedirection probability matrix. Move:
θi
(j+1, k, l)= ϕ[m’,n’,i,j+1,k,l]
Compute J(i, j +1, k,l) m =0
WHILE (m < Ns) m = m +1
IF (J(i, j +1, k,l)<Jlast)
Jlast= J(i, j +1, k, l)
Update θ(i, j +1, k, l)
Recalculate J(i, j +1, k, l) ELSE
m = Ns END IF END WHILE
Reproduction:
For given k and l, and each bacterium i =1,2, ... ,S Sum:
∑
+=
= 1
1 ) , , , (
Nc j i
health Ji jkl
J
Sort:
Sort bacteria and chemotactic parameters C(i) in order
of ascending cost Jhealth.
Split and Eliminate:
The Sr bacteria with the highest Jhealth values die and the
remainingSr bacteria with the best values split. END FOR (Reproduction)
Disperse:
For i = 1, 2, ... , S, with probability Ped, randomize a
Bacterium’s position
END FOR (Elimination and Dispersal) END
3.2. Improved Bacterial Foraging Algorithm (IBFA)
In conventional BFA structure, once the NC movement steps were performed for each bacterium, the values of Jhealth can be calculated as below.
∑
+=
= 1
1
) , , , (
Nc
j i
health J i jkl
J
(16)
According to the above equation, Jhealth is equal to the sum of each bacterium’s positions in each movement step. In the other word, the propriety rate of each bacterium is equal to the sum of its costs in each movement step. Then, as mentioned in the trend of the BFA, the value of Jhealth for each bacterium is sorted based on its value from the biggest Jhealth to the smallest one. The bacteria with higher value of Jhealth (the above half of the sorted values) should be eliminated. Now, it is possible for a bacterium in a movement step to reach near the global optimum point, while has experienced a high objective function value in its own other movement steps, consequently, a high value of Jhealth, which leads to the elimination of this bacterium, while it had this capability to locate in a proper position near the global optimum point. To solve this problem, the all movement steps of the bacterium is also verified after finishing the movement steps. In the other word, the BFA structure is improved by saving all the movement steps for each bacterium and revising the all positions of the bacteria in various movement steps.
4. Simulation Results
A proposed IBFA is used to solve EED for a test power grid, both without and with wind plant using BFA and IBFA. An EED simulation is performed on the 30-bus IEEE test system including six generators and 1800 MW load demand. Computer simulator specifications are CPU Intel® core™ i.3 (1.66 GHz) and 4 GB of RAM. Generators parameters and cost and emission coefficients are shown in Tables1 and 2 respectively [13].
Table 1. Data for the 6-generator system
Table 2. Coefficients for cost and emission equation
Table 3. Non-dominant solutions for cost and NOxobjectives
B-coefficient matrix:
Parameter
Unit ai $/MWh
bi $/MWh
ci $/MWh
Pi,min MW
Pi,max MW 1 0.002035 8.43205 85.6348 150 600 2 0.003866 6.41031 303.7780 150 600 3 0.002182 7.42890 847.1484 150 600 4 0.001345 8.30154 274.2241 150 600 5 0.002182 7.42890 847.1484 150 600 6 0.005963 6.91559 202.0258 150 600
Generator
Obj. Coef. 1 2 3 4 5 6
C
o
s
t
F
1
($
/h
) ai 0.002035 0.003866 0.002182 0.001345 0.002182 0.005963
bi 8.43205 6.41031 7.4289 8.30154 7.4289 6.91559 ci 85.6348 303.778 847.1484 274.2241 847.1484 202.0258
N
O
x
F
2
(k
g
/h
)
di 0.006323 0.006323 0.003174 0.006732 0.003174 0.006284 ei -0.38128 -0.79027 -1.36061 -2.39928 -1.36061 -0.39077 fi 80.9019 28.8249 324.1775 610.2535 324.1775 50.3808
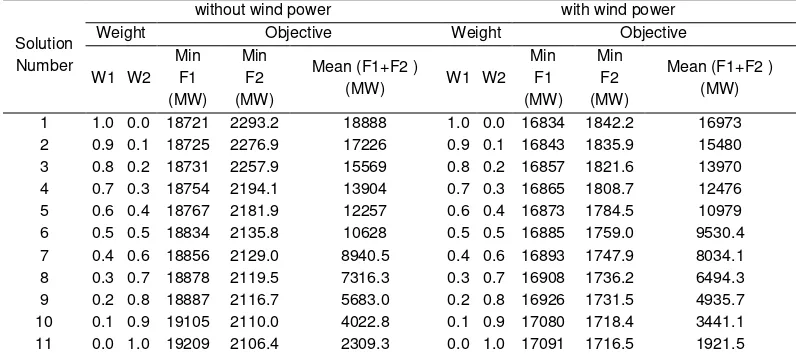
Solution Number
without wind power with wind power
Weight Objective Weight Objective
W1 W2 Min
F1 (MW)
Min F2 (MW)
Mean (F1+F2 )
(MW) W1 W2 Min
F1 (MW)
Min F2 (MW)
Mean (F1+F2 ) (MW)
Table 4. Power generation dispatch and losses (without wind power)
Table 5.Power generation dispatch and losses (withwind power)
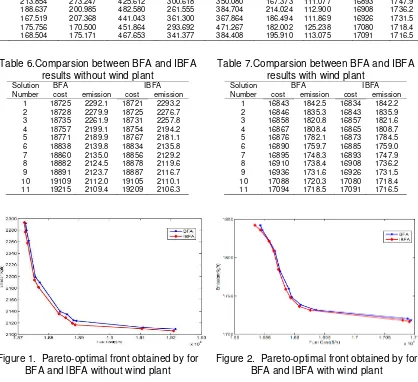
Table 6.Comparsion between BFA and IBFA results without wind plant
Solution Number
BFA IBFA cost emission cost emission 1 18725 2292.1 18721 2293.2 2 18728 2279.9 18725 2276.7 3 18735 2261.9 18731 2257.8 4 18757 2199.1 18754 2194.2 5 18771 2189.9 18767 2181.1 6 18838 2139.8 18834 2135.8 7 18860 2135.0 18856 2129.2 8 18882 2124.5 18878 2119.6 9 18891 2123.7 18887 2116.7 10 19109 2112.0 19105 2110.1 11 19215 2109.4 19209 2106.3
Table 7.Comparsion between BFA and IBFA results with wind plant
Solution Number
BFA IBFA cost emission cost emission 1 16843 1842.5 16834 1842.2 2 16846 1835.3 16843 1835.9 3 16858 1820.8 16857 1821.6 4 16867 1808.4 16865 1808.7 5 16876 1782.1 16873 1784.5 6 16890 1759.7 16885 1759.0 7 16895 1748.3 16893 1747.9 8 16910 1738.4 16908 1736.2 9 16936 1731.6 16926 1731.5 10 17088 1720.3 17080 1718.4 11 17094 1718.5 17091 1716.5
Figure 1. Pareto-optimal front obtained by for BFA and lBFA without wind plant
Figure 2. Pareto-optimal front obtained by for BFA and lBFA with wind plant
So
lu
ti
o
n
N
o
. Without wind power
Power Generation Dispatch (MW) PLoss (MW)
F1 ($/h)
F2 (kg/h) P1 P2 P3 P4 P5 P6
1 293.434 272.594 534.207 345.920 290.701 189.751 129.849 18721 2293.2 2 246.191 268.665 540.076 359.872 343.105 172.746 130.624 18725 2276.9 3 258.512 264.657 470.742 410.546 332.127 195.358 131.825 18731 2257.9 4 266.615 262.403 483.492 341.216 355.416 223.704 133.054 18754 2194.1 5 216.658 298.732 560.642 299.978 362.332 196.532 134.818 18767 2181.9 6 178.537 234.186 547.378 360.158 418.715 200.916 139.961 18834 2135.8 7 217.687 280.583 467.886 349.609 467.911 165.418 148.892 18856 2129.0 8 176.130 253.174 592.315 319.629 414.092 183.798 139.447 18878 2119.5 9 150.301 258.094 536.007 377.737 419.375 200.479 142.322 18887 2116.7 10 221.681 230.455 513.532 383.277 431.351 159.904 140.460 19105 2110.0 11 197.190 159.604 537.593 292.301 551.286 225.308 163.198 19209 2106.4
So
lu
ti
o
n
N
o
. With wind power
Power Generation Dispatch (MW) PLoss (MW)
F1 ($/h)
F2 (kg/h) P1 P2 P3 P4 P5 P6
5. Conclusion
In this paper, the economic-emission dispatch(EED)problem is investigated. Usually, all generation units are considered as the thermal unit, meanwhile, due to the growth in renewable energy sources, the wind generation system is also considered as well as the thermal units.The EED is a bi-objective optimization problem; hence, the weighted sum method is used to solve such a problem. The results for the various weights are presented and pareto- optimal curve is drawn. This trend is achieved for both with and without wind generation system states (10% of the total load demand is supply by wind generation system).To solve this problem, initially, BFA is employed. Then, to augment the solution performace to obtain the global optimum point, a modification into the structure of convention BFA was made which tends into IBFA. EED problem was solved with proposed IBFA. Simulation results demonstrate the effectiveness of IBFA in convergence accuracy.
References
[1] Farhat IA, El-Hawary ME. Bacterial Foraging Algorithm for Optimum Economic-Emission Dispatch. IEEE Electrical Power and Energy Conf. 2011.
[2] Demeo EA, Grant W, Milligan MR, Schuerger MJ.Windplant Integration.IEEE Power Energy Mag. 2005; 3(6): 38-46.
[3] Ahlstrom M, Jones L, Zavadil R, Grant W.The Future of Wind Forecasting and Utility Operations.IEEE Power Energy Mag. 2005; 3(6): 57-64.
[4] Zavadil R, Miller N, Ellis A, Muljadi E.Making Connections: Wind Generation Challenges and Progress.IEEE Power Energy Mag.2005; 3(6): 26–37.
[5] Farhat IA, El-Hawary ME. Dynamic Adaptive Bacterial Foraging Algorithm for Optimum Economic Dispatch with Valve-point Effects and Wind Power. IET Gener. Transm. Distrib., 2010; 4: 289-999. [6] Walters DC, Sheble GB.Genetic Algorithm Solution of Economic Dispatch with Valve Point Loading.
IEEE Trans. Power Syst. 1993; 8(3): 1325–1332.
[7] Tippayachai J, Ongsakul W, Ngamroo I.Parallel Micro Genetic Algorithm for Constrained Economic Dispatch. IEEE Trans. Power Syst. 2002; 17(3): 790–797.
[8] Lin W, Cheng F, Tsay M. An Improved Tabu Search for Economic Dispatch with Multiple Minimal. IEEE Trans. Power Syst. 2002; 17(1): 108–112.
[9] Gaing Z. Particle Swarm Optimization to Solving the Economic Dispatch Considering the Generator Constraints. IEEE Trans.Power Syst. 2003; 18(3): 1187–1195.
[10] El-Gallad AI, El-Hawary ME, Sallam AA, Kalas A.Swarm Intelligence for Hybrid Cost Dispatch Problem. Canadian Conf. on Electrical and Computer Engineering. 2001; 2: 753–757.
[11] Lee FN, Breipohl AM.Reserve Constrained Economic Dispatch with Prohibited Operating Zones. IEEE Trans. Power Syst. 1993; 8(1): 246–254.
[12] Sinha N, Chakrabarti R, Chattopadhyay PK. Evolutionary Programming Techniques for Economic Load Dispatch. IEEE Trans. Evol. Comput. 2003; 7(1): 83–94.
[13] Alhajri MF, El-Hawary ME.Pattern Search Optimization Applied to Convex and non-Convex Economic Dispatch. IEEE Int. Conf. on Systems, Man and Cybernetics (ISIC 2007). 2007; 2674– 2678.
[14] Passino KM. Biomimicry of Bacterial Foraging for Distributed Optimization and Control.IEEE Control Syst. Mag. 2002; 22(3): 52–67.