DOI: 10.12928/telkomnika.v15.i1.3164 540
Image De-noising on Strip Steel Surface Defect
Using Improved Compressive Sensing Algorithm
Dongyan Cui1,2, Kewen Xia*1, Jingzhong Hou1, and Ahmad Ali1
1School of Electronics Information Engineering, Hebei University of Technology
Tianjin/China/Hebei University of Technology
2School of Information Engineering, North China University of Science and Technology
Tangshan/China/North China University of Science and Technology Corresponding author, e-mail: [email protected]
Abstract
De-noising for the strip steel surface defect image is conductive to the accurate detection of the strip steel surface defects. In order to filter the Gaussian noise and salt and pepper noise of strip steel surface defect images, an improved compressive sensing algorithm was applied to defect image de-noising in this paper. First, the improved Regularized Orthogonal Matching Pursuit algorithm was described. Then, three typical surface defects (scratch, scar, surface upwarping) images were selected as the experimental samples. Last, detailed experimental tests were carried out to the strip steel surface defect image de-noising. Through comparison and analysis of the test results, the Peak Signal to Noise Ratio value of the proposed algorithm is higher compared with other traditional de-noising algorithm, and the running time of the proposed algorithm is only26.6% of that of traditional Orthogonal Matching Pursuit algorithms. Therefore, it has better de-noising effect and can meet the requirements of real-time image processing.
Keyword:compressive sensing, surface defects , image de-noising
Copyrightc 2017 Universitas Ahmad Dahlan. All rights reserved.
1. Introduction
Image noise reduction is a classical problem in image processing which has over 50 years of research history[1, 2], and still is a hot topic. The strip steel surface defect images in the process of collection, acquisition and transmission will be polluted to some extent by visible or invisible noise, also due to the unstable light, camera vibration and other factors etc. Therefore, it is necessary to carry out the noise processing of the collected images.
A large number of studies have been carried out on the surface defect image de-noising at home. In 2008, Liu Weiwei, Yun Hui Yan et al of Northeastern University put forward an image de-noising method based on local similarity analysis and neighborhood noise evaluation [3]; In 2010, Bo Tang et al studied the rules of strip steel surface defects image de-noising based on wavelet threshold[4]; In 2012, Hao Xu of Wuhan University of Science and Technology proposed the method of surface defect of strip steel based on mathematical morphology, which could detect small defect edge under strong noise and own strong noise immunity[5].
From the above, the existing strip steel surface defect image de-noising methods mainly focused on the traditional filtering method. In the existing theory, the original signal is mostly pro-jected to a certain transformation space, and the sparsity of the coefficient in the projection do-main is as a fundamental basis. While the existence of noise affected the sparsity of signals in the transform space. So the optimization method is used to restore the signal, if only a single sparse constraint principle is used, it is difficult to accurately reconstruct the original signal. In this case, compressive sensing theory still may take other effective method of reconstructing. Numerous studies show that the reconstruction algorithm based on compression perception theory is applied in signal de-noising can achieve good effect[6]-[8]. Donoho[9]-[10],Candes[11]-[13],Romberg[11]-[13] and Tao[12]-Donoho[9]-[10],Candes[11]-[13],Romberg[11]-[13] and other scientists initially put forward the concept of compressed sensing from sparse signal decomposition and approximation theory in 2004, followed by a large number
of relevant theoretical research. M.A.T. Figueiredo proposed the gradient projection for sparse reconstruction(GPSR)algorithm based on the L1 norm. The method obtained the good effect of denoising [14].
The compressed perception theory is introduced into the strip steel surface defect image preprocessing, which is rarely mentioned in the literature at home and abroad. Therefore, In this paper, the improved ROMP algorithm was applied to the strip steel surface defect image de-noising, which has better de-noising effect and shorter running time compared with traditional median filtering, wavelet threshold method and traditional compressed sensing algorithm.
2. Research Method
2.1. Description of weighted ROMP algorithm
Needell et al proposed the regularized orthogonal matching pursuit algorithm (ROMP) based on the orthogonal matching pursuit (OMP)[15]-[16]. All matrices satisfied the restricted isometry condition and all sparse signals can be reconstructed.
The algorithm was improved based on ROMP algorithm. The selection of atomic index set for the first time was using weighted correlation coefficient, not only considering the correlation coefficient of the current iteration, also considering the correlation coefficient of the last iteration, and expanding the selection scope of index value. Weighted formula is as shown in (1).
gt=αg+βgt−1s.t.g=ATr T−1
,0< α <1,0< β <1, α+β = 1 (1)
The pseudo code of algorithm is as follows.
Input:(1)measurement matrixy,y ∈ R;(2) M ×N dimensional sensing matrixA = ΦΨ
;(3) sparsity levelKof the signal(the number of nonzero elements inx).
OutputN dimensional reconstructed signal(sparse approximation signal)xˆ∈RN . Initializer0=y,Λ0=φ, A0=φ nonzero values, which corresponds to the column number ofAand construct a setJ ;
step (3)Regularize: |ui| ≤ 2|uj|for alli, j ∈J0,Among all subsetJ0,choose J0with the the number of elements in the set or residuart= 0,then the iteration stop, and enter step (7);
step (8)θˆthas nonzero entries atΛtthe value is respectivelyθˆtobtained from reconstruc-tion
step (9) reconstructed the signalxˆ= Ψˆθ.
2.2. De-noising Model Based On The Weighted Correlation ROMP Algorithm
Assuming that the received image signal isg(x, y), which is contaminated by noise. The clean image isf(x, y). The additive noise isn(x, y).Then the additive noise model isg(x, y) = f(x, y) +n(x, y). When the signal is disturbed by multiplicative noise, the model is expressed as in (2).
g(x, y) =f(x, y) (1 +n(x, y)) =f(x, y) +f(x, y)n(x, y) (2)
Where, the output signal of the second term is the result of multiplying the noise, which is affected byf(x, y). The biggerf(x, y), the bigger the noise. According to the theory of compres-sive sensing, the following results can be obtained,as in (3).
Where,αis a sparse representation of the transformed image. In this way, we can recover the original image by estimating the sparse representation of the clean image so as to achieve the purpose of removing the noise.
The de-noising model based on the compressive sensing model is as in (4).
α=argminkαk0, s.t.kΦα−gk 2
2≤T (4)
3. Result and Analysis
Three kinds of strip steel defect images (scratch, scar, surface upwarping) are selected in this paper ,and the noise type is Gaussian noise and salt and pepper noise.
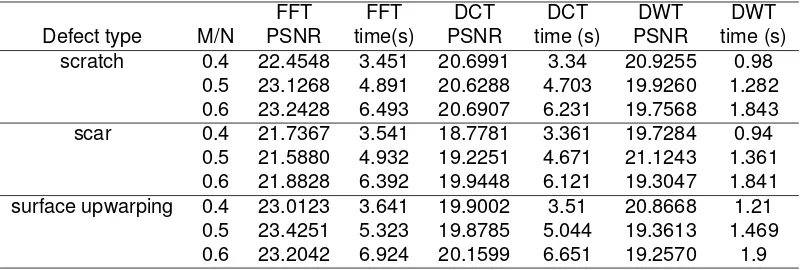
3.1. Simulation Experiment 1: Defect image de-noising polluted by Gaussian noise Firstly, the effect of different transformation matrices on the image de-noising processing is studied. Sampling rate was 0.4, 0.5 and 0.4, respectively ,as shown in Table 1.
Table 1. Comparison of different sampling rate and different transformation matrices
FFT FFT DCT DCT DWT DWT
Defect type M/N PSNR time(s) PSNR time (s) PSNR time (s)
scratch 0.4 22.4548 3.451 20.6991 3.34 20.9255 0.98
0.5 23.1268 4.891 20.6288 4.703 19.9260 1.282
0.6 23.2428 6.493 20.6907 6.231 19.7568 1.843
scar 0.4 21.7367 3.541 18.7781 3.361 19.7284 0.94
0.5 21.5880 4.932 19.2251 4.671 21.1243 1.361
0.6 21.8828 6.392 19.9448 6.121 19.3047 1.841
surface upwarping 0.4 23.0123 3.641 19.9002 3.51 20.8668 1.21
0.5 23.4251 5.323 19.8785 5.044 19.3613 1.469
0.6 23.2042 6.924 20.1599 6.651 19.2570 1.9
From Table 1 ,we can get the comparison results of PSNR and run time under the DWT and FFT, DCT transform matrix.The PSNR value using DWT transformation matrix to process is higher than that of the DCT transform matrix, and is slightly lower than that of the FFT transform matrix. While the running time of the DWT transform matrix is much shorten than that of the other two. Obviously, the DWT transformation matrix can greatly shorten the running time, and it will not reduce the image quality. In this paper, the DWT transform matrix is applied in different compression sensing algorithms to process the strip surface defect image, so as to achieve the purpose of real-time processing.
Table 2 shows the de-noising results of three types of defects (scratch, scar, facial warp-ing) under Gaussian noise using OMP, Cosamp, stomp and the proposed algorithm. The sampling rate is 0.5, The transformation matrix is the DWT matrix. The Gaussian noise mean is 0 and vari-ance is 0.1, 0.01, 0.001 respectively, as shown in Table 2 below.
Table 2. Gaussian noise de-noising effect when the sampling rate is 0.5
Defect GaussianOMP OMP Cosamp Cosamp StOMP StOMP Proposed Proposed
type Noise PSNR Time(s) PSNR Time(s) PSNR Time(s) PSNR Time(s)
scratch 0.1 15.0269 11.373 11.3264 8.1589 9.6994 1.995 26.7728 2.9952 0.01 24.1047 11.546 17.9604 7.1916 18.7309 2.139 29.9563 3.0888 0.001 33.4488 11.345 21.1458 7.3788 27.6014 2.124 33.6600 3.0576
scar 0.1 18.3338 11.152 11.4972 7.2696 9.7740 1.588 26.7509 2.9952
0.01 24.0836 11.500 17.4030 7.1760 18.5289 1.907 29.2152 3.0420 0.001 33.1111 11.729 19.9023 7.1760 27.2120 1.484 32.3062 3.1356 surface 0.1 15.1427 11.431 11.3537 7.2384 9.7414 0.8569 26.5816 3.1512 upwarping0.01 23.7802 11.607 17.0315 7.1448 18.2017 0.3639 29.3068 2.9952 0.001 32.5775 11.400 19.6132 7.0824 24.7782 0.1734 32.5256 3.0108
and variance 0.01). Figure 4 (a)-(c) are respectively the PSNR comparison curve of three kinds of defects noisy images obtained by using various de-noising algorithms.
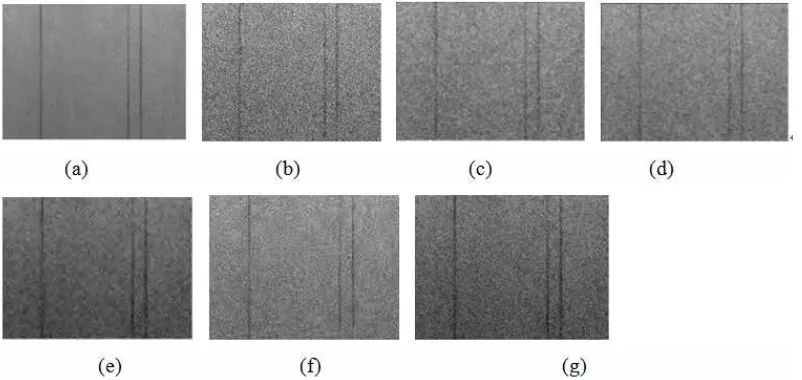
Figure 1. scratch(Gaussian noise with mean 0 and variance 0.01)(a) the original image of scratch (b) the image with Gaussian noise (c) Median filtering image (d) Mean filtering image (e) Wavelet de-noising image (f)CS de-noising image (g) de-noising image of the proposed algorithm
As shown in Table 3 and Figure 4, the PSNR values of the various algorithms are all decreased with the increasing of the noise intensity. Compared with other traditional de-noising methods, the proposed method in this paper has higher PSNR value, that is, the effect is better.
3.2. Simulation Experiment 2: Defect image de-noising polluted by salt and pepper noise Type of defects are respectively scratch, scar and facial warping in the experiment. Salt and pepper noise intensity are 0.1, 0.01,0.005,0.001. 3*3 templates is selected in mean filter and median filter for processing. Figure 5(a)-(g) to figure7(a)-(g) are respectively the results of three kinds of defects de-noising images. Table 4 shows the PSNR values of three kinds of defects using various de-noising algorithms (Salt and pepper noise intensity is 0.1). Figure 8 (a)-(c) are respectively the PSNR comparison curve of three kinds of defects noisy images obtained by using various de-noising algorithms.
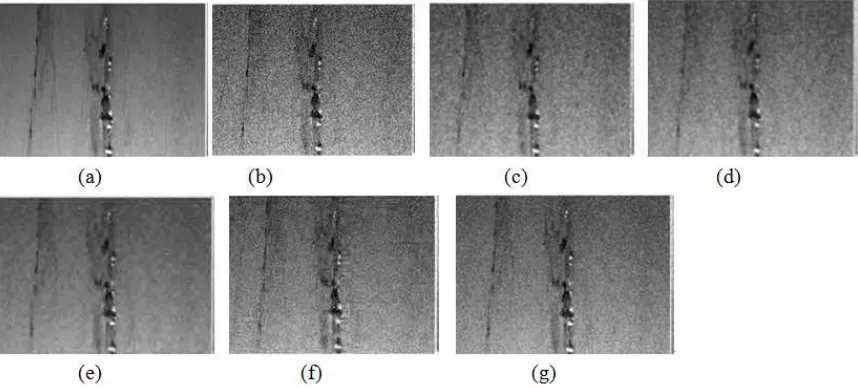
Figure 2. scar(Gaussian noise with mean 0 and variance 0.01)(a) the original image of scar (b) the image with Gaussian noise (c) Median filtering image (d) Mean filtering image(e) Wavelet de-noising image (f)CS de-noising image (g) de-noising image of the proposed algorithm
Figure 3. surface upwarping(Gaussian noise with mean 0 and variance 0.01)(a) the original image of surface upwarping (b) the image with Gaussian noise (c) Median filtering image (d) Mean filtering image(e) Wavelet de-noising image (f)CS de-noising image (g) de-noising image of the proposed algorithm
the proposed method in this paper has higher PSNR value, that is, the effect is better.
4. Conclusion
For cold-rolling complex environment, and its image in the acquisition, acquisition, transfer process will be polluted by visible or invisible noise, we focus on de-noising method based on the improved compressive sensing algorithm. The conclusions are as follows:
(1) In the compressive sensing algorithm, the image quality and running time are affected by different transformation matrix. Considering the two, the DWT transform matrix is the best.
Table 3. The de-noising effect of various algorithms with different intensity Gaussian noise
Defect Noise PSNR0 Median filter Mean filter wavelet CS-OMP proposed
scratch 0.1 12.7296 17.5589 19.0174 24.1869 15.0130 26.7728
0.02 18.6791 24.0706 23.2626 24.0905 20.9537 26.8191
0.01 21.5005 26.7408 24.3423 24.0711 23.8867 29.9563
0.005 24.2483 29.2443 25.2858 24.0755 26.7766 32.6602
scar 0.1 12.9701 17.4094 18.8318 23.8928 15.1302 26.7509
0.02 18.7187 23.8616 22.7633 23.8432 20.9413 26.9985
0.01 21.5438 26.3853 23.7873 23.8198 23.6766 29.2152
0.005 24.1825 28.8335 24.7421 23.8063 26.5264 31.2532
surface 0.1 12.8528 17.1803 18.6847 23.6883 15.0231 26.5816
upwarping 0.02 18.3413 23.0985 22.4577 23.6199 20.8064 26.8462
0.01 20.8621 25.2768 23.5022 23.6304 23.4988 29.3068
0.005 22.9852 26.9534 24.0940 23.5888 26.1000 32.6708
Figure 4. the PSNR comparison curve obtained by using various de-noising algorithms(a)The PSNR curve of scratch image (b) The PSNR curve of scar image (c) The PSNR curve of surface upwarping image
de-noising effect for different kinds of defects.
(3) Compared with the traditional algorithm such as median filtering, mean filtering, wavelet noising and conventional compression sensing method ,the proposed method has better de-noising effect.
Acknowledgement
This work was supported by the National Natural Science Foundation of China (No. 51208168), and Hebei Province Natural Science Foundation (No. E2016202341).
References
[1] Zhang Ye, Jia Meng, ”Underground Image Denoising”TELKOMNIKA Indonesian Journal of Electrical Engineering, vol. 12(6), pp.4438-4443, 2014.
[2] WANG Jianwei, ”A Noise Removal Algorithm of Color Image” TELKOMNIKA Indonesian Journal of Electrical Engineering, vol. 12(1), pp.565-574, 2014.
[3] Weiwei Liu, Yan Yun-hui, Sun Hong-wei et al., ”Impulse noise reduction in surface defect of steel strip images based on neighborhood evaluation,” Chinese Journal of Science Instru-ment, Vols 29, pp. 1846-1850, 2008.
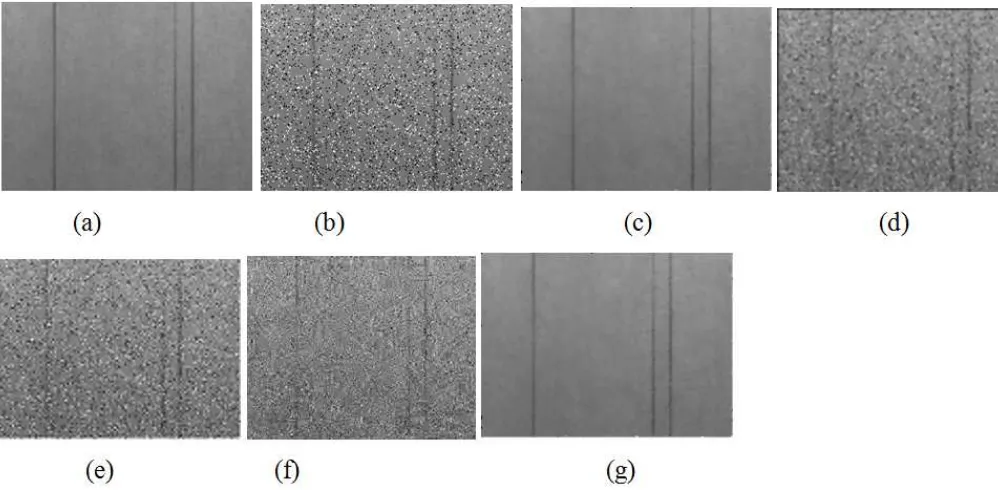
Figure 5. scratch(Salt and pepper noise intensity is 0.1)(a) the original image of scratch (b) the image with Gaussian noise (c) Median filtering image (d) Mean filtering image (e) Wavelet de-noising image (f)CS de-de-noising image (g) de-de-noising image of the proposed algorithm
Figure 6. scar(Salt and pepper noise intensity is 0.1)(a) the original image of scar (b) the image with Gaussian noise (c) Median filtering image (d) Mean filtering image(e) Wavelet de-noising image (f)CS de-noising image (g) de-noising image of the proposed algorithm
38-42,2010.
[5] Hao Xu, ”Image processing and identification of strip steel surface defects based on machine vision,”Thesis for master’s degree of Wu Han University of science and technology,2012. [6] Amin Tavakoli, Ali Pourmohammad, ”Image Denoising Based on Compressed Sensing,”
In-ternational Journal of Computer Theory and Engineering,Vols 4,pp. 266-269,2012.
[7] Shunli Zhang, ”Compressed Sensing Method Application in Image Denoising,”International Journal of Signal Processing, Image Processing and Pattern Recognition,Vols 8,pp. 203-212,2015.
Figure 7. surface upwarping(Salt and pepper noise intensity is 0.1)(a) the original image of surface upwarping (b) the image with Gaussian noise (c) Median filtering image (d) Mean filtering image(e) Wavelet de-noising image (f)CS de-noising image (g) de-noising image of the proposed algorithm
Table 4. The de-noising effect of various algorithms with different intensity Salt and pepper noise
Defect Noise PSNR0 Median Mean wavelet CS-OMP Proposed
scratch 0.1 17.5990 31.5663 22.3715 23.4050 20.1083 31.5687
0.01 26.7632 36.4494 26.3376 30.6689 32.4924 37.3122 0.005 28.6169 36.4548 26.7347 33.5300 35.9337 42.4640 0.001 32.2959 36.4613 26.9791 37.1267 41.6660 48.3173
scar 0.1 17.3623 29.7687 21.9811 22.9747 19.7776 30.1205
0.01 26.5068 34.8033 25.2883 29.3508 30.9695 36.5890 0.005 28.4849 34.8155 25.6405 31.6003 34.4295 40.7194 0.001 32.0367 34.8203 25.8779 35.0911 38.5237 45.1762
surface 0.1 17.0655 28.1653 21.9634 23.1624 19.8053 29.2302
upwarping 0.01 24.3441 29.7292 24.5819 28.2800 30.6486 34.7397 0.005 25.7489 29.7268 24.8582 30.2394 32.7035 38.1562 0.001 26.9719 29.7334 25.0317 32.4196 36.0263 42.2687
Figure 8. the PSNR comparison curve obtained by using various de-noising algorithms(a)The PSNR curve of scratch image (b) The PSNR curve of scar image (c) The PSNR curve of facial warping image
on Compressive Sensing,”IEEE Trans. Geoscience and Remote Sensing,Vols 48,pp. 4285-4295,2010.
1289-1306,2006.
[10] D Donoho, Y Tsaig, ”Extensions of compressed sensing,”Signal Processing,Vols 86,pp. 533-548,2006.
[11] E. Candes , J. Romberg, ”Sparsity and incoherence in compressive sampling,”Inverse Prob
,Vols 23,pp. 969-985,2007.
[12] E. Candes,J. Romberg, T. Tao, ”Robust uncertainty principles: Exact signal reconstruction from highly incomplete frequency information,”IEEE Trans. Inform. Theory,Vols 52,pp. 489-509,2006.
[13] E. Candes,J. Romberg, T. Tao, ”Stable signal recovery from incomplete and inaccurate mea-surements,”Comm. Pure Appl. Math,Vols 58,pp. 1207-1223,2006.
[14] Figuueiredo M A T , Nowak R D, Wright S J, ”Gradient projection for sparse reconstruction: Application to compressed sensing and other inverse problems,”Journal of Selected Topics in Signal Processing: Special Issue on Convex Optimization Methods for Signal Processing
,Vols 194,pp. 586-598,2007.
[15] Needell DVershynin R, ”Signal recovery from incomplete and inaccurate measurements via regularized orthogonal matching pursuit,”IEEE Journal on Selected Topics in Signal Process-ing,Vols 4,pp. 310-316,2010.