Vol. 2, No. 1, 2013, 16-25 DOI:10.11634/216826311302263
ISSN 2168-2631 Print/ ISSN 2168-264X Online © 2013 World Scholars
Relative Efficiency of Rural Saving and Credit Cooperatives: An Application of
Data Envelopment Analysis
Kifle Tesfamariam
1, Hailemichael Tesfay
2and Aregawi Tesfay
31
Department of Cooperative Studies, Mekelle University,Ethiopia
2
Department of Accounting and Finance, Mekelle University, Ethiopia
3
Department of Cooperative Studies, College of Business and Economics, Mekelle University, Ethiopia
Saving and Credit Cooperatives (SACCOs) have been playing a distinct and important role in rural areas of Ethiopia in terms of outreach, volume of operation and the purpose they serve. The performance of rural financial cooperatives in the mobilization of savings and provision of credit has been inadequate. Therefore, greater degrees of efficiency among rural SACCOs would result in greater access to finance, higher profitability and increased financial services to rural people. In this study we apply the Data Envelopment Analysis (DEA) method to evaluate the relative efficiency of SACCOs in Tigrai region of Ethiopia. Data were collected from 329 rural SACCOs during the year 2012. The result showed that the extent of technical efficiency varies across geographical location and scale size of the cooperatives. From the total of 329 SACCOs, compared to their respective peers, only 18 (5.5%) were identified as relatively efficient with the maximum efficiency score of one. The remaining SACCOs were found to be relatively inefficient with efficiency score of less than one. The average efficiency was 21.3% which indicates that there is substantial amount of inefficiency among rural SACCOs in the study area. Technical efficiency was high for larger SACCOs. In terms of geographical location, the highest mean efficiency has been observed in southern and western zones of the region with a mean score of 0.276 and 0.259 respectively. The most interesting aspect of this study was that most of the efficient rural SACCOs are the ones that received reward from the regional government for their best performance, during the year 2012.
Keywords: data envelopment analysis, technical efficiency, saving and credit cooperatives
Introduction
The financial service sector in Ethiopia is composed of formal, semi formal and informal sectors. The formal/organized sector comprises diverse range of financial service institutions such as commercial banks and other finance companies. However, the semi formal and informal sector mainly comprises small financial institutions such as saving and credit cooperatives and iqqub and iddir respectively. The formal financial service sector regulated by National Bank of Ethiopia (NBE) comprises licensed commercial banks, insurance companies and microfinance. Licensed commercial banks have been permitted to provide all banking services. Hence, they play a central role within the financial services sector. They have the capacity to provide liquidity, and are also responsible for payment services, thereby facilitating for all entities to carry out their financial transactions.
In addition, the emergence of member based financial institutions has also been recognized for the provision of banking services in Ethiopia. These specialized institutions provide only certain financial
services, such as saving and credit services to members. Cooperatives such as saving and credit cooperative (SACCOs) have an extensive network throughout the country. In 1991/1992, SACCOs, which were only 495 (with membership of 119,799), reached 10,270 in the year 2012, currently constituting the first most common type of coops in the country in terms of both number and membership. As coops, SACCOs are expected to play their share in bringing about broad based development and poverty alleviation. SACCOs are permitted to take deposit from the members and grant loan under the cooperative proclamation No. 147/1998. These proclamation, failed to recognize that SACCOs are financial institutions despite the fact that they accept deposits and grant loans. They are not subjected to the regulation and supervision that other formal financial intermediaries are subjected to (Kifle, 2012). Although SACCOs are not regulated or supervised by the National Bank of Ethiopia (NBE), they play a vital role for the development of small and microcredit, particularly in the rural parts of the country.
(1987), Begashaw (1987) and Aredo (1993),which brought to light the nature and relative economic importance of this sector in Ethiopia. However, there are still different aspects of the sector which need further investigation. For example, no attempt has been made to investigate the efficiency of semiformal sectors (i.e., saving and credit cooperatives). The literature to date has focused only on the formal sector (bank) and has neglected the semiformal sector
of SACCOs. Little empirical evidence has been generated to measure the efficiency of SACCOs.
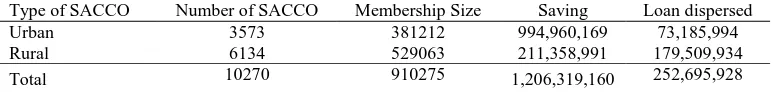
Table 1 presents the status of SACCO in Ethiopia in terms of number, membership, savings and loan dispersed in 2012. The table reveals that despite the importance of commercial banks, organizations based on cooperative model remained the dominant financial product/service provider. Moreover, SACCOs compete with other institutions in saving markets as well as lending markets.
Table 1. Status of SACCOs in terms of number, membership, savings and loan dispersed.
Type of SACCO Number of SACCO Membership Size Saving Loan dispersed
Urban 3573 381212 994,960,169 73,185,994
Rural 6134 529063 211,358,991 179,509,934
Total 10270 910275 1,206,319,160 252,695,928
Source: FCA (2012).
Though the purposes of financial cooperatives in Ethiopia are distinct, the soundness of every organization is important as these institutions contribute towards maintaining confidence in the system. Hence, providing efficient financial services can be a critical element of an effective poverty reduction and rural development strategy and also contributes to the development of the overall financial system through integration of financial markets (ADB, 2000). Although significant progress has been made in recent years, many rural financial institutions generally have insufficient capital, reach, and capacity to provide agricultural cooperatives with services at the scale they need. The provision of efficient financial products and services plays a key role in developing a robust sector and in enhancing outreach which in turn will lead to greater economies of scale, thereby improving profitability and enhancing sustainability (Sebhatu, 2012). Given this background, the SACCO sector in Ethiopia needs structural changes for diversification of its activities to enhance self-sufficiency and provide access for rural people. For the SACCOs to perform, grow and achieve sustainability while at the same time proving to be the instruments of development and poverty alleviation by mobilizing small savings from the members and diversify them to the productive use in the agricultural sector, it is relevant and appropriate to study the relative efficiency of SACCOs in Tigrai region.
Objectives of the Study
The main objective of this research is to examine the overall efficiency of rural SACCOs in Tigrai region
(Ethiopia). A comparative analysis is undertaken to identify the relative levels of SACCOs with controls for size and geographical areas of operations. The next section reviews the literature related to efficiency in financial institutions and relates this literature to develop methodology and the measurement of efficiency of SACCOs.
Research Questions
Based on the above facts, this study seeks to address the following research questions:
-Do the SACCOs in Tigrai region operate efficiently in providing financial products/services?
-Does the size of the SACCOs affect their efficiency? -Does the location of the SACCOs affect their efficiency?
Overview of SACCO in Tigrai Region
households, primarily farmers and microenterprises in rural areas of Tigrai region (Kifle, 2012).
The members rely on their own capital (shares) to foster their economic development through access to financial services-savings and credit. Since 2002, several rural SACCOs have been established in the
region in collaboration with development organizations such as VOCA. Their appeal to rural people is spreading rapidly; while demand is evidenced by rapid growth rates in membership and average sizes of loans dispersed and deposits. .
Table 2. Depth of outreach rural SACCOs.
Indicators 2012
No of SACCO 793
Number of members 120,607
Percent of women members 38.8%
Saving (Million Birr) 41.4
Capital /Share (Million Birr) 11.4
Loan disbursed (Million Birr) 70.8
Total Asset (Million Birr) 113.8
Source: Regional Cooperative Agency (2012).
As of June 2012, the number of rural SACCOs has reached 793 with active total membership of 120,607 of which the percentage of women members were 38.8 %( n= 46,796). These SACCOs pulled a saving amount of 41.4 Million Birr (2.36 MillionUSD), with 11.4 Million Birr (64,7648USD) in share capital. Their share capital and savings are invested in a 70.8Million Birr (4.03Million USD) loan portfolio that finances their microenterprises and agricultural activities. However, the SACCOs provide less than
one percent of the country’s total financing, and
many struggle with low-capacity management and governance (Kifle, 2012).
Literature Review
The two principal method of studying comparative efficiency are parametric and non-parametric methods. Stochastic Frontier Analysis (SFA) is a parametric method which determines comparative efficiency levels by hypothesizing a functional form. Data Envelopment Analysis (DEA), conversely, is a non-parametric method which employs mathematical programming /linear programming model (Coelli et al., 1998). The popularity of DEA rests on its capability to consider multiple inputs and outputs for calculating relative efficiency. DEA comes up with a single scalar value as a measure of efficiency and does not requires any specification of functional forms as is required under parametric models.
DEA is a linear programming model used to measure technical efficiency. It comes up with a single scalar value as a measure of efficiency. Efficiency of any firm can be defined in terms of either output maximization for a set of inputs or
input minimization for a given output. In DEA, relative efficiencies of a set of decision-making units (DMUs) are calculated. Each DMU is assigned the highest possible efficiency score by optimally weighing the inputs and outputs. DEA constructs an efficient frontier composed of those firms that consume as little input as possible while producing as much output as possible. Those firms that comprise the frontier are efficient, while those firms below the efficient frontier are inefficient. For every inefficient DMU, DEA identifies a set of corresponding benchmark efficient units (Coelli et al., 1998). Generally, DEA evaluates the efficiency of a given firm, in a given industry, compared to the best performing firms in that industry by considering many inputs and outputs. Thus, it is a relative measurement.
Many efficiency studies related to banks and financial institutions using DEA method have been carried out in different countries, in different contexts. Studies by Taylor et al., (1997) of Mexican banks, Brockett et al., (1997) of American banks, Schaffnit, Rosen and Parade (1997) of large Canadian banks, Soteriou and Zenios (1999) of Cyprus Commercial banks, Kao and Liu,(2004) of Taiwanese Commercial banks, Portela and Thanassoulis (2007) of Portuguese banks and Jayamaha and Mula (2011) of cooperative rural banks in Sri Lanka are a few of the efficiency studies in the banking sector.
Overview of the Study Area
The Tigrai region of Ethiopia located between in 120
59’E longitude. The region is bordered with Eritrea to the north, to the west by the Sudan, to the south by the Amhara national regional state, and to the east by
the afar national regional state. Mekelle city is the capital of the national state of Tigray region, which is the political and commercial center of the region.
Figure 1. Map of Tigrai region.
Sample and Data of the Study
As discussed previously, saving and credit cooperatives (SACCOs) remained the dominant financial service providers in rural areas of the country in terms of financial services, number and membership. As of June 2012, there were 793 rural SACCOs operating throughout the Tigrai region. However, due to lack of completed data, this study considered only 329 SACCOs operating in all 36 districts of the region. Secondary data are used to analyze the efficiency of SACCOs. Data are obtained from the annual financial statements and annual reports of the Federal Cooperative Agency (FCA) and Regional Cooperative Promotion Agency for the year 2012. Other relevant data are obtained from various internal reports and other official documents of SACCOs.
Inputs and Outputs
There is considerable debate in the banking literature about what constitute input and output of banking industry (Casu, 2002; Sathye, 2003). Two different approaches appear in the literature regarding the measurement of inputs and outputs of the bank.
measured in terms of the number of accounts. This approach considers only operating costs and excludes the interest expenses paid on deposits since deposits are viewed as outputs. Although the intermediation approach is most commonly used in the empirical studies, neither approach is completely satisfactory, largely because the deposits have both inputs and output characteristics which are not easily disaggregated empirically.
Berger and Humphrey (1997) suggested that the intermediation approach is best suited for analyzing bank level efficiency, whereas the production approach is well suited for measuring branch level efficiency. This is because, at the bank level, management will aim to reduce total costs and not just non-interest expenses, while at the branch level a large number of customer service processing take place and bank funding and investment decisions are mostly not under the control of branches. Also, in practice, the availability of data required by the
production approach is usually rare. Therefore, following Berger and Humphrey (1997), we have selected intermediation approach as opposed to the production approach for selecting input and output variables in the present study.
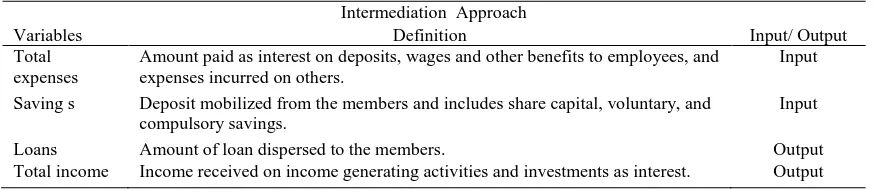
The efficiency scores are estimated for individual SACCOs and mean efficiency scores are calculated for the sample as a whole. In terms of size and geographical location estimated efficiencies are also examined with mean estimated scores over the study year. Moreover, correlation coefficients for inputs and outputs variables are estimated. Thus, a total of 329 observations were used for DEA efficiency analysis in this study. Savings, and total expenses have been identified as inputs and loans and total income have been identified as outputs. The following table presents the input-output specifications. These inputs and outputs are identified from prior studies suitable of this study.
Table 3. Input-output specifications.
Intermediation Approach
Variables Definition Input/ Output
Total expenses
Amount paid as interest on deposits, wages and other benefits to employees, and expenses incurred on others.
Input
Saving s Deposit mobilized from the members and includes share capital, voluntary, and compulsory savings.
Input
Loans Amount of loan dispersed to the members. Output Total income Income received on income generating activities and investments as interest. Output
Discussion and Analysis
The correlation coefficients show all variables have positive and significant relationship with each other. In regard to the estimated coefficients all output variables (loans and income) are positively and significantly correlated with deposits and expense. In particular, the association has a very high correlation of over 0.80 in some cases. These statistically
significant and positive correlations among the variables provide further support for the appropriateness of the selected variables in the DEA model in this research. Overall, the correlation results show that change in one variable can be expected to impact the overall efficiency of the SACCOs. The reminder of this section discusses the efficiency of SACCOs based on estimated DEA scores.
Table 4. Descriptive statistics of inputs and outputs in DEA models.
Input/output Savings Loans Income
Loans 0.870
(0.000)
Income 0.284
(0.000)
0.353 (0.000)
Expense 0.224
(0.000)
0.312 (0.000)
0.442 (0.000)
Efficiency Score
The efficiency measures computed in our study are relative in nature. The performance of a SACCO is not assessed in an absolute manner but is compared with the best in the industry. The sources of inefficiency can be determined by comparing the relative sizes of various efficiency measures. The estimated efficiency scores for each DMU and the estimated mean efficiency scores are in the appendix.
To estimate the performance and efficiency of the financial cooperatives, several models with different variables are estimated. The DEA model under variable return to scale (VRS) can provide a better indication of the relative performance of the SACCOs. TE represents technical efficiency in the
Charnes, Cooper and Rhodes’s (CCR) model in VRS
and SE represents scale efficiency with VRS. The summary of estimated results for efficiency is presented in Table 5.
Table 5. Summary of efficiency scores.
Description No of DMUs evaluated Efficient Inefficient
Descriptive Statistics
Mean Max Min SD
VRS 329 18 311 0.213 1.000 0.008 0.256
SE 329 7 322 0.770 1.000 0.053 0.256
TE = Technical efficiency SE = Scale efficiency.
The results for the DEA run with variable returns to scale indicate that the average technical relative efficiency is 0.213, which means that overall technical inefficiency of SACCOs is to the tune of 79% in the year 2012. Of 329 SACCOs, 18 SACCOs are identified as “relatively efficient” with technical efficiency score equal to one. The remaining 311
SACCOs have been found to be “relatively inefficient” with efficiency score less than one in the same year. The inefficient SACCOs can improve their efficiency by decreasing resource inputs and increasing outputs. In other words, it implies that the SACCOs will be maximizing the output at given inputs or minimizing the inputs at given out put level depending on the amount of resource utilized.
As can be seen from the annexed table, most of the SACCOs are inefficient with a very low overall efficiency score of 0.213. This indicates that there is huge possibility for the SACCOs to improve their efficiency through improved utilization of their
inputs and outputs. It should be clear that there are only 18 SACCOs which are efficient, and these are, in fact, efficient in relative terms. More specifically, the DEA result clearly shows the targets for the inefficient SACCOs. For instance, if we take SACCO No. 10, it was compared against SACCO No. 252, 233, and 300. If SACCO No. 10 is to be as relatively efficient as its peers (which are listed in the appendix), it has to reduce its expenses by 61% and increase its loan amount and income 6.4times the current level. The same analysis could be made about the other relatively inefficient ones too.
Efficiency analysis by size
Only one metric is used to measure the size of the sample SACCOs; i.e., amount of capital. A three tier size classification system is defined in Table 6. The percentage of the sample for the small, medium and large categories are also shown.
Table 6. Size metric of the sample.
Size Large Medium Small Scale
Capital 19% 18% 63% Large = More than 200 thousand Birr, Medium=100 thousand to 200 thousand Birr, Small=below 100 thousand Birr
As shown in Table 6 specific size categories have been determined at the researchers’ discretion. Based on the capital size of the DMUs, majority (63%) of the sample are below 100,000 Birr capital balances and are considered as small scale. DMUs with Capital balances over 200,000Birr are grouped as large scale and account for 19% of the total. 18% of
Figure 2: TE and size.
The TE efficiency score of large scale categories was 41%, during the year 2012. Small scale and medium scale DMUs had TE scores of 17% and 16% respectively. The estimated overall mean of TE score were higher for larger DMUs compared to medium and small size DMUs (see Figure 2).
Efficiency analysis by location
Efficiency scores are examined to see whether geographical disparity affects the efficiency of the SACCOs. Table below presents the mean efficiency scores by zone calculating the overall mean efficiency of each DMU.
Table 7. Mean efficiency by location
S/No Zone Mean TE No of efficient SACCOs No inefficient SACCOs
%age of Efficient SACCOs
1 South 0.276 4 65 6.15%
2 South East 0.221 0 35 0%
3 Eastern 0.137 2 69 2.9%
4 Central 0.201 7 104 6.73%
5 Western 0.259 5 38 13.16%
As can be seen from the table above, the Eastern and South East zones had the lowest proportion of relatively efficient SACCOs. In fact, though South East zone had none of its SACCOs with a relative efficiency score of one, its overall mean efficiency score was greater than that of Eastern zone. In relative terms, the other three zones had better number of efficient SACCOs. It looks like the location factor has effect on efficiency but this requires further investigation taking different approaches.
Findings and Conclusion
The primary objective in this study was to assess overall efficiency of SACCOs in Tigrai region by taking 329 rural SACCOs which were operating in the year 2012. It was found that majority of SACCOs were less efficient over the study year and did not use
their inputs efficiently. However, it is found that there were significant differences in the efficiency of SACCOs by geographical locations and size. It is noted that size really matters when it comes to efficiency of SACCOs.
survival of the institutions. Further work could extend our research in various directions not considered in this study. First, the efficiency of SACCOs could be compared with that of microfinance. Second, subject to data availability over a longer period that would result in a higher sample, one could examine the technical efficiency using stochastic frontier analysis.
Limitations of the Study
This study is based on secondary data collected from annual reports of Regional Cooperative Promotion Agency. These are compiled from SACCOs’ financial statements; even if audited, they may not be strictly accurate and comparable. This could somehow affect the findings. The level of variation in disclosure across the sample is also a limitation. Hence, the sufficiency, reliability, and validity of data are subject to the above limitations. Further, this study focused on only one type of cooperative, namely SACCOs’. No attempt has been made to assess the efficiency of different types of cooperative operating in Tigrai region. Other types of cooperatives such as Multipurpose, agricultural marketing cooperatives may or may not have similar issues, but this study does not attempt to provide evidence for other cooperatives. In general, subject to the data limitations discussed above, the analysis of efficiency in this study is based on SACCOs and different to generalize for the whole cooperative society so the results obtained must be treated with caution.
References
Aredo, D. (1993). The informal and semi-formal financial sectors in Ethiopia: A study of the Iqqub, Iddir, and Savings and Credit Co-operatives: African Economic Research Consortium.
Banker, R., Charnes, A., & Cooper, W. (1984). Some models for estimating technical and scale inefficiencies in data envelopment analysis. Management Science,30(9),1078-1092. Begashaw, G. (1978). The economic role of traditional savings and
credit institutions in ethiopia/le role economique des institutions traditionnelles d'epargne et de credit en ethiopie. Savings and Development, 249-264.
Berger, A., & Humphrey, D. (1997). Efficiency of financial institutions: International survey and directions for future research. European Journal of Operational Research, 98(2), 175-212.
Brockett, P., Charnes, A., Cooper, W., Huang, Z., & Sun, D. (1997). Data transformations in DEA cone ratio envelopment
approaches for monitoring bank performances. European Journal of Operational Research, 98(2), 250-268.
Casu, B., Girardone, C., & Molyneux, P. (2004). Productivity change in European banking: A comparison of parametric and non-parametric approaches. Journal of Banking and Finance, 28(10), 2521-2540.
Coelli, T., Rao, D., O'Donnell, C., & Battese, G. (2005). An introduction to efficiency and productivity analysis: Springer. Delis, M., & Papanikolaou, N.(2009). Determinants of bank efficiency: evidence from a semi-parametric methodology. Managerial Finance, 35(3), 260-275.
Goddard, J., Molyneux, P., Wilson, J., & Tavakoli, M. (2007). European banking: An overview. Journal of Banking & Finance, 31(7), 1911-1935.
Humphrey, D.(1985). Cost and scale economies in bank intermediation. Handbook for Banking Strategy, New York: John Wiley and Sons, 745-783.
Jackson, P., & Fethi, M.(2000). Evaluating the efficiency of Turkish commercial banks: An application of DEA and Tobit Analysis.
Jayamaha, A., & Mula, J.(2011). Best Financial Practices Analysis and Efficiency of Small Financial Institutions: Evidence from Cooperative Rural Banks in Sri Lanka. Journal of Emerging Trends in Economics and Management Sciences (JETEMS), 2(1), 22-31.
Kao, C., & Liu, S.(2004). Predicting bank performance with financial forecasts: A case of Taiwan commercial banks. Journal of Banking & Finance, 28(10), 2353-2368. Mostafa, M. (2007). Benchmarking top Arab banks' efficiency
through efficient frontier analysis. Industrial Management and Data Systems, 107(6), 802-823.
Mukherjee, A., Nath, P., & Pal, M.(2002). Performance benchmarking and strategic homogeneity of Indian banks. International Journal of Bank Marketing, 20(3), 122-139. Portela, M., & Thanassoulis, E. (2007). Comparative efficiency
analysis of Portuguese bank branches. European Journal of Operational Resea rch, 177(2), 1275-1288.
Sathye, M. (2003). Efficiency of banks in a developing economy: the case of India. European Journal of Operational Research, 148(3), 662-671.
Schaffnit, C., Rosen, D., & Paradi, J.(1997). Best practice analysis of bank branches: an application of DEA in a large Canadian bank. European Journal of Operational Research, 98(2), 269-289.
Sealey, C., & Lindley, J.(2012). Inputs, outputs, and a theory of production and cost at depository financial institutions. The Journal of Finance, 32(4), 1251-1266.
Sebhatu, K. (2012a). Determinants of saving Behaviour of cooperative members survey evidence from Tigrai region, Ethiopia. Journal of Research in Economics and International Finance (JREIF) 1, 150-158.
Sebhatu, K. (2012b). The Impact of Savings and Credit Cooperatives in Ofla Wereda Tigray Region of Ethiopia. European Journal of Business and Management, 4(3), 78-90. Sebhatu, K.(2012c). Management of Savings and Credit Cooperatives from the Perspective of Outreach and Sustainability: Evidence from Southern Tigrai of Ethiopia. Research Journal of Finance and Accounting, 2(7-8), 10-23. Soteriou, A., & Zenios, S. (1999). Using data envelopment
analysis for costing bank products. European Journal of Operational Research, 114(2), 234-248.
Taylor, W., Thompson, R., Thrall, R. , & Dharmapala, P. (1997). DEA/AR efficiency and profitability of Mexican banks a total income model. European Journal of Operational Research, 98(2), 346-363.
S/No DMU Vrste S/No DMU Vrste S/No DMU Vrste S/No DMU Vrste
1 Z/Hiwot 1.000 43 Kulu Gizea Lemlem 0.088 86 Lemlem 0.167 128 Kudus- Micheal 0.094
2 Bruh Tesfa 0.194 44 Millinum Hayalo 0.089 87 Sh/Lemlem 0.267 129 Fana 0.027
3 Lemlem Raya 0.300 45 Felege Hiwot 0.075 88 Weini 0.096 130 Fithanegest 0.061
4 Hadash Berhan 0.100 46 Marta 0.140 89 Teabe 0.141 131 Zemenawit 0.373
5 Delit 0.091 47 Awshra 0.131 90 Hayki-Hilet 0.066 132 Kokob 0.077
6 Alem- Berhan 0.274 48 Belay Abera 0.428 91 Gelaw Awhi 0.205 133 Miebale 0.020
7 Berhan 0.117 49 Adis Zemen 0.055 92 Hedasie 0.055 134 Azmera 0.074
8 H/Gezie/ Genet 0.163 50 Shaina 0.543 93 Tembian-Trae 0.297 135 Maebel 0.020
9 Jon-umer 0.083 51 Tsehaynesh 0.101 94 Aedi -Gezaeti 0.310 136 Lewti 0.079
10 Tazma 0.135 52 Lemlemitu Korem 0.104 95 Enda -Korar 0.539 137 Meraya 0.062
11 Hawelti/Weregba 0.072 53 Kidana 0.304 96 Mizan 0.086 138 Fre-Marta 0.035
12 Awet 0.061 54 Berhane sofia 0.118 97 Megeseta 0.139 139 Weini 0.108
13 Fre-Alaje 0.352 55 Embeba Haya 0.846 98 Delit 0.122 140 Fre-Saz 0.102
14 Shewit Betmara 0.061 56 Haftamnesh 0.459 99 Debre Nazret 0.014 141 Welegesa 0.089
15 Hadnet Chelena 0.602 57 Millinum 1.000 100 Abeba 0.026 142 Fre-Lemeat 0.073
16 Tirhas Dila 0.181 58 Kulu Gizea Lemlem 0.092 101 Chini 0.016 143 Zemen 0.070
17 Simret 0.229 59 Millinum Hayalo 0.126 102 Adi -Edaga 0.037 144 Lemeat Mama 0.127
18 Selam Seret 0.028 60 Felege Hiwot 0.059 103 Enda ba- Hadera 0.047 145 Sasun 1.000
19 Genet Telma 0.231 61 Mulu Berhan 0.387 104 Admas 0.220 146 Shewit 0.294
20 Bruh Tesfa 0.297 62 Lemlem - Sala 0.487 105 Birki 0.116 147 Lemlem 0.288
21 Zewel-Ayba 0.082 63 Tekli- bebizwa 0.298 106 Selam 0.099 148 Tsige Reda 1.000
22 Felege Hiwot 0.071 64 Gereb Ayni 0.296 107 Addis Alem 0.047 149 Embeba 0.275
23 Lemlem Tika 0.114 65 Meda Berba 0.135 108 Negash 0.121 150 Hibret 0.192
24 Fre-Sewuat 0.081 66 Berhan- Tsibet 0.444 109 ZaaNa 0.030 151 Meseret 0.033
25 Genet-Kilma 0.073 67 Gedamu 0.228 110 Ezana -Sizana 0.012 152 Alemtsehay 0.076
26 Yekatit 0.092 68 Freweyni 0.273 111 Samra 0.172 153 Millinium 0.267
27 Endodo 1.000 69 Hiwot lemlem 0.204 112 Genet 0.234 154 Awet 0.051
28 Meseret 0.763 70 Fre Zemen 0.221 113 Lemeat 0.148 155 Hiwot 0.071
29 Embeba Hashenge 0.420 71 Lemlem Fithawit 0.041 114 Sur-Millinium 0.259 156 Hawelti 0.126
30 Mulu -Berhan 0.349 72 Millinium 0.083 115 Addis Alem 0.162 157 Weini 0.050
31 Berhan Sesela 0.231 73 L/M/Tekli 0.121 116 Selam 0.107 158 Sigem 0.039
32 Gereb Weine 1.000 74 Debre Hayla 0.589 117 Ebyet 0.072 159 Andi-Lemeat 0.051
33 Fre-limeat 0.090 75 Samrawit 0.363 118 Fre-Weini 0.130 160 Tesfa 0.055
34 Freweine 0.054 76 Netsanet 0.101 119 Dejen 0.089 161 Selam 0.033
35 Zata Hiwot 0.517 77 Fithawit 0.120 120 Shewit 0.056 162 KidistMariam 0.011
36 Nigsti Zata 0.105 78 Hadnet 0.727 121 Bruh Tesfa 0.122 163 Bruh Tesfa 0.080
37 Addisalem 0.145 79 Lemlem Cheli 0.306 122 Hadnet 0.077 164 Danait 0.102
38 Senay 0.534 80 Kokob1 0.877 123 Kisanet 0.031 165 Marta 0.141
39 Alem Berhan 0.381 81 Maernet 0.521 124 Hiwot 0.057 166 Awlie-Tsero 0.038
40 Lemlem -Ofla 0.150 82 Ahadu 0.076 125 Shewit lemlem 0.032 167 Nestanet 0.124
41 Tsige Reda 0.103 84 Shewit Hintsa 0.476 126 Emnet 0.221 168 Berhan 0.059
42 Fikre- Welda 0.636 85 Yikaal 0.259 127 Simret 0.097 169 Erope 0.606
S/No DMU Vrste S/No DMU Vrste S/No DMU Vrste S/No DMU Vrste
170 Selam 0.226 213 Selam 0.046 256 Medhin-Alem 0.145 299 Millinium 0.364
171 Kudus- Gergise 0.071 214 Semhal 0.062 257 May-Nigus 1.000 300 Selam 1.000
172 Asimba 0.102 215 Fre-Suwaat 0.024 258 Hadnet 0.062 301 Lekatit 0.038
173 Sibagadis 0.110 216 Tsilale_Daero 0.143 259 Man-Sagla 0.050 302 Awet 0.095
174 Halo 0.046 217 Felafel 0.027 260 Fana 0.251 303 Maernet 0.377
176 Tanqa-Milash 0.681 219 Maebel 0.038 262 Seti-Semhal 0.254 305 Kokob 1.000
177 Dalgoa 0.137 220 Meseret 0.027 263 Danabit 0.075 306 Lemlem 0.014
178 Genet 1.000 221 Fre-selam 0.025 264 Weini 0.151 307 Wihdet 0.333
179 Millinium 0.548 222 Millinium 0.035 265 Nigste-Saba 0.253 308 Tsiniet 0.271
180 R/mal 0.123 223 Fre-Lemeat 0.060 266 Ebyet 0.106 309 Mihznet 0.126
181 Fre-Tsaeri 0.078 224 Selam 0.042 267 Hadnet 0.161 310 Weini 0.035
182 H/Serawe 1.000 225 Fre-Jeganu 0.015 268 Tsilal 0.073 311 Capital 0.444
183 Filfil 0.519 226 Shewit 0.032 269 Lemeat 0.020 312 Filfil 0.008
184 Rahwa 0.078 227 Wihdet 0.039 270 Maydaero 0.097 313 Ruba-Bayta 0.024
185 Kokob-Tsibah 0.490 228 Hiwot-Lemeat 0.122 271 Awet 0.010 314 Bruh-Tesfa 0.083
186 Abzat 0.686 229 Lahmat 0.021 272 Selalwa 0.145 315 Kedawit 0.016
187 N/Berhane 0.264 230 Sesen 0.012 273 Fre-lemeat 0.205 316 Hamlawit 0.091
188 Wegahta 0.231 231 Milyenu 0.032 274 Mariam-Tamba 0.048 317 Fre-Lemaet 0.011
189 Shushayna 1.000 232 Hadnet 0.076 275 Genet 0.079 318 Zala-Ambesa 0.038
190 Wer-Reba 0.576 233 Rahwa 1.000 276 Madi-Hiwot 0.071 319 Seberom 0.069
191 Almeda 0.217 234 Kokob 0.051 277 Shewit 0.023 320 Ayfa 0.100
192 Enda-ba-Gerima 0.256 235 Kisanet 0.014 278 Kokob3 0.067 321 Marta 0.123
193 May-shingurti 0.243 236 Firyat 0.026 279 Fithawit 0.043 322 Frehiwot 0.101
194 Adi-Berak 0.218 237 Fithawit 0.138 280 Weini 0.104 323 Adi-Awala 0.424
195 Laelay-Legomti 0.041 238 Awet 0.020 281 Haftom 0.033 324 Rahwa 1.000
196 Fre-Lemeat 0.116 239 Hibret 0.012 282 Mesert 0.055 325 Wihdet 0.037
197 Mahbre-Selam 0.153 240 Marta 0.038 283 Weini-Selam 0.022 326 Sur 1.000
198 Tahtai-Legomti 0.088 241 Tesfa 0.028 284 Kisanet 0.058 327 Walya 1.000
199 Miebale 0.065 242 Kedawit 0.030 285 Mayliham 0.533 328 Bahre-Selam 0.897
200 Kokob-Tsibah 0.136 243 Haregeweini 0.068 286 Kewanit 0.119 329 Kebabo4 0.139
201 Erdi-Jeganu 0.065 244 Segem 0.053 287 Taba-Weyane 0.179 Mean 0.213
202 Tub-Gorzo 0.015 245 Senay 0.063 288 Letencheal 0.215
203 Finote-Selam 0.099 246 Maernet 0.056 289 Lemlem 0.082
204 Bruh-Tesfa 0.436 247 Rahwa 0.058 290 Silas 0.036
205 Maebel 0.149 248 Hadas-Raei 0.110 291 Eleni 0.025
206 Yiha 0.033 249 Gelila 0.015 292 Arkebet 0.157
207 Tsediya 0.429 250 Rahwa 0.108 293 Filfil -sene 0.050
208 Kokob 0.836 251 Lemlem 0.067 294 Fre-Hiwot 0.017
209 Dejen 0.265 252 Shewit 1.000 295 Metkel 0.267
210 Bruh-Tesfa 1.000 253 Daero-Mishilam 0.043 296 Miebale 0.075
211 Kola-Geble 0.087 254 Kidus-michael 0.174 297 Hadnet 0.246