Determinants of systolic blood pressure in Indonesian elderly men:
In factor analysis perspective
(A study in four Indonesian big cities)
Sudijanto Kamso*, Purwantyastuti
Abstract
Tujuan penelitian ini adalah untuk mengetahui determinan tekanan darah sistolik pada kelompok lanjut usia pria. Suatu studi dengan rancangan ‘cross sectional’ dilakukan di 4 kota besar di Indonesia dengan menggunakan metoda ‘multistage random sampling’. Jumlah responden 320 orang lanjut usia pria, yang merupakan sub-sampel dari 981 responden pada penelitian yang lebih besar. Pengumpulan data dilakukan dengan pengukuran antropometri, analisa biokimia darah, analisa asupan makanan, dan pengukuran indeks aktivitas dan angka stress. Penentuan determinan tekanan darah sistolik pada kelompok lanjut usia pria, dilakukan dengan menggunakan 2 tehnik analisa statistik multivariat; regesi linear ganda langsung pada independen variabel awal, dan regesi linear ganda yang dilakukan pada komponen-komponen yang dihasilkan dari analisa faktor. Kedua tehnik analisa statistik ini menghasilkan gambaran determinan tekanan darah sistolik yang tidak bertentangan. Analisa regesi linear ganda langsung pada independen variabel awal menghasilkan massa lemak tubuh, dan LDL kolesterol sebagai determinan tekanan darah sistolik pada lanjut usia pria. Analisa regesi linear ganda menggunakan komponen-komponen yang dihasilkan dari analisa faktor menghasilkan massa lemak tubuh, indeks massa tubuh, jumlah massa lemak bawah kulit dan lingkar perut sebagai determinan tekanan darah sistolik pada lanjut usia pria. (Med J Indones 2006; 15:115-20)
Abstract
The objective of this study was to assess the determinants of systolic blood pressure in elderly men. A cross sectional study was undertaken in 4 big cities in Indonesia using multistage random sampling. The respondents were 320 elderly men who were the sub-sample of 981 sub-sample of a larger population study. Data were collected through anthropometric measurements, biochemical blood analysis, nutrient intake assessment, activity index and stress score. Two type of statistical analysis techniques were used to determine the determinants of systolic blood pressure in elderly men; multiple regression analysis and factor analysis. This study shows that determinants of systolic blood pressure, analyzed with these two types of analysis, multiple regression and factor analysis, resulting in no contradictory result. Direct multiple regression analysis to all independent variables showed that there was correlation between systolic blood pressure with fat mass, and LDL cholesterol. Multiple regression analysis to components resulting from factor analysis showed that there was positive correlation between systolic blood pressure with fat mass, body mass index (BMI), sum of skin-folds and waist circumference. (Med J Indones 2006; 15:115-20)
Keywords: Systolic blood pressure, fat mass, LDL cholesterol, body mass index, sum of skin-folds, waist circumference, elderly men
Indonesia is one amongst other South East Asia Southern countries facing in increased number of older people. It is projected that by the year 2020, the number of elderly people in Indonesia will be three times the number of elderly in 1990.1
The Indonesian Household Survey showed the highest prevalence of cardiovascular diseases (CVD) and hypertension amongst individuals aged 55 and older.2 On the other side of the coin, available data on CVD risks amongst Indonesian aged population are limited, despite the fact of the importance of these data for preventive measures. Identification of CVD risks or determinants and their interplays is crucial for successful preventive intervention.
According to Indonesia Household Survey (SKRT), the highest morbidity of CVD was found in the aged group older than 55 years, and among CVD, the
* Department of Population and Biostatistics, Faculty of
Public Health, University of Indonesia, Depok, Indonesia
prevalence of hypertension was the highest.2 Results of the WHO - Five Country Study of Health of the Elderly in the Community (MONICA), Indonesia country report, also revealed that the most prevalent of CVD was hypertension, followed by coronary heart disease (CHD).3,5
Coronary heart disease, hypertensive heart disease (HHD), and stroke are the main causes of morbidity and mortality in the elderly in Indonesia, both in hospital and community settings. Elderly with myocardial infarction had higher mortality than their younger counterparts. Mortality rate of CVD (per 100.000) for Indonesia (urban and rural) in 1995 was 67.8.2,4
Indonesia is a nation in transition with double burden of malnutrition. Under-nutrition is rampant in the aged individuals. Furthermore, there is paradigm shift on the understanding of nutrition related degenerative diseases. Degenerative disease like coronary heart disease was previously recognized as related to over-nutrition, it is now well documented to be related to several aspects of risk factors, such as fat mass, lipid profile, nutrient intake and life style. It is therefore, timely to have better understanding on the relations of fat mass, lipid profile, nutrient intake and life style indicators with systolic blood pressure in the Indonesian elderly.
METHODS
This study was conducted by using cross-sectional method. Population of this study was elderly between 55-85 years old. that were spreading in four big cities around Indonesia; namely Jakarta, Padang, Bandung and Yogjakarta. The subjects’ criterions were: look healthy and still able to walk. Respondents were taken from group of elderly who lives among community, those who live independently or live together with their family members. This study employed multistage random sampling procedure. The number of samples was 320 elderly men who were sub-samples of larger population study which consist of 981 respondents. The inclusion criteria were: 55 – 85 years old and apparently healthy and ambulatory. Exclusion criteria were: bedridden, physically handicapped, inability to come to the Public Health Centre (PHC), or any condition, which would make the elderly, in the opinion of the principal investigator, unsuitable for the study; for instance mentally ill elderly.
Fasting blood samples were taken from the subjects and biochemistry analysis was conducted in the Regional Health Laboratory. Anthropometric assessment was conducted according to standard procedure. All measurements were done twice, and the average was used for further analysis. Serum total cholesterol (TC) was measured using the cholesterol oxydase method supplied by Boehringer, LDL cholesterol (LDLC) was measured using the precipitation polyvinyl suphate (PPS) method and serum triglycerides were measured using an enzymatic test.
Dietary 24-hour recall method was applied to estimate daily nutrient intakes. The WorldFood2, Dietary Assessment System developed by INFOODS (the International Network of Food Data Systems) and University of California under the auspices of FAO, was used to convert foods into nutrients. Baecke Physical Activity Scale (using questionnaire) was used to measure physical activity index (daily activity score) of the respondent, consisted of Works Index, Sport Index and Leisure Index.6 Measurement of stress score was based on The A/B Life Style Questionnaire developed by Edward and Ronald.7 Life style factors in this study were represented by physical activity and stress.
A multiple linear regression analyses were performed to examine as to what extent the variation in systolic blood pressure was explainable by anthropometric indices, lipid profiles, nutrient intake or life-style variables. Independent variables collected in this study were analyzed again with factor analysis to assess the structure of correlation among independent variables.8 Components resulting from factor analysis were analyzed further with multiple linear regressions to find the association between these components and systolic blood pressure in elderly men. Independent variables in the model, were adjusted for age and smoking.
RESULTS
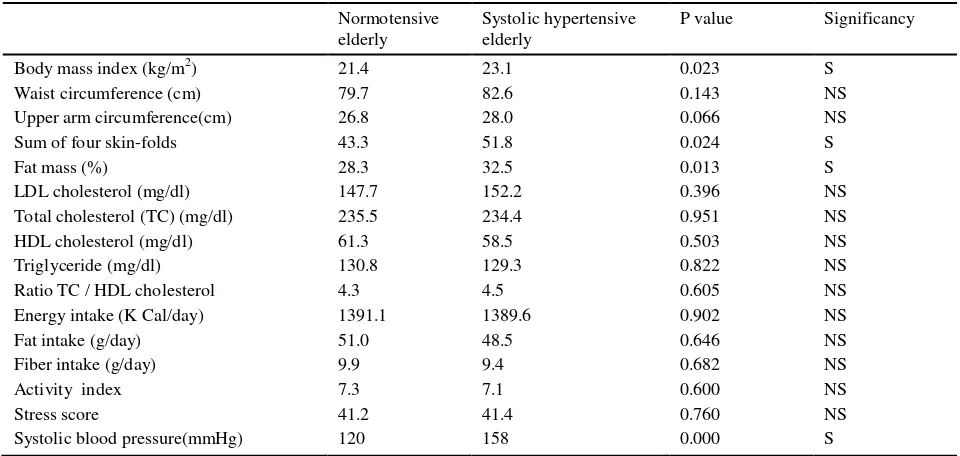
Table 1 presents the descriptive statistics of selected anthropometric measurement, lipid profile, nutrient intake and life style factors of the elderly men by systolic hypertension status of the study population after adjustment for age. Systolic hypertensive elderly men had higher and significantly different body mass index, sum of four skin-folds, and fat mass percent, than normotensive elderly.
Determinants of systolic blood pressure using multiple linear regression analyses were shows in Table 2. This table presents determinants of SBP in elderly men. Fat mass, and LDL cholesterol had positive correlation with systolic blood pressure (SBP) and contributed 2.70 % and 2.22 % to its variation respectively. This table shows that fat mass had higher contribution to the variation of systolic blood pressure, compare to LDL cholesterol as a part of lipid profile.
Table 1. Anthropometric measurement, lipid profile, nutrient intake and life style factors of the elderly men by systolic hypertension status in four big cities in Indonesia, in the year 2000
Normotensive elderly
Systolic hypertensive elderly
P value Significancy
Body mass index (kg/m2) 21.4 23.1 0.023 S
Waist circumference (cm) 79.7 82.6 0.143 NS
Upper arm circumference(cm) 26.8 28.0 0.066 NS
Sum of four skin-folds 43.3 51.8 0.024 S
Fat mass (%) 28.3 32.5 0.013 S
LDL cholesterol (mg/dl) 147.7 152.2 0.396 NS
Total cholesterol (TC) (mg/dl) 235.5 234.4 0.951 NS
HDL cholesterol (mg/dl) 61.3 58.5 0.503 NS
Triglyceride (mg/dl) 130.8 129.3 0.822 NS
Ratio TC / HDL cholesterol 4.3 4.5 0.605 NS
Energy intake (K Cal/day) 1391.1 1389.6 0.902 NS
Fat intake (g/day) 51.0 48.5 0.646 NS
Fiber intake (g/day) 9.9 9.4 0.682 NS
Activity index 7.3 7.1 0.600 NS
Stress score 41.2 41.4 0.760 NS
Systolic blood pressure(mmHg) 120 158 0.000 S
S : significance (p<0.05) ; NS : non significance
Table 2. Determinants of systolic blood pressure in elderly men
Regression coefficient
Determinants Parameter Standard Partial R2
Estimate Error (x 100)
FMP .458 .197 2.70
LDL cholesterol .098 .047 2.22
Smoking -8.446 3.426 3.13
Percent variance explained by the model Constant
Significance of the model
7.7% 115.651
All independent variables in this study were analyzed with factor analysis technique to get components as summarization or data reduction. Table 3 shows components resulting from analysis factor.
This table shows that independent variables associated with SBP, can be divided into 4 components:
1. Fat mass component consists of body mass index (BMI), fat mass percent (FMP), sum of skin-folds, waist circumference
2. Nutrient intake component consists of energy intake, fat intake, fiber intake
3. Lipid profile component consists of total cholesterol, LDL cholesterol, ratio total cholesterol /HDL cholesterol,
4. Life style component consists of activity Index, stress.
All these 4 components treated as independent variables to systolic blood pressure.
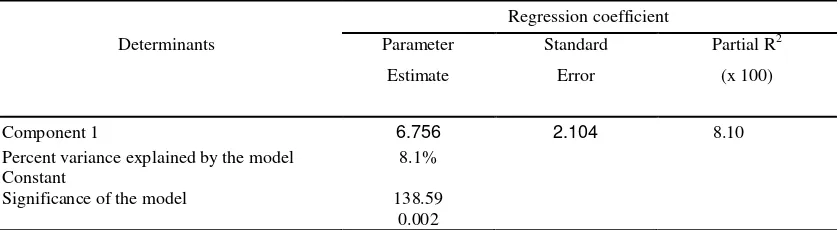
Table 4 presents determinants of systolic blood pressure in elderly men, based upon multiple regression analysis on components resulting from factor analysis. This analysis show that component 1 (fat mass), that
consist of body mass index (BMI), fat mass percent (FMP), sum of skin-folds and waist circumference is prominent determinant factor of systolic blood pressure, compare to the other components in the elderly men.
DISCUSSION
In many studies while observing various determinants of hypertension in the elderly population, questions which often arise are: what are the key factors determining the occurrence of hypertension? The interplay between nutritional factors and hypertension has been discussed in many studies.9 However; further question is worth to be asked whether there are other factors which are more prominent than nutritional factors in the elderly population, leading to the occurrence of hypertension. WHO Scientific Group reported that both nutritional and non nutritional factors such as physical activity, alcohol and stress can be additional risks to the occurrence of hyper-tension.10 Therefore; attention should be paid to all of the important risk factors rather than concentrating on one single risk factor.
Table 3. Components resulting from analysis factor
COMPONENT
1 (FAT MASS)
2
(NUTRIENT INTAKE)
3 (LIPID PROFILE)
4 (LIFE STYLE)
Body Mass Index (BMI) Energy intake LDL Cholesterol Activity Index
Fat Mass Percent (FMP) Fat intake
Ratio Total Cholesterol
/HDL Cholesterol Stress
Sum of Skinfolds Fibre intake Total Cholesterol
Waist Circumference
Table 4. Determinants of systolic blood pressure in elderly men*
Regression coefficient
Determinants Parameter Standard Partial R2
Estimate Error (x 100)
Component 1 6.756 2.104 8.10
Percent variance explained by the model Constant
Significance of the model
8.1%
138.59 0.002
The primary purpose of this study was to investigate various determinants of systolic blood pressure in the Indonesian elderly men, by observing fat mass indicator, anthropometric indicator, lipid profile, nutrient intake, life style indicator and their interactions.
As of 1993, hypertension in the elderly has a new definition. With the publication of the Fifth Joint National Commission report, new US criteria were established for the diagnosis of hypertension that applies to all ages. Hypertension according to these guidelines is diagnosed as consistent systolic blood pressure readings exceeding 140 mm Hg and or diastolic readings exceeding 90 mm Hg in all adults, whether they are elderly or not.11 This study showed that the prevalence of systolic hypertension among elderly men was quite high, 51.9% of the study population.
The prevalence found in this study was higher than other studies conducted in other areas in Indonesia, most likely because different criterion in diagnosing hypertension was used. In Monica study in Jakarta and study in Tangerang and Bogor district, hypertension was diagnosed as consistent systolic blood pressure (SBP) readings exceeding 160 mm Hg and or diastolic blood pressure (DBP) readings exceeding 95 mm Hg, while in this study systolic hypertension was diagnosed as SBP 140 mmHg.3, 12
From public health point of view, criterion of hyper-tension as SBP 140 mmHg and or DBP 90 mmHg, have an advantage, since magnitude of the problem could be detected earlier and it has implication to a better public health oriented program on hypertension.
One of the most easily recognized consequences of over-nutrition is obesity, which is a risk factor for other diseases such as non-insulin-dependent diabetes mellitus, cardiovascular disease and hypertension.
There is a positive association between SBP (systolic blood pressure) and indices of “fatness” such as body mass index (BMI), waist circumference, and sum of skin-folds. It is reported that waist circumference, an indirect index of abdominal adiposity, is positively related to both systolic and diastolic blood pressure and thus, increased waist circumference has been shown to be hazardous to health.13 Framingham Study reported that obesity was shown to be one of the major determinants of hypertension in the general population.14 Central deposition of body fat was a
more important predictor of hypertension than peripheral fat deposition. Positive correlations were found between systolic blood pressure and the waist circumference for both men and women.15,17
This study showed similar results through factor analysis, which demonstrate a strong correlation between fatness component, which consist of fat mass, body mass index (BMI), sum of skin-folds, waist circumference and systolic blood pressure.
In Cassano study, considering blood pressure as a continuous outcome variable, waist circumference was significantly positively associated with both diastolic and systolic blood pressure (p<0.001).16 Siani et al stated that in multiple regression analysis, waist circumference remained the strongest independent predictor of blood pressure.17 In Snijder study larger waist circumference was associated with higher prevalence hypertension.18 This study showed a strong correlation between fat mass with systolic blood pressure in multivariate analysis, either in multiple regression analysis or through factor analysis.
Direct multiple regression analysis to all independent variables showed that there was positive correlation between systolic hypertension with fat mass, and LDL cholesterol. Fat mass was the most significant determinant of systolic blood pressure. Multiple regression analysis to components resulting from factor analysis showed that there was positive correlation between systolic hypertension with component 1 that consists of fat mass, body mass index, sum of skin-folds and waist circumference.
This study shows that determinants of systolic blood pressure, analyzed with two types of analysis, multiple regression and factor analysis, resulting in no contradictory result. The result of the second procedure is supporting and strengthening the result of the first procedure.
CONCLUSIONS
1. Fat mass, body mass index (BMI), sum of skin-folds, waist circumference, and LDL cholesterol, were determinants of systolic blood pressure in the elderly men.
3. Determinants of systolic blood pressure, analyzed with two types of analysis, multiple regression and factor analysis, resulting in no contradictory result.
REFERENCES
1. Ananta A, Anwar EN. Projection of Indonesian population and labor force: 1995-2005. Population Projection Series: 5. The Demographic Institute, Faculty of Economics, University of Indonesia, Jakarta, 1995.
2. Department of Health. Household health survey. Dept. of Health RI Jakarta, 1995.
3. Darmojo B, Sutedjo, Setianto B. Presentasi dan diskusi Survey II Monica Jakarta 1993. Balitbang Depkes RI Jakarta, 1994.
4. Boedhi-Darmojo. Penelitian penyakit Kardiovaskular di masyarakat pedesaan. Medika 1996; 6:450-7.
5. Darmojo B. Beberapa data dan masalah hipertensi di Indonesia. In Bunga Rampai karangan ilmiah, Buku II Kardiovaskular FK UNDIP, Semarang, 1980.
6. Baecke JA, Burema J, Frijter JE. A short questionnaire for the measurement of habitual physical activity in epidemiological studies. Am J Clin Nutr, 1982; 36:936-42. 7. Edward AC, Ronald GN. A Comprehensive Guide to
Wellness. Ballantine Books, USA, 2004
8. Hair JfF Jr, Anderson RE, Tatham RL, Black WC. Multivariate Data Analysis. Prentice Hall, New Jersey, USA, 1998.
9. Preuss HG, Gondal JA, Lieberman S. Association of macronutrients and energy intake with hypertension. J Am Coll Nutr 1996; 15:21-35.
10. WHO Scientific Group. Primary prevention of essential hypertension. WHO Technical Report Series 686. Geneva, 1983.
11. Joint National Committee on Prevention, Detection, Evaluation and Treatment of High Blood Pressure. The Sixth Report of the Joint National Committee on Prevention, Detection, Evaluation and Treatment of High Blood Pressure. NIH Publication, Bethesda, USA, 1997. 12. Kamso S, Sutanto P. Studi Epidemiologi Bagi Upaya
Kesehatan Usia Lanjut di Daerah Perkotaan dan Pedesaan di Propinsi Jawa Barat. FKMUI, Jakarta, 1994.
13. Folsom AR, Burke GL, Byers CL, Hutchkinson RJ, Heiss G, Flack JM, Jacobs DR, Caan B. Implications of obesity for cardiovascular disease in blacks : the CARDIA and ARIC studies. Am J Clin Nutr 1991;53(6 Suppl):1604S-11S. 14. Kannel WB. Fifty years of Framingham Study contribution
to understanding hypertension. J Hum Hypertens 2000; 14:83-90.
15. Side X, Mingtang S, Shuquan Z, Zhaomei M, Yinzhi X, Yuyun L, Jun W, Kui J. Anthropometric and dietary survey of elderly Chinese. Br J Nutr 1991; 66:355-62. 16. Cassano PA. Body fat distrbution, blood pressure, and
hypertension A prospective cohort study of men in the normative aging study. Ann Epidemiol 1990; 1:33-48. 17. Siani A, Cappuccio FP, Barba G, Trevisan M, Farinaro E,
Lacone R, Russo O, Russo P, Mancini M, Strazzullo P. The relationship of waist circumference to blood pressure: the Olivetti Heart Study. Am J Hypertens 2002; 15(9):780-6.