ISSN 1818-4952
© IDOSI Publications, 2014
DOI: 10.5829/idosi.wasj.2014.32.08.534
Corresponding Author: N.A. Abidullah, Faculty of Electrical Engineering,
Universiti Teknikal Malaysia Melaka (UTeM) Melaka, Malaysia.
Real-Time Power Quality Disturbances Detection and Classification System
N.A. Abidullah, A.R. Abdullah, A. Zuri Sha'ameri, N.H. Shamsudin, N.H.H. Ahmad and M.H. Jopri
1 2 3 4 5 6
Faculty of Electrical Engineering, Universiti Teknikal Malaysia Melaka (UTeM) Melaka, Malaysia
1,2,4,5,6
Faculty of Electrical Engineering, Universiti Teknologi Malaysia (UTM), Malaysia
3
Abstract: Power quality disturbances present noteworthy ramifications on electricity consumers, which can affect manufacturing process, causing malfunction of equipment and inducing economic losses. Thus, an automated system is required to identify and classify the signals for diagnosis purposes. The development of power quality disturbances detection and classification system using linear time-frequency distribution (TFD) technique which is spectrogram is presented in this paper. The TFD is used to represent the signals in time-frequency representation (TFR), hence it is handy for analyzing power quality disturbances. The signal parameters such as instantaneous of RMS voltage, RMS fundamental voltage, total waveform distortion (TWD), total harmonic distortion (THD) and total non-harmonic distortion (TnHD) are estimated from the TFR to identify the characteristic of the signals. The signal characteristics are then served as the input for signal classifier to classify power quality disturbances. Referring to IEEE Std. 1159-2009, the power quality disturbances such as swell, sag, interruption, harmonic and interharmonic are discussed. Standard power line measurements, like voltage and current in RMS, active power, reactive power, apparent power, power factor and frequency are also calculated. To verify the performance of the system, power quality disturbances with various characteristics will be generated and tested. The system has been classified with 100 data at SNR from 0dB to 40dB and the outcomes imply that the system gives 100 percent accuracy of power quality disturbances classification at 34dB of SNR. Since the low absolute percentage error present, the system achieves highly accurate system and suitable for power quality detection and classification purpose.
Key words: Real-Time Power Quality Disturbances Time-Frequency Distribution Time-Frequency Representation Spectrogram
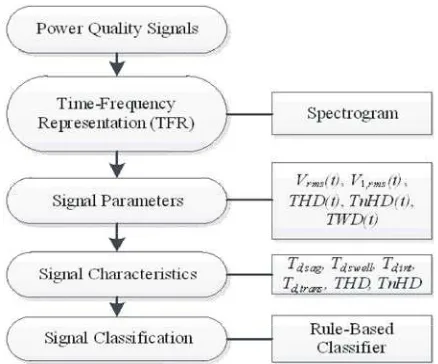
INTRODUCTION failures [3]. The difficulty of power quality disturbances The quality of power system has become a vital knowledge in many areas of electrical power [4]. A poor concern to electricity users at all levels of usage. The power quality can cause problems like diminishing the ability to maintain the constant amplitude and lifetime of the load, erroneous of protection devices, fundamental frequency of voltage and current signals instabilities and interruptions in production as well as presents the quality of electrical power supplied to significant costs due to lost production and downtime. customers [1]. The power quality disturbances can cause Power quality disturbances analysis is carried out failure or disoperation of equipment and economic using transformation technique. There are several problem. Thus, it is essential to establish a real-time power techniques for identifying or classifying power quality quality disturbances detection and classification system disturbances that presented by other researchers [5]. for providing plenty exposure of the overall system, The most widely adopted approach in signal processing understanding the causes of these disturbances, is spectral analysis using Fourier analysis which is Fourier resolving existing problems and predicting future transform where it is a tremendous technique for
problems [2]. analyzing stationary signal because the characteristics
1 phase [6, 7]. The time-frequency representation is
introduced to vanquish the limitation of this technique. There are numerous time frequency distributions techniques namely short time Fourier transform (STFT), spectrogram, Gabor transform, S-transform and wavelet transform [5-10]. However, this paper focuses on spectrogram which is time frequency analysis technique for distinguishing the signals in time frequency domain. Spectrogram which is squared magnitude of STFT gives the time waveform energy distribution in joint-time frequency domain where this technique is used in many applications and widely used as an initial investigative tool as it has the property of being a cross-term free TFD[11].
In this paper, spectrogram technique is implemented
in the power quality disturbances detection and Fig. 1: Flow chart of the general system design classification system. The disturbances are analyzed by
representing the signals in time frequency representation (1)
(TFR). Then, the parameters such as RMS and fundamental value, total harmonic distortion (THD), total
non-harmonic distortion (TnHD) and total waveform (2)
distortion (TWD) for voltage and current are evaluated from TFR and used for the classification of power quality disturbances such as voltage swell, sag, interruption,
harmonic, interharmonic and transient. The general (3)
system design based on IEEE Std. 1159-2009 is shown in flow chart in Fig. To verify its performance and
classification, the system has been tested with 100 signals (4)
at SNR from 0dB to 40dB. The percentage of accuracy for classification system is presented.
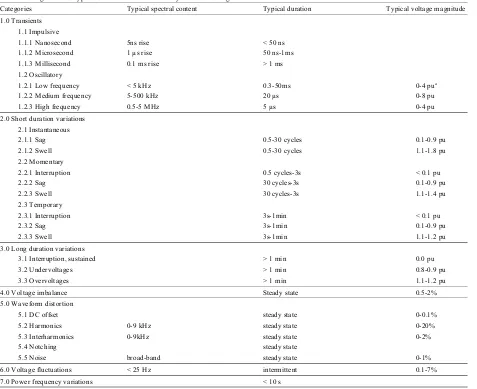
Power Quality Disturbances: In International waveform distortion, z (t) represents transient signal, Electrotechnical Commission (IEC) standard, the A is the signal component amplitude, k is the signal information regarding magnitude, duration and typical component sequence, f andf are the signal frequency, spectral for each of electromagnetic phenomenon are (t) is a box function of the signal, t is the time,
classified into several groups as categorized in Table 1 In this analysis, f,t and t are set at 50 Hz, 0 ms and [12]. Common types of disturbance occur in power system 200 ms, respectively and other parameters are defined as are voltage sag, swell, overvoltage, undervoltage, below:
harmonic, interharmonic, transient, notching and
interruption based on IEEE Std. 1159-2009. 1. Sag : A = A = 1, A = 0.8, t = 100ms, t = Signal Model: The power quality disturbances can be 2. Swell : A = A = 1, A = 1.4, t = 20ms, t = categorized into three types of signals which are voltage 80ms
variation, waveform distortion and transient signal. 3. Interruption : A = A= 1, A= 0, t = 100 ms,t = Voltage variation consists of interruption, voltage swell 140ms
and sag while harmonic and interharmonic are categorized 4. Harmonic : A= 0.5, f = 200 Hz as waveform distortion. The signal models of the 5. Non-harmonic : A= 0.25, f = 275 Hz
categories according to IEEE Std. 1159-2009 are formed 6. Transient : A= 0.5,f = 1000 Hz, t= 100ms, t = and written as a complex exponential signal as [8, 9, 13]: 115ms
where,zvv(t) represents voltage variation, zwd(t) represents
2
Table 1: Categories and Typical Characteristics of Power System Electromagnetic Phenomena
Categories Typical spectral content Typical duration Typical voltage magnitude 1.0 Transients
1.1 Impulsive
1.1.1 Nanosecond 5ns rise < 50 ns 1.1.2 Microsecond 1 µs rise 50 ns-1ms 1.1.3 Millisecond 0.1 ms rise > 1 ms 1.2 Oscillatory
1.2.1 Low frequency < 5 kHz 0.3-50ms 0-4 pua
1.2.2 Medium frequency 5-500 kHz 20 µs 0-8 pu 1.2.3 High frequency 0.5-5 MHz 5 µs 0-4 pu 2.0 Short duration variations
2.1 Instantaneous
2.1.1 Sag 0.5-30 cycles 0.1-0.9 pu 2.1.2 Swell 0.5-30 cycles 1.1-1.8 pu 2.2 Momentary
2.2.1 Interruption 0.5 cycles-3s < 0.1 pu 2.2.2 Sag 30 cycles-3s 0.1-0.9 pu 2.2.3 Swell 30 cycles-3s 1.1-1.4 pu 2.3 Temporary
2.3.1 Interruption 3s-1min < 0.1 pu 2.3.2 Sag 3s-1min 0.1-0.9 pu 2.3.3 Swell 3s-1min 1.1-1.2 pu 3.0 Long duration variations
3.1 Interruption, sustained > 1 min 0.0 pu 3.2 Undervoltages > 1 min 0.8-0.9 pu 3.3 Overvoltages > 1 min 1.1-1.2 pu 4.0 Voltage imbalance Steady state 0.5-2% 5.0 Waveform distortion
5.1 DC offset steady state 0-0.1% 5.2 Harmonics 0-9 kHz steady state 0-20% 5.3 Interharmonics 0-9kHz steady state 0-2% 5.4 Notching steady state
5.5 Noise broad-band steady state 0-1% 6.0 Voltage fluctuations < 25 Hz intermittent 0.1-7% 7.0 Power frequency variations < 10 s
Power Quality Analysis Techniques with time. It is the result of calculating the frequency Spectral Analysis: The determination of the frequency spectrum of windowed frames of a compound signal [11]. content of signal is acquired through the conversion of This technique can be expressed as:
the signal from time domain to frequency domain is known
as spectral analysis as discussed in equation (5). (6)
(5)
where,f is the frequency to be analyzed.
Time-Frequency Distribution: Instead of using spectral power qualities such as voltage, current, active power, analysis, spectrogram is one of the time-frequency reactive power, apparent power, power factor and distribution (TFD) that portrays the signal in both time frequency are executed by the system.
and frequency domain. It displays square magnitude of
STFT and the analysis technique is an improvement from Voltage Measurement: Voltage is measured in the range limitation of Fast Fourier Transform (FFT) to cater non- from 0 to 300volts. Voltage transducer is connected to the stationary signals whose spectral characteristics change system to step down the voltage and acts as isolation where, x( ) is the input signal, w(t) is the observation window.
2
between power line and the system that will interface Instantaneous RMS Fundamental Voltage: using DAQ card. It will sample the signal and calculate the Instantaneous RMS fundamental voltage is defined as voltage in RMS value by using the following equation: the RMS voltage at power system frequency and can be
(7) Current Measurement: The range of current measured between 0 to 100A. The current transducer, which is
connected to the input of DAQ card will sampled the (14)
current signal and calculated in RMS value using this
equation: where,f is the fundamental frequency that corresponds
(8) set to 50Hz.
Power Measurement: Power measurements consist of Total Waveform Distortion (TWD) can be expressed as active power, reactive power, apparent power and power sum of harmonic distortion and non-harmonic distortion. factor. These can be calculated as follows: It can be obtained by:
(9) (15)
(10) where,V is the instantaneous RMS voltage,V is the
(11) Instantaneous Total Harmonic Distortion: Total harmonic (12) and can be expressed as:
Power Quality Parameters: From the time-frequency (16)
representation (TFR), the signal parameters are estimated to identify characteristics of the signal. Instantaneous
root mean square (RMS) voltage, instantaneous RMS where, V (t) is the RMS harmonic voltage, H is the fundamental voltage, instantaneous total waveform highest measured harmonic component.
distortion, instantaneous total harmonic distortion and
instantaneous total interharmonic distortion are the list of Instantaneous Total Non-Harmonic Distortion: signal parameters that used for detection of power quality Non-harmonics contain frequency components which are disturbances [8]. not multiple integer of the power system frequency and it Instantaneous RMS Voltage: The RMS voltage, Vrms can
also be derived from TFR in time and referred as (17)
instantaneous RMS voltage, Vrms is mentioned by [8] as:
(13) calculated from the signal parameters. The
where,Px (t,f) is the time-frequency distribution, fmax is the average of RMS voltage, are used as the input for maximum frequency of interest. signal classifier to classify power quality disturbances.
calculated as:
1
to the power system frequency, fis the bandwidth. fis
Instantaneous Total Waveform Distortion: Instantaneous
rms rms
instantaneous RMS fundamental voltage.
distortion is used to identify harmonic content in a signal
h,rms
can be written as:
,
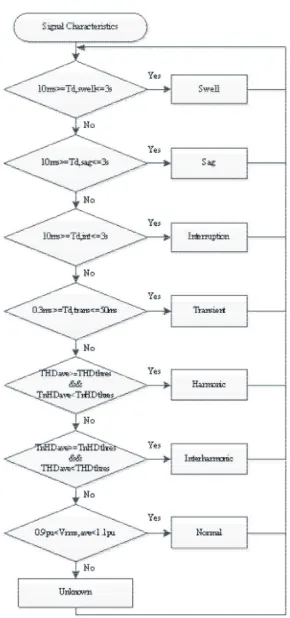
The signal characteristics of voltage variation are The signal characteristics are consists of duration of calculated from the instantaneous RMS voltage [8]. swell, sag, interruption and transient and average of RMS The other characteristics of the signal can also be voltage, total harmonic distortion and total interharmonic estimated and defined as follows: distortion. Based on the signal characteristics, the flow (18) power quality disturbances. The threshold settings of the
(19) System Developments: The power quality disturbances
(20) used as input can measure power line voltage and current
(21) with computer.
Meanwhile, the signal characteristics of transient In this system, NI USB 6009 is used to give better signal can be identified from the instantaneous total accuracy, flexible, maximized performance and cost-waveform distortion. The duration of transient can be effective measurement solution. It provides connection to
expressed as: eight single-ended analog input (AI) channels, two analog
(22) channels and a 32-bit counter with a full-speed USB
where, TWDtrans,thres is the total waveform distortion AI 1 (AI 1+) and AI 5 (AI 1-) for current transducer. threshold for transient. The threshold is set at 0.05. On computer, a user-friendly graphical user interface
For analyzing the signal characteristic of waveform (GUI) is developed using Visual Basic to analyze the distortion the instantaneous total harmonic distortion and captured signals from DAQ and then displays and record instantaneous total interharmonic distortion are used in the signal parameters. Visual Basic is a programming gaining the average of total harmonic and interharmonic system that offers new integrated development distortion as in equation below: environment. It is a tool used to design and create (23) Microsoft Windows of operating systems. The interface
programmers. (24)
Signal Classifications: The rule-based classifier is a validation is shown in Fig. 4. Input voltage is supplied to deterministic classification method that has been widely RLC load and the measurements are collected using the used in real world application. The performance of the system and fluke power quality analyzer (PQA). In order classification is much dependent on the expert rules and to present the accuracy, the performance of the system threshold settings. The system is simple and easy to measurement is verified based on mean absolute implement. In this analysis, since the signal characteristics percentage error (MAPE) [13]. Smaller value of MAPE provide good prior knowledge of the power quality shows high accuracy of the measurement. The MAPE is signals, the rule-based classifier is suitable to be used for adopted to evaluate the accuracy of measurement and can signal classification [4, 14]. be expressed as follows:
chart in Fig. 2 are described a rule based classifier of the signal characteristics to classify the disturbances are set based on IEEE std. 1159-2009.
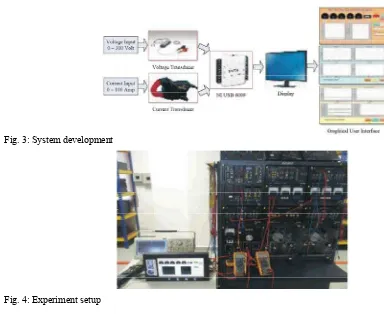
classifiction system consists of three major parts which are input, interfacing and computer as shown in Fig. 3. In this system, voltage and current transducers that are up to 500 V and 100 A, respectively. The transducers are connected to data acquisition card (DAQ) for interfacing DAQ involves the conversion of analog waveforms into digital values and transfers the data to computer.
output (AO) channels, 12 digital input/output (DIO) interface. The input that have been used in this system is AI 0 (AI 0+) and AI 4 (AI 0-) for voltage transducer and
graphical user interface (GUI) applications for the of Visual Basic is well organized, optimized for fast functionality and its simplicity is an advantage for
( )
( )
( )
1
1
100% N
i m
i n
x n x n
N x n
MAPE
=
−
×
=
∑
Fig. 3: System development
Fig. 4: Experiment setup
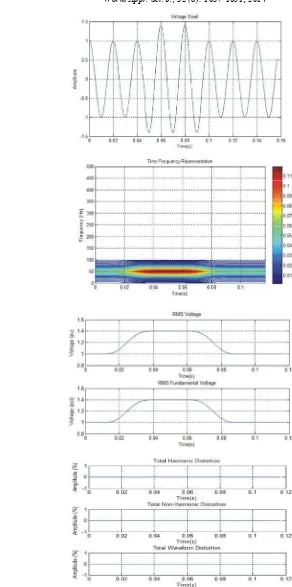
The example of signal parameters for harmonic is (25) illustrated in Fig.6. Fig. 6(a) shows the harmonic signal in
where,xi(n) is actual value, xm(n) is measured value, N is fundamental frequency, 50 Hz and multiple frequency
number of data components, 200Hz as indicated in contour plot. The RMS
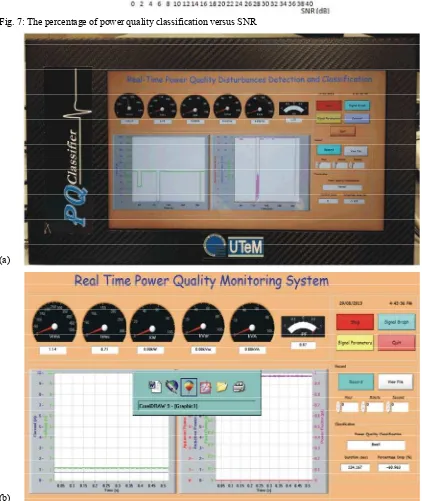
RESULTS signal are shown in Fig. 6(c) respectively, constant at 1.0 Simulation Results: Power quality disturbances are are steady at 50% while for TnHD is zero along the axis. simulated using MATLAB and analyzed using Therefore the figures clearly show that the signals only spectrogram technique to identify their characteristics. consist of harmonic component and the classification can The example of swell signal with increasing the magnitude be determined based on these signal parameters obtained. is shown in Fig. 5(a). The TFR are obtained using By using rule-based classifier, the power quality Hanning window with size 256 is presented in Fig. 5(b). disturbances with various characteristics are analyzed and The red color represents the highest power of the signal classified. The system has classified with 100 signals of while blue color indicates the lowest power. The TFR power quality disturbances at SNR from 0dB to 40dB and shows that the magnitude of the signal increases from the percentage graph of power quality classification 20 to 80ms and its frequency is 50 Hz. Based on the TFR, against SNR is plotted as shown in Fig. 7. From the graph Fig. 5(c) and 5(d) show the parameters of the swell plotted, the system achieves precise power quality signals. Fig. 5(c) presents that a momentary voltage classification starting point at 34 db of SNR. Interruption increase from 1.0 to 1.4pu starting at 20ms for duration of signal presents the high performance accuracy where it 60ms for RMS fundamental voltage and RMS voltage. gives 100% correct at 10 db while the low performance is For THD, TnHD and TWD, there is no value because the normal signal which indicated 100% correct at 34 db of signals only occur at fundamental frequency which is SNR. Thus, it is proved that spectrogram is suitable to be
50Hz. implemented in a classification system.
time domain while its TFR is presented in Fig. 6(b). The signal consists of two frequency components which are
(a)
(b)
(c)
(d)
(a)
(b)
(c)
(d)
Fig. 7: The percentage of power quality classification versus SNR
(a)
Continued Fig. 8:
(c)
(d)
(e)
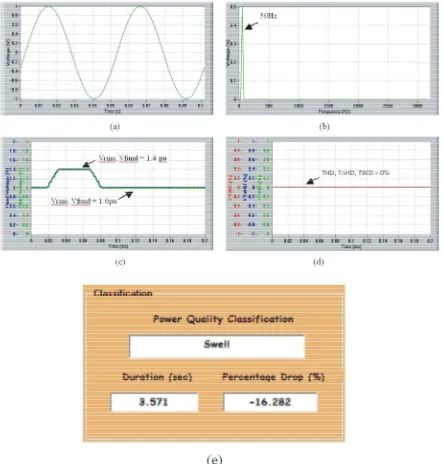
Fig. 9: (a) Swell Signal in time domain, (b) Frequency component, (c) RMS voltage and RMS fundamental voltage, (d) THD, TnHD and TWD, (e) System classification
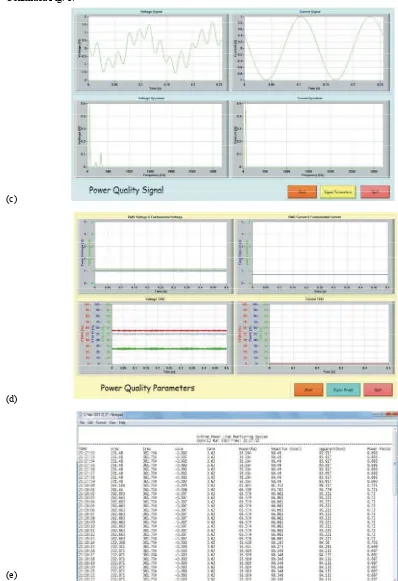
System Results: The development GUI of the power characteristics information of the signals computes of quality disturbances detection and classification the duration and percentage drop. In Fig. 8(c), the voltage system is shown in Fig. 8(a). The system is able to and current signals are represented in time and frequency measure standard power line measurements such as domain.
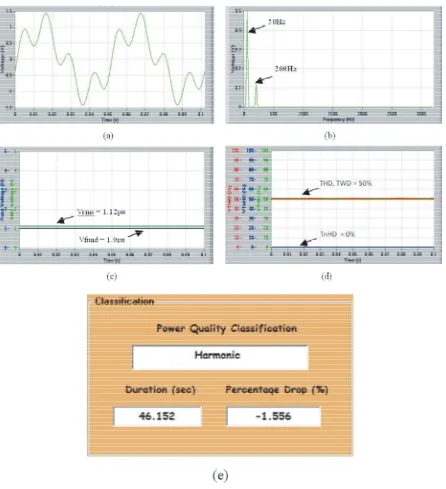
Fig. 10: (a) Harmonic Signal in time domain, (b) Frequency component, (c) RMS voltage and RMS fundamental voltage, (d) THD, TnHD and TWD, (e) System classification
classification of power quality disturbances. In Fig. 9(a) shows a swell signal in time domain while its power spectrum is represented in Fig. 9(b). As presented in the power spectrum, the fundamental frequency is 50 Hz and the magnitude of the signal increases from 1.0 to 1.4 pu for both RMS and fundamental voltage from 20 to 80ms as displayed in Fig. 9(c). The value of THD, TnHD and TWD generated ‘0’ percentage since the signal only occurs at fundamental frequency as illustrated in Fig. 9(d). The
type, duration and percentage drop of the signal are also Fig. 11: Voltage and current verification provided in the system as represented in Fig. 9(e) to give
better information of the signal. The region which voltage swell happened is indicated as 3.571sec and 16.282% of percentage drop.
Other than that, the example of waveform distortion which is harmonic signal in time domain is shown in Fig. 10(a) meanwhile the signal that consists of two frequency components which are fundamental frequency, 50Hz and multiple frequency, 200Hz represented as 4th
harmonic as illustrated in Fig. 10(b). In Fig.10(c), the RMS Fig. 12: Current verification voltage and RMS fundamental voltage of the harmonic
signal are, respectively, constant at 1.12 pu and 1.0 pu. There is 50% of display percentage for THD and TWD as shown in Fig. 10 (d) whereas the example of harmonic signal only consists of harmonic component, so there is no value for the TnHD. In addition, the system offered more information such as type, duration and percentage drop of the signal for classification system as displayed in GUI of the system as shown in Fig. 10(e). The region
which harmonic happened is indicated as 46.152sec and Fig. 13: Power measurement verification 1.556% of percentage drop.
Based on the measured values for voltage and current The low percentage of MAPE proved the close using the system, the results obtained are comparable to resemblance of the value measured by proposed system the measured values using PQA. Referring to Fig. 11, 12 with that of PQA, thus indicating the system proposed is and 13, the measured value versus actual value for indeed efficient.
voltage, current and power measurement are illustrated in
the graph. According to the graph plotted in Fig. 11 and CONCLUSION Fig. 12, it represents voltage and current using PQA and
100 percent accuracy at 34dB of SNR. Therefore, it clearly 7. Mittal, D., O.P. Mahela and R. Jain, 2012. shows that time-frequency distribution (TFD) which is "Classification of Power Quality Disturbances in spectrogram is suitable to be used for classification Electric Power System: A Review," IOSR Journal of system. An automated signal classification system using Electrical and Electronics Engineering, 3: 06-14. spectrogram is developed successfully to identify, 8. Huda, N.H.T., A.R. Abdullah and M.H. Jopri, 2013. classify as well as provide the information of the signal. "Power quality signals detection using S-transform," Besides that, the system is able to show the signal in Power Engineering and Optimization Conference including the standard power line measurements, its (PEOCO), 2013 IEEE 7 International, pp: 552-557. power spectrum and signal parameters that also can be 9. Abdullah, A. and A. Sha'ameri, 2010. "Power Quality stored in computer, automatically. Analysis Using Bilinear Time-Frequency
ACKNOWLEDGMENT Signal Processing, pp: 837360.
The authors would like to thank Faculty of Electrical S-Transform-Based Identification of Nonlinear Loads Engineering of Universiti Teknikal Malaysia Melaka in a Power System," Arab J. Sci. Eng.
(UTeM) and to the Ministry of Science, Technology and 11. Abidin, N.Q.Z., A.R. Abdullah, N.H. Rahim, Innovation (MOSTI) for providing the research grant 06- N. Norddin and A. Aman, 2013. "Online surface 01-14-SF00119 L00025 for this research. Their support is condition monitoring system using time-frequency gratefully acknowledged. analysis technique on high voltage insulators," in Power Engineering and Optimization Conference
REFERENCES (PEOCO), 2013 IEEE 7 International, pp: 513-517.
1. Beaty, H.W. and D.G. Fink, 2013. Standard Handbook Power Quality," IEEE Std 1159-2009 (Revision of IEEE for Electrical Engineers (16 ed.). McGraw-Hill.th Std 1159-1995), pp: c1-81, 2009.
2. Howe, B., 2007. "A New vision of PQ research for the 13. Abdullah, A.R., N.H.T.H. Ahmad, A.Z. Shameri, next 10 years," in International Conference on N.A. Abidullah, M.H. Jopri and E.F. Shair, 2013. Electrical Power Quality and Utilisation. "Optimal Kernel Parameters of Smooth-Windowed 3. Azam, M.S., T. Fang, K.R. Pattipati and R. Kuaranam, Wigner Distribution for Power Quality Analysis,"
2004. "A Dependency Model-based Approach for Journal of Basic and Applied Physics, 2: 235-242. Identifying and Evaluating Power Quality Problems.," 14. Abdullah, A.R., A.Z. Sha'ameri, A.R.M. Sidek and
pp: 1154-1166. M.R. Shaari, 2007. "Detection and Classification of
4. Manjunath, L.R.A. and E. Prathibha, 2012. Power Quality Disturbances Using Time-Frequency "Developments of Mathematical Models for Various Analysis Technique," in Research and Development, PQ Signals and Its Validation for Power Quality 2007. SCOReD 2007. 5 Student Conference on, 2007, Analysis," International Journal of Engineering pp: 1-6.
Research and Development, 1: 37-44. 15. Shklyarskiy, Y. and A. Skamyin, 2014. “High 5. Bollen, M.H. and I. Gu, 2006. Signal Processing of Harmonic Minimization in Electric Circuits of Power Quality Disturbances: Wiley. Industrial Enterprises,” World Appl. Sci. J., 6. Axelberg, G.I.Y., P.G.V. and M.H.J. Bollen, 2007. 30(12): 1767-1771.
"Support Vetor Machine for classification of voltage disturbances," in IEEE Trans. Power Delivery, 2007, pp: 1297-1303.
th
Distributions," EURASIP Journal on Advances in 10. Pullabhatla, S. and A.K. Chandel, 2013. "Inverse
th
12. "IEEE Recommended Practice for Monitoring Electric