Performance Verification of Power Quality Signals Classification System
A. R. Abdullah
1, a *,
N. A. Abidullah
1, b,
N. H. Shamsudin
1, c,
N. H. H. Ahmad
1, dand M. H. Jopri
2, e1Faculty of Electrical Engineering, Universiti Teknikal Malaysia Melaka, Malaysia
2Faculty of Technology Engineering, Universiti Teknikal Malaysia Melaka, Malaysia
a*[email protected], b[email protected], c[email protected] d[email protected], e[email protected]
Keywords: Power quality, Time-frequency distribution and spectrogram
Abstract. Power quality has become a greater concern nowadays. The increasing number of power electronics equipment contributes to the poor quality of electrical power supply. The power quality signals will affect manufacturing process, malfunction of equipment and economic losses. This paper presents the verification analysis of power quality signals classification system. The developed system is based on linear time-frequency distribution (TFD) which is spectrogram that represents the signals jointly in time-frequency representation (TFR). The TFD is very appropriate to analyze power quality signals that have magnitude and frequency variations. Parameters of the signal such as root mean square (RMS) and fundamental RMS, total waveform distortion (TWD), total harmonic distortion (THD) and total non-harmonic distortion (TnHD) of voltage signal are estimated from the TFR to identify the characteristics of the signal. Then, the signal characteristics are used as input for signal classifier to classify power quality signals. In addition, standard power line measurements are also calculated from voltage and current such as RMS and fundamental RMS voltage and current, real power, apparent power, reactive power, frequency and power factor. The power quality signals focused are swell, sag, interruption, harmonic, interharmonic, and transient based on IEEE Std. 1159-2009. The power quality analysis has been tested using a set of data and the results show that, the spectrogram gives high accuracy measurement of signal characteristics. However, the system offers lower accuracy compare to simulation due to the limitation of the system.
Introduction
The modern electronic devices in electrical system are more sensitive to power quality issues than those from the older days. The control system equipped in the devices can be malfunctioned because of the varying supply conditions. For instance, the proper operation of microcontrollers, computers, and programmable logic controllers (PLC) depended on the voltage quality supplied to them [1]. They are sensitive and vulnerable to power quality signals. Thus, power quality signals classification system is needed to provide adequate coverage of the whole system, understand the causes of these signals, resolve existing and predict future problems [2]. Prompt and accurate diagnosis of signals will ensure quality of power, reduce the risk of interruptions by reducing the time to diagnose and rectify failures [3].
Power quality signals analysis is carried out using transformation technique. The most used in signal processing is spectral analysis using Fourier analysis which is Fourier transform [4]. Fourier transform is suitable technique for stationary signal and extracting spectrum components of the signals at specific frequencies. In addition, the characteristics of the signal do not change with time but it is not efficient to detect the changes in the magnitude, frequency or phase for non-stationary signal [5, 6]. Thus, time-frequency distribution (TFD) is introduced to overcome the limitation of the technique. There are several linear TFDs which are short-time Fourier transform (STFT), spectrogram, Gabor transform, S-transform and wavelet transform [4-8]. However, this paper focuses on spectrogram to analyze power quality signals in time-frequency representation (TFR). Spectrogram which is squared magnitude of STFT gives the time waveform energy distribution in joint time-frequency domain and has been used in many applications [9, 10].
Applied Mechanics and Materials Vols. 752-753 (2015) pp 1158-1163 Submitted: 06.10.2014
© (2015) Trans Tech Publications, Switzerland Revised: 11.12.2014
doi:10.4028/www.scientific.net/AMM.752-753.1158 Accepted: 26.12.2014
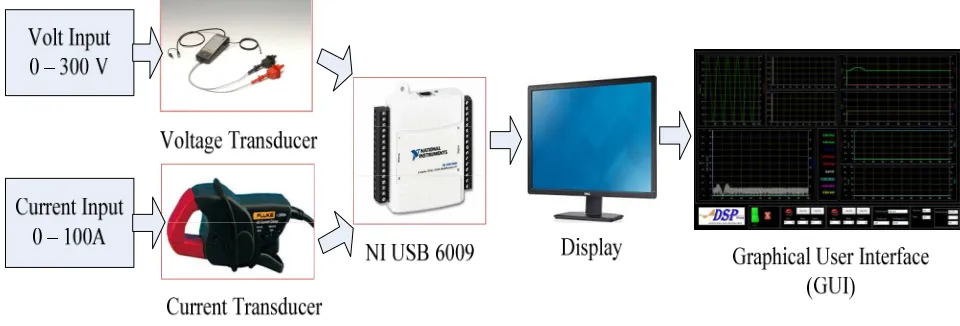
In this paper, spectrogram is implemented for power quality signals classification system. Power quality signals are analyzed by representing the signals in TFR. Parameters of the voltage and current signals are estimated from TFR such as instantaneous of RMS and fundamental RMS, total harmonic distortion (THD), total nonharmonic distortion (TnHD) and total waveform distortion (TWD). Then, the signal characteristics that are calculated from the signal parameter are used as input for signals classification such as sag, swell, interruption, harmonic, interharmonic and transient. The general system design of this research is based on IEEE Std. 1159-2009 as shown in Fig. 1[11].
Fig. 1 Block diagram of the general system design
Signal Processing Techniques
A. Spectral Analysis. Fourier transform (FT) is mathematical technique which converts signal from time to frequency domain. It can be defined as:
2
( ) ( ) j ft
X f = ∫∞ x t e− π dt
−∞ (1)
where x(t) is the signal of interest, t is the time and f is the signal frequency.
B. Spectrogram. Spectrogram is improvement of FFT to cater non-stationary signals whose spectral characteristics change in time [9, 10].This technique can be defined as:
2
where w(τ) is the observation window and x(τ) is the input signal. From the TFR of the signal that calculated using spectrogram, parameters of the signals are estimated and then, signal characteristics are obtained from the signal parameters. The signal characteristics are then used as input for signals classification using rule-based classifier and these processes have been discussed in [8, 9].
System Development
The power quality signals classification system consists of three major parts which are input, interfacing and computer as shown in Fig. 2. Voltage and current transducer capture voltage and current signal, respectively and then, the analog signals are digitized using NI-6009 USB DAQ Card. After that, the DAQ Card is interfaced with computer and is controlled by using Visual Basic 2010.
Fig. 2 System development.
Power Quality
Signals Time-Frequency Representation (TFR)
Results
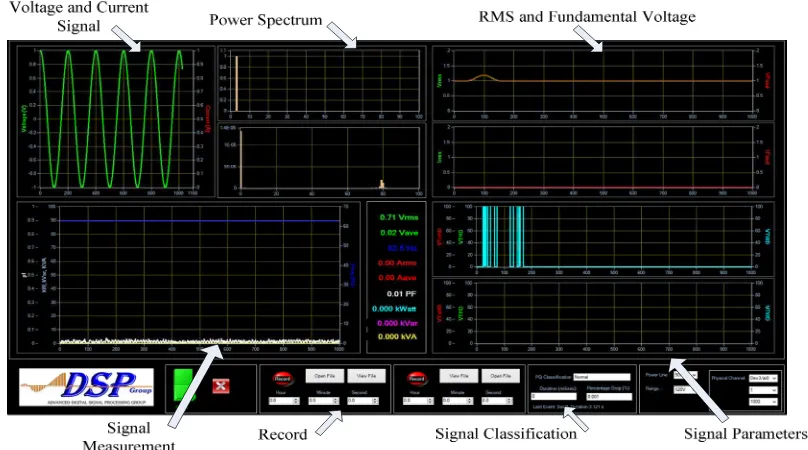
The development of graphical user interface (GUI) for the system is shown in Fig. 3. The system can capture voltage and current signal then, displays in time domain. From the voltage and current signal captured, standard power line masurements are calculated and displayed such as RMS voltage and current, frequency, active power, reactive power, apparent power and power factor. Power spectrum of the signal in frequency domain are also obtained and displayed. The signal parameters such as instantaneous of RMS, fundamental RMS, total waveform distortion, total harmonic distortion and total nonharmonic distortion are calculated and displayed are shown in below. The signal parameters are used to identify the characteristic of the signal as well as are used as an input for signal classification to classify the power quality signals. The system is also can captured and stored all the parameters into computer automatically.
Fig. 3 The graphical user interface of the system
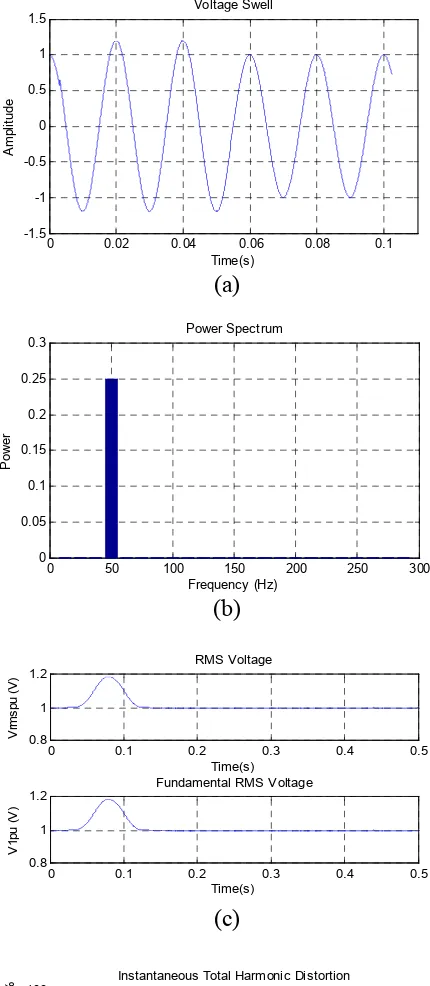
The analysis of power quality signals is simulated using MATLAB. By using spectrogram as an analysis tools, the characteristics of power quality signals is been identified. Spectrogram with Hanning window is performed because it gives better result compared to other windows function. The number of window length, Nw used is 1024 samples because it gives better result in terms of
frequency resolution. For example, swell signal in time domain is shown in Fig. 4. As shown in Fig. 4(a), the magnitude of the signal increases at 0.01 second for duration of 40 millisecond. In Fig. 4(b), the power spectrum of the signal only consists of fundamental frequency which is 50Hz. The instantaneous RMS voltage and instantaneous RMS fundamental voltage clearly show that the magnitude swell signal is 1.2pu and it occurs from 0.07 second to 0.11 second. For instantaneous total waveform distortion, instantaneous total harmonic distortion and instantaneous total nonharmonic distortion as shown in Fig. 4(d), respectively, the signal results give constant value at zero percent. This is because of the signal only consists of fundamental frequency component and have no harmonic and inter-harmonic frequency component.
The similar analysis as simulation is implemented to the system. The analysis of system result is carried out by using Visual Basic 2010. Fig. 5 (a) shows a swell signal in time domain and the magnitude of the signal increases momentarily from 1.0 pu to 1.2 pu starting at 0.01 second to 0.05 second. Power spectrum of the signal is presented in Fig. 5(b) and the signal consists of fundamental frequency which is occurs at 50Hz. In Fig. 5(c), instantaneous RMS voltage and instantaneous RMS fundamental voltage increase from normal voltage (1.0pu) to 1.2 pu, starting at 0.07 second for duration of 40 millisecond. In addition, Fig. 5 (d) shows that the instantaneous total waveform distortion, instantaneous total harmonic distortion and instantaneous nonharmonic distortion
maintain at zero percent. Thus, this parameter clearly shows that the swell signal only consists of fundamental frequency components and does not have harmonic and nonharmonic frequency component.
Fig. 4 (a) Swell signal from simulation, (b) Power spectrum, (c) Instantaneous of RMS and fundamental RMS, (d) Instantaneous of THD,
TnHD and TWD
Fig. 5 (a) Swell signal from from system, (b) Power spectrum, (c) Instantaneous of RMS and
fundamental RMS, (d) Instantaneous of THD, TnHD and TWD
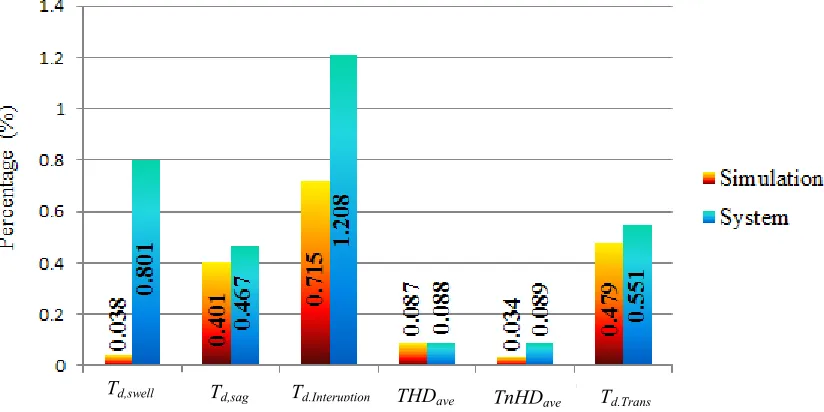
The power quality signal analysis are tested with 20 data and mean absolute percentage error (MAPE) of the signal characteristics are calculated. The accuracy of the measurements indicated by MAPE are shown in bar graph as shown in Fig. 6 for duration of swell, sag, interruption, transient and both average of total harmonic distortion and total nonharmonic distortion for simulation and system. Lower MAPE indicates higher accuracy of measurement and vice versa. The graph shows that, the MAPE values of simulation for all signal charateristics measurements are lower than system and this results prove that, simulation gives higher accuracy compares to the system. However, since the MAPE values of the measurements are lower than 0.715 percent for simulation and system, it presents that spectrogram gives high accuracy for power quality analysis. The accuracy of the system is lower than simulation because of longer processing time needed and error given by voltage and current transducer.
Fig. 6 MAPE of signal characteristics measurements for simulation and system
Conclusion
This paper presents the development and performance verification of the power quality classification system using spectrogram. Signal parameters are estimated from TFR then will be used to calculate signal characteristics which are used as an input to classify power quality signals. An automated signal classification system using spectrogram is successfully developed to identify, classify as well as provide the information of the signal. Besides that, the system is able to show the parameters of signal including the standard power line measurements and power spectrum that also can be stored automatically in computer. The performance verification of power quality signals classification system are evaluated by the value of MAPE for both simulation and system. The results show that spectrogram gives high accuracy for power quality analysis while simulation presents higher accuracy compared to the system. This is due to the limitation of the system such as longer processing time required and error given by voltage and current transducer.
Acknowledgment
The authors would like to thank Faculty of Electrical Engineering of Universiti Teknikal Malaysia Melaka (UTeM) and to the Ministry of Higher Education Malaysia (MOHE) for giving the cooperation and funding to do this research which are ERGS/1/2013/TK02/UTEM/02/02/E00023. Their support is gratefully acknowledged.
THDave
Td,swell Td,sag Td,Interuption THDave TnHDave Td,Trans
References
[1] H.W. Beaty and D.G. Fink, Standard Handbook for Electrical Engineers (16th ed.). McGraw-Hill, (2013).
[2] B. Howe, A New vision of PQ research for the next 10 years, in International Conference on Electrical Power Quality and Utilisation, (2007).
[3] M.S. Azam, F. Tu and K.R. Pattipati, A dependency model-based approach for identifying and evaluating power quality problems, (2004) 1154-1166.
[4] M.H. Bollen and I. Gu, Signal Processing of Power Quality Disturbances: Wiley, (2006).
[5] P.G. V Axelberg, I.Y. Gu, S. Member and M.H.J. Bollen, Support Vector Machine for classification of voltage disturbances, in IEEE Trans. Power Deliv. 22 (2007) 1297-1303.
[6] D. Mittal, O.P. Mahela and R. Jain, Classification of Power Quality Disturbances in Electric Power System: A Review, IOSR J. Electr. Electr. Eng. 3(2012) 06-14.
[7] N.H.T. Huda, A.R. Abdullah and M.H. Jopri, Power quality signals detection using S-transform, in Power Engineering and Optimization Conference (PEOCO), 2013 IEEE 7th International, (2013) 552-557.
[8] A.Z.S. a. A.R. Abdullah, N.A. Mohd Said, N. Mohd Saad and A. Jidin, Bilinear Time-Frequency Analysis Techniques for Power Quality Signals, in Proceedings of the International MultiConference of Engineers and Computer Scientists IMECS 2012, Hong Kong, (2012). [9] A.R. Abdullah, N.A. Abidullah, N.H. Shamsudin, N.H.H. Ahmad and M.H. Jopri, Power Quality
Signals Classification System using Time-Frequency Distribution, Appl. Mech. Mater. 494-495 (2014) 1889-1894.
[10] N.Q.Z. Abidin, A.R. Abdullah, N.H. Rahim, N. Norddin and A. Aman, Online surface condition monitoring system using time-frequency analysis technique on high voltage insulators, in Power Engineering and Optimization Conference (PEOCO), 2013 IEEE 7th International, (2013) 513-517.
[11] IEEE Recommended Practice for Monitoring Electric Power Quality, IEEE Std 1159-2009 (Revision of IEEE Std 1159-1995), (2009) c1-81.